. 2020 Oct 16;69(41):1494-1496.
doi: 10.15585/mmwr.mm6941e1.

Transmission Dynamics by Age Group in COVID-19 Hotspot Counties - United States, April-September 2020

Affiliations

Transmission Dynamics by Age Group in COVID-19 Hotspot Counties - United States, April-September 2020

Alexandra M Oster et al. MMWR Morb Mortal Wkly Rep. .

Abstract

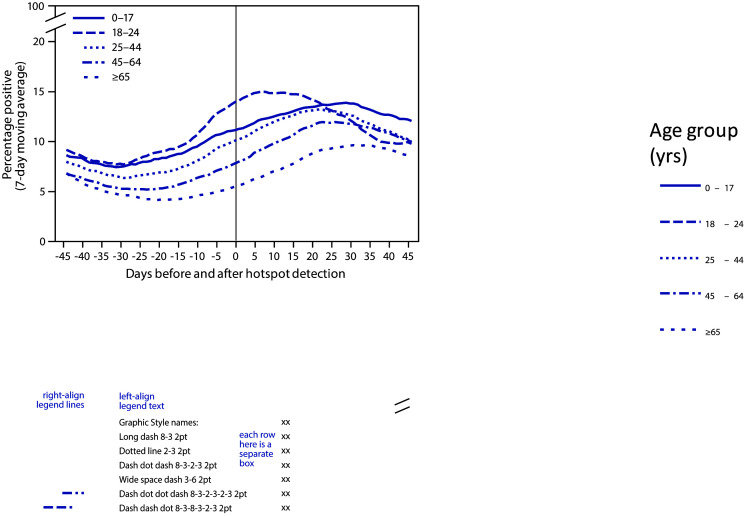
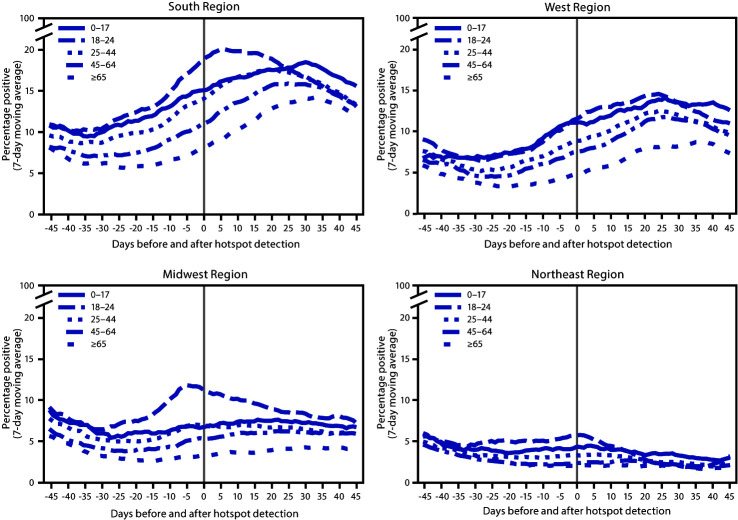
CDC works with other federal agencies to identify counties with increasing coronavirus disease 2019 (COVID-19) incidence (hotspots) and offers support to state, tribal, local, and territorial health departments to limit the spread of SARS-CoV-2, the virus that causes COVID-19 (1). Understanding whether increasing incidence in hotspot counties is predominantly occurring in specific age groups is important for identifying opportunities to prevent or reduce transmission. The percentage of positive SARS-CoV-2 reverse transcription-polymerase chain reaction (RT-PCR) test results (percent positivity) is an important indicator of community transmission.* CDC analyzed temporal trends in percent positivity by age group in COVID-19 hotspot counties before and after their identification as hotspots. Among 767 hotspot counties identified during June and July 2020, early increases in the percent positivity among persons aged ≤24 years were followed by several weeks of increasing percent positivity in persons aged ≥25 years. Addressing transmission among young adults is an urgent public health priority.


Conflict of interest statement

All authors have completed and submitted the International Committee of Medical Journal Editors form for disclosure of potential conflicts of interest. No potential conflicts of interest were disclosed.

Figures

FIGURE 1
FIGURE 1
Percentage of positive SARS-CoV-2 reverse transcription–polymerase chain reaction test results (7-day moving average) in COVID-19 hotspot counties before and after date of hotspot detection, by age group — United States, June 1–July 31, 2020 Abbreviation: COVID-19 = coronavirus disease 2019. * From COVID-19 electronic laboratory reporting data submitted by state health departments for 37 states and from data submitted directly by public health, commercial, and reference laboratories for 13 states and the District of Columbia, using specimen collection or test order date.
FIGURE 2
FIGURE 2
Percentage of positive SARS-CoV-2 reverse transcription–polymerase chain reaction test results (7-day moving average) in COVID-19 hotspot counties before and after date of hotspot detection, by age group and U.S. Census region — United States, June 1–July 31, 2020 Abbreviation: COVID-19 = coronavirus disease 2019. * From COVID-19 electronic laboratory reporting data submitted by state health departments for 37 states and from data submitted directly by public health, commercial, and reference laboratories for 13 states and the District of Columbia, using specimen collection or test order date. South: Alabama, Arkansas, Delaware, District of Columbia, Florida, Georgia, Kentucky, Louisiana, Maryland, Mississippi, North Carolina, Oklahoma, South Carolina, Tennessee, Texas, Virginia, and West Virginia. West: Alaska, Arizona, California, Colorado, Hawaii, Idaho, Montana, Nevada, New Mexico, Oregon, Utah, Washington, and Wyoming. Midwest: Illinois, Indiana, Iowa, Kansas, Michigan, Minnesota, Missouri, Nebraska, North Dakota, Ohio, South Dakota, and Wisconsin. Northeast: Connecticut, Maine, Massachusetts, New Hampshire, New Jersey, New York, Pennsylvania, Rhode Island, and Vermont.

References

    1. Oster AM, Kang GJ, Cha AE, et al. Trends in number and distribution of COVID-19 hotspot counties—United States, March 8–July 15, 2020. MMWR Morb Mortal Wkly Rep 2020;69:1127–32. 10.15585/mmwr.mm6933e2 - DOI - PMC - PubMed
    1. Boehmer TK, DeVies J, Caruso E, et al. Changing age distribution of the COVID-19 pandemic—United States, May–August 2020. MMWR Morb Mortal Wkly Rep 2020;69:1404–9. 10.15585/mmwr.mm6939e1 - DOI - PMC - PubMed
    1. Salvatore PP, Sula E, Coyle JP, et al. Recent increase in COVID-19 cases among adults aged 18–22 years—United States, May 31–September 5, 2020. MMWR Morb Mortal Wkly Rep 2020;69:1419–24. 10.15585/mmwr.mm6939e4 - DOI - PMC - PubMed