. 2020 Oct 14;11(1):5183.
doi: 10.1038/s41467-020-18987-4.

Pan-neuroblastoma analysis reveals age- and signature-associated driver alterations

Affiliations

Pan-neuroblastoma analysis reveals age- and signature-associated driver alterations

Samuel W Brady et al. Nat Commun. .

Abstract

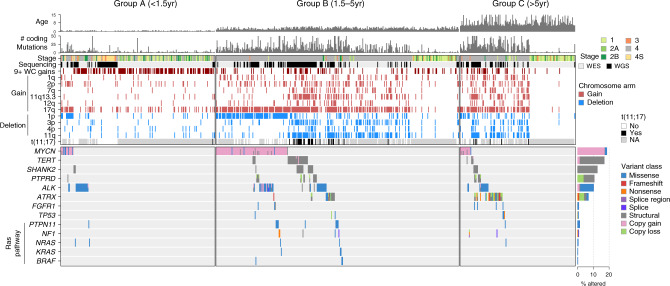
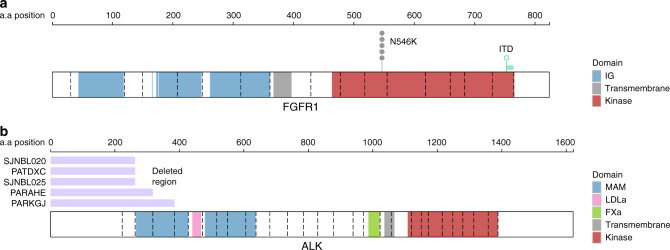
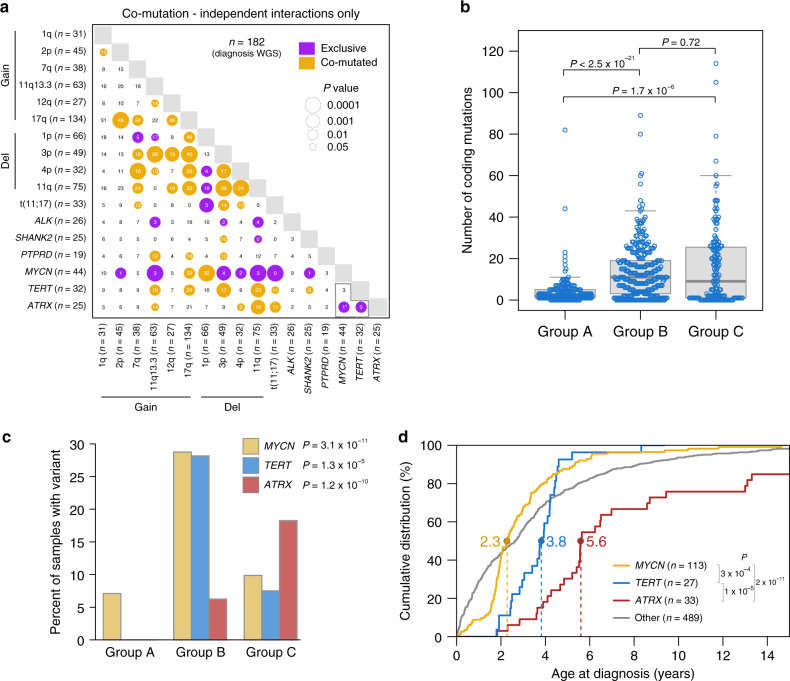
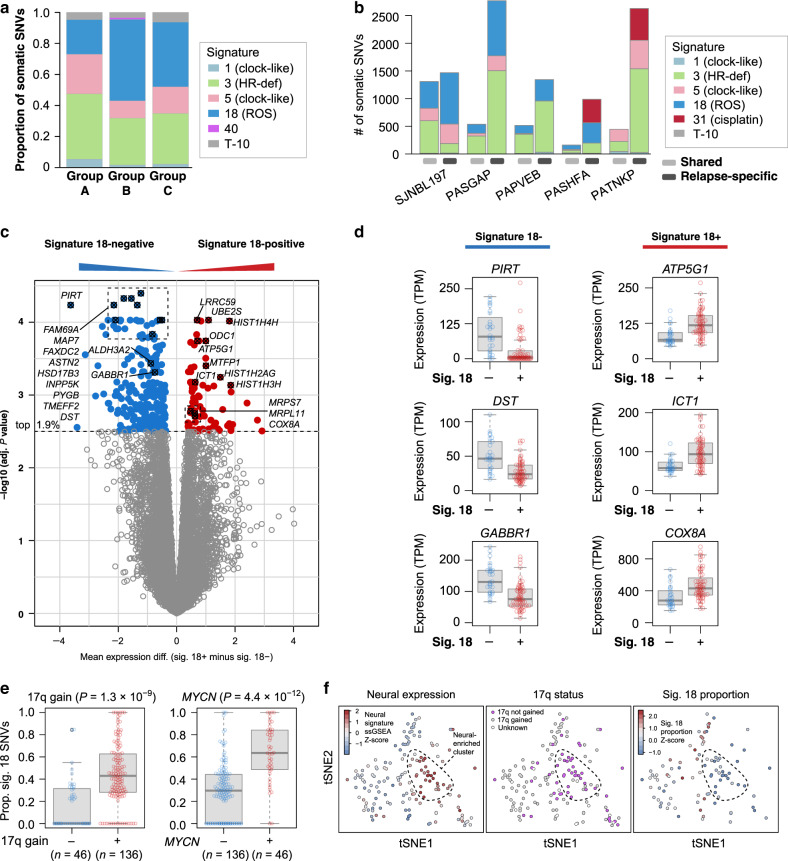
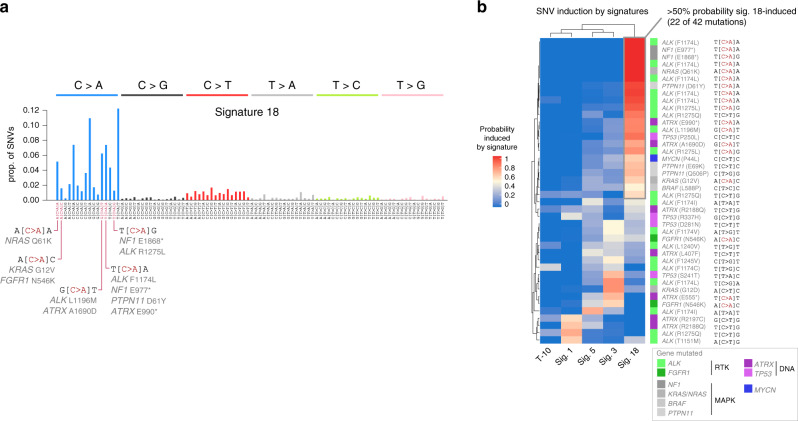
Neuroblastoma is a pediatric malignancy with heterogeneous clinical outcomes. To better understand neuroblastoma pathogenesis, here we analyze whole-genome, whole-exome and/or transcriptome data from 702 neuroblastoma samples. Forty percent of samples harbor at least one recurrent driver gene alteration and most aberrations, including MYCN, ATRX, and TERT alterations, differ in frequency by age. MYCN alterations occur at median 2.3 years of age, TERT at 3.8 years, and ATRX at 5.6 years. COSMIC mutational signature 18, previously associated with reactive oxygen species, is the most common cause of driver point mutations in neuroblastoma, including most ALK and Ras-activating variants. Signature 18 appears early and is continuous throughout disease evolution. Signature 18 is enriched in neuroblastomas with MYCN amplification, 17q gain, and increased expression of mitochondrial ribosome and electron transport-associated genes. Recurrent FGFR1 variants in six patients, and ALK N-terminal structural alterations in five samples, identify additional patients potentially amenable to precision therapy.


Conflict of interest statement

N.V.C. reports receiving commercial research grants from Y-mabs Therapeutics and Abpro-Labs Inc., holding ownership interest/equity in Y-Mabs Therapeutics Inc., holding ownership interest/equity in Abpro-Labs, and owning stock options in Eureka Therapeutics. N.V.C. is the inventor of issued and pending patents filed by Memorial Sloan-Kettering Cancer Center (MSK), including those licensed by MSK to Ymabs Therapeutics, Biotec Pharmacon, and Abpro-labs. Both MSK and N.V.C. have financial interest in Y-mabs. N.V.C. is an advisory board member for Abpro-Labs and Eureka Therapeutics. The remaining authors declare no competing interests.

Figures

Fig. 1
Fig. 1. Recurrent somatic alterations by age group in neuroblastoma.
Top, age at diagnosis and number of coding mutations in each of 685 neuroblastoma samples (662 diagnosis, 23 relapse) sequenced by WGS or WES, with samples categorized into <18 months of age at diagnosis (group A, n = 206), 18 months to 5 years (group B, n = 325), and 5 or more years (group C, n = 154). Middle, segmental chromosome copy changes which were statistically significant per GISTIC analysis, and structural variants; blue indicates segmental copy loss, red indicates segmental copy gain, white indicates no change. 9+ WC gains samples (gain of nine or more whole chromosomes) are shown in dark red. Bottom, somatic variants in driver genes. Color indicates the type of mutation (key at right). Samples with more than one mutation type for a gene have multiple colors indicated. Significantly mutated genes (SMGs), as identified through MutSigCV and/or GRIN, range from MYCN at the top to ATRX at the bottom, while the remainder are known cancer genes that have pathogenic variants in our cohort but did not pass the SMG test. Barplot to the right shows percentage of samples with each gene somatically altered, and variant type indicated by color; the denominator was 685 samples for all alterations except for t(11;17), TERT, SHANK2, and PTPRD (205 samples with WGS as these variants required WGS to detect) and ATRX (522 samples including WGS samples plus WES samples with ATRX targeted sequencing allowing SV detection). Copy gains include focal MYCN amplifications with log2 fold change of >2.0 (>8 copies); ALK copy gains meeting this criterion or one-copy ALK gains associated with a likely activating SV; or focal TERT gains of one copy or more.
Fig. 2
Fig. 2. FGFR1 kinase alterations and ALK N-terminal structural alterations.
a Positions of point mutations in FGFR1 in six patients, including 5 SNVs at N546K and an ITD in the kinase domain (duplicated region in green). IG indicates the extracellular immunoglobulin-like domain (blue), while the intracellular kinase domain is shown in red. Exon boundaries are indicated by dotted lines. b ALK protein structure with protein domains indicated by color. Dotted lines indicate exon boundaries. The five samples with ALK N-terminal structural alterations are shown, with the lost exons indicated in purple. MAM indicates Meprin A5 and tyrosine phosphatase Mu domain; LDLa indicates low-density lipoprotein receptor domain class A domain; FXa indicates coagulation factor Xa inhibitory site domain.
Fig. 3
Fig. 3. Age-associated genetic alterations.
a Mutual exclusivity and co-occurrence in diagnosis samples with WGS (n = 182). When two alterations co-occurred in a sample, the alterations were excluded from analysis if the two alterations were joined by an SV (non-independent). P values are by two-sided Fisher’s exact test. Asterisk, female with ATRX and MYCN alterations. Gold, significant co-occurrence; purple, mutually exclusivity. Circle size is inversely related to P value. Gains and deletions (del) include segmental chromosome alterations and exclude whole-chromosome alterations. b Boxplot showing coding mutation burden, including 662 diagnosis samples with WGS or WES; a single outlier in group B had 200 mutations (sample numbers: group A, 197; B, 313; and C, 152). Box, interquartile range (25th to 75th percentile); middle bar, median. Whiskers are described in R boxplot documentation (a 1.5 × interquartile range rule is used). Each point represents one sample and P values are by two-sided Wilcoxon rank-sum test. c Percentage of diagnosis samples with indicated gene alterations by age group; n = 662, 182, or 499 for MYCN (WGS or WES samples), TERT (WGS samples), or ATRX (WGS samples or WES samples with ATRX targeted sequencing), respectively. P values are by two-sided Fisher’s exact test comparing prevalence among age groups. d Empirical cumulative distribution function showing diagnosis age (x-axis) of patients with alterations in MYCN (gold), TERT (blue), ATRX (red), or none of these alterations (gray, other). Five patients with both MYCN and TERT alterations and one with both MYCN and ATRX were included in the other group. 662 diagnosis samples with WGS or WES were analyzed. Y-axis represents the percent of patients in each group diagnosed at or before the age indicated on x-axis. P values are by two-sided Wilcoxon rank-sum test. Dotted lines indicate median age in the mutated group. Several ATRX-mutant patients were diagnosed at >15 years; hence the ATRX curve does not reach 100%. If only WGS data were considered, the MYCN median age was 2.5, the TERT and ATRX median ages did not change, and the P value comparisons shown were P < 0.003. Source data are provided as a Source Data file.
Fig. 4
Fig. 4. Signature 18-induced mutational patterns.
a Mutational signatures detected by WGS of 182 diagnosis samples, shown as proportion of mutations caused by the signature across all samples in each age group. Sample numbers are: group A, 39; B, 103; and C, 40. b Signature abundance in absolute SNVs is indicated on y-axis for five patients with matched diagnosis and relapse samples. Shared mutations (present in both diagnosis and relapse, which are thus early mutations) are indicated at left, followed by relapse-specific variants (detected only at relapse) on the right for each patient. c Differential gene expression analysis comparing signature 18-positive (n = 60) vs. signature 18-negative (n = 28) samples in 88 diagnosis samples with both WGS and RNA-Seq using Limma. Y-axis represents -log10 P values; x-axis represents the log expression fold-change (mean expression difference), with genes increased in signature 18-positive samples in the positive direction (red) and genes increased in signature 18-negative samples in the negative direction (blue). Each point represents one gene, and genes with the lowest 1.9% of adjusted P values are shown in color. d Y-axis represents indicated gene’s expression in TPM, comparing signature 18-negative (n = 28) and -positive (n = 60) samples. Box, interquartile range (25th to 75th percentile); middle bar, median. Whiskers are described in R boxplot documentation (a 1.5 × interquartile range rule is used). e Proportion of SNVs caused by signature 18 in 182 diagnosis samples with WGS, comparing samples with vs. without 17q gain; or with vs. without MYCN alterations. Interquartile range, median, and whiskers are as in d. P values are by two-sided Wilcoxon rank-sum test. f t-SNE of 158 diagnosis and relapse samples with RNA-Seq (left two panels) or the subset of these with WGS (n = 96, far right). Overlaid are, from left to right: (1) ssGSEA Z-scores for the neural gene set (Supplementary Table 2) with red indicating more neural expression, (2) the 17q gain status with purple indicating no gain, and (3) proportion of mutations caused by signature 18 in each sample (Z-scores). Dotted outline is to enable comparison of a neural-enriched group between each plot. Source data are provided as a Source Data file.
Fig. 5
Fig. 5. Driver SNVs caused by signature 18.
a Spectrum of signature 18, with 6 SNV types indicated at top and the trinucleotide context indicated at bottom. C>A mutations commonly affecting driver genes are indicated at bottom. b Heatmap showing probability that each somatic driver SNV (rows) was caused by each signature (columns). Each row represents one mutation in a specific patient. Trinucleotide context of each mutation is indicated at right. Genes are color-coded as indicated in legend at bottom-right. Only driver SNVs in diagnosis WGS samples with highly reliable signature data (cosine reconstruction similarity of 0.9 or higher; n = 38 samples and 42 mutations) were analyzed. Source data are provided as a Source Data file.

References

    1. Maris JM, Hogarty MD, Bagatell R, Cohn SL. Neuroblastoma. Lancet. 2007;369:2106–2120. doi: 10.1016/S0140-6736(07)60983-0. - DOI - PubMed
    1. Cohn SL, et al. The International Neuroblastoma Risk Group (INRG) Classification System: an INRG task force report. J. Clin. Oncol. 2009;27:289–297. doi: 10.1200/JCO.2008.16.6785. - DOI - PMC - PubMed
    1. Simon T, Spitz R, Faldum A, Hero B, Berthold F. New definition of low-risk neuroblastoma using stage, age, and 1p and MYCN status. J. Pediatr. Hematol. Oncol. 2004;26:791–796. - PubMed
    1. Smith V, Foster J. High-risk neuroblastoma treatment review. Children. 2018;5:114. doi: 10.3390/children5090114. - DOI - PMC - PubMed
    1. Baker DL, et al. Outcome after reduced chemotherapy for intermediate-risk neuroblastoma. New Engl. J. Med. 2010;363:1313–1323. doi: 10.1056/NEJMoa1001527. - DOI - PMC - PubMed

Publication types

MeSH terms