Comparative Study
. 2020 Oct 14;11(1):5152.
doi: 10.1038/s41467-020-18963-y.

Smell and taste changes are early indicators of the COVID-19 pandemic and political decision effectiveness

Affiliations
Comparative Study

Smell and taste changes are early indicators of the COVID-19 pandemic and political decision effectiveness

Denis Pierron et al. Nat Commun. .

Abstract

In response to the COVID-19 pandemic, many governments have taken drastic measures to avoid an overflow of intensive care units. Accurate metrics of disease spread are critical for the reopening strategies. Here, we show that self-reports of smell/taste changes are more closely associated with hospital overload and are earlier markers of the spread of infection of SARS-CoV-2 than current governmental indicators. We also report a decrease in self-reports of new onset smell/taste changes as early as 5 days after lockdown enforcement. Cross-country comparisons demonstrate that countries that adopted the most stringent lockdown measures had faster declines in new reports of smell/taste changes following lockdown than a country that adopted less stringent lockdown measures. We propose that an increase in the incidence of sudden smell and taste change in the general population may be used as an indicator of COVID-19 spread in the population.


Conflict of interest statement

The authors declare no competing interests.

Figures

Fig. 1
Fig. 1. Changes in smell and taste as indicators of overwhelmed healthcare systems: geographic and time-related approaches.
a French regions were assigned a green or red status by the French government to guide local relaxation of lockdown protocols. Dots represent people self-reporting smell and taste changes in a web-based survey. Base map is from OpenStreetMap and OpenStreetMap Foundation. b The number of COVID-19-related CCRU admissions (as of May 11, 2020) correlated with the number of self-reported chemosensory changes (between March 1 and May 11, 2020, total n = 3832). Green dots correspond to regions with a post-lockdown level labeled green, and red triangles indicate regions considered red. Values are standardized based on the number of inhabitants (inhab.) for each regions. The two red triangles with CCRU admissions >5 are Alsace and Ile de France. The gray band represent the confidence interval of the linear smooth (formula ‘y ~ x’) R and p represent value of the test for association between paired samples, using one of Pearson’s product moment correlation coefficient, without correction for multiple comparisons. c Colored bar represent the value of computed correlation coefficients (confidence intervals are depicted as thin black bars) between the number of CCRU admissions per area and i) the number of people reporting smell and taste changes (n = 3832, blue), and ii) the governmental indicator (Gov. indicator), ratio of ER consults for COVID-19 (orange). Analyses were done both at the level of metropolitan regions (Reg) and departments (Dep). d Temporal relationships in France between smell/taste change symptom onset (blue solid line, n = 1476), the governmental indicator (orange dashed line), and COVID-19 cases in CCRUs (gray bars) around the lockdown period (vertical dashed line). Data are 7-day running averages, normalized to the day with the highest value.
Fig. 2
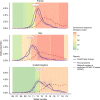
Fig. 2. Evolution of COVID-19 indicators before and after the lockdown in France, Italy and the UK.
The daily proportion of first symptoms is shown as a violet line (France, n = 4720, Italy, n = 1241, UK, n = 750). The daily proportion of smell/taste changes is shown as a blue line (France, n = 1487, Italy, n = 264, UK, n = 263). The daily proportion of COVID-19 confirmed cases from the European Centre for Disease Prevention and Control (ECDC) is shown as a red dashed line. Each panel shows both raw data (thin line) and the corresponding 7-day running average (thick line). The government response stringency index is shown as the background color.

Similar articles

Cited by

References

    1. Gilbert M, Dewatripont M, Muraille E, Platteau J-P, Goldman M. Preparing for a responsible lockdown exit strategy. Nat. Med. 2020;26:643–644. doi: 10.1038/s41591-020-0871-y. - DOI - PMC - PubMed
    1. Menni C, et al. Real-time tracking of self-reported symptoms to predict potential COVID-19. Nat. Med. 2020;26:1037–1040. doi: 10.1038/s41591-020-0916-2. - DOI - PMC - PubMed
    1. Eliezer M, et al. Sudden and complete olfactory loss function as a possible symptom of COVID-19. JAMA Otolaryngol. Neck Surg. 2020;146:674–675. doi: 10.1001/jamaoto.2020.0832. - DOI - PubMed
    1. Gautier J-F, Ravussin Y. A new symptom of COVID-19: loss of taste and smell. Obesity. 2020;28:848–848. doi: 10.1002/oby.22809. - DOI - PMC - PubMed
    1. Pellegrino R, et al. Corona viruses and the chemical senses: past, present, and future. Chem. Senses. 2020;45:415–422. doi: 10.1093/chemse/bjaa031. - DOI - PMC - PubMed

Publication types

MeSH terms