Clinical Trial
. 2020 Oct 14;11(1):5173.
doi: 10.1038/s41467-020-18962-z.

Th17-inducing autologous dendritic cell vaccination promotes antigen-specific cellular and humoral immunity in ovarian cancer patients

Affiliations
Clinical Trial

Th17-inducing autologous dendritic cell vaccination promotes antigen-specific cellular and humoral immunity in ovarian cancer patients

Matthew S Block et al. Nat Commun. .

Abstract

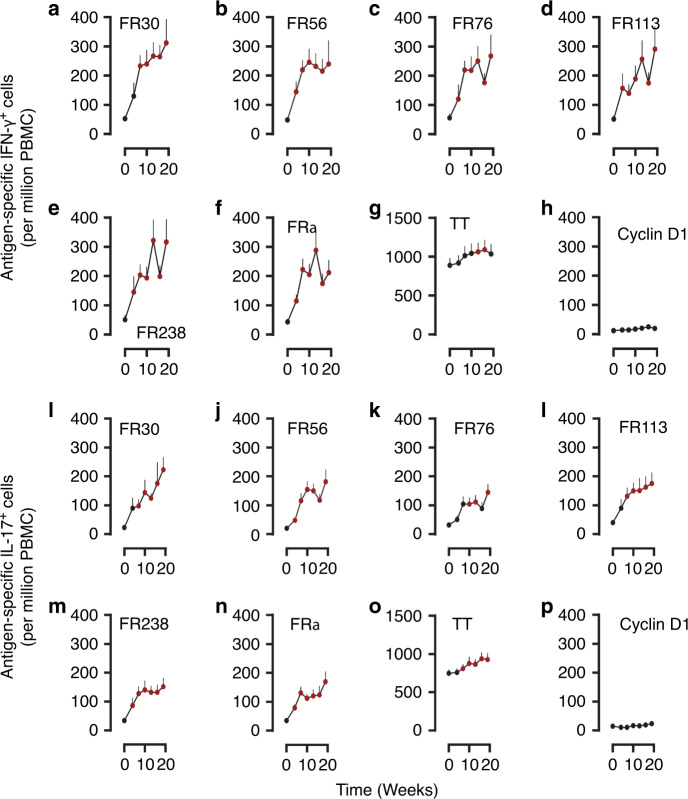
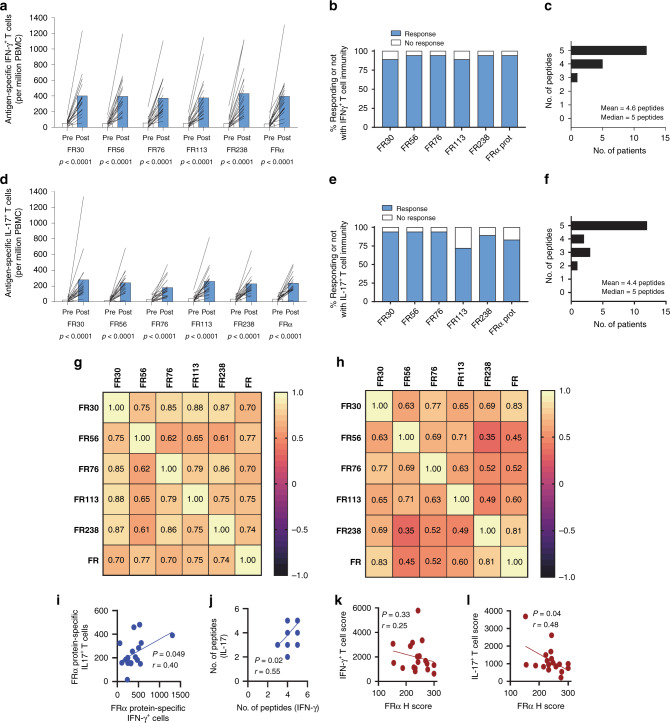
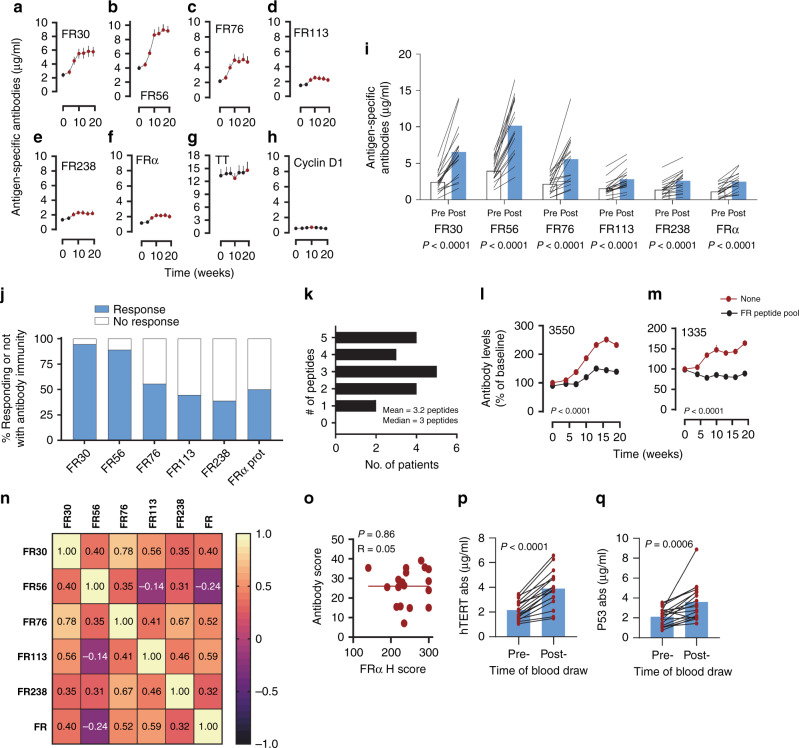
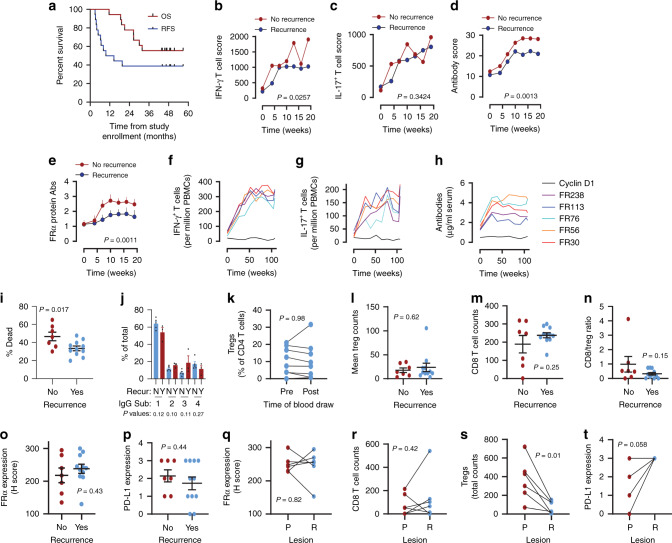
In ovarian cancer (OC), IL-17-producing T cells (Th17s) predict improved survival, whereas regulatory T cells predict poorer survival. We previously developed a vaccine whereby patient-derived dendritic cells (DCs) are programmed to induce Th17 responses to the OC antigen folate receptor alpha (FRα). Here we report the results of a single-arm open-label phase I clinical trial designed to determine vaccine safety and tolerability (primary outcomes) and recurrence-free survival (secondary outcome). Immunogenicity is also evaluated. Recruitment is complete with a total of 19 Stage IIIC-IV OC patients in first remission after conventional therapy. DCs are generated using our Th17-inducing protocol and are pulsed with HLA class II epitopes from FRα. Mature antigen-loaded DCs are injected intradermally. All patients have completed study-related interventions. No grade 3 or higher adverse events are seen. Vaccination results in the development of Th1, Th17, and antibody responses to FRα in the majority of patients. Th1 and antibody responses are associated with prolonged recurrence-free survival. Antibody-dependent cell-mediated cytotoxic activity against FRα is also associated with prolonged RFS. Of 18 patients evaluable for efficacy, 39% (7/18) remain recurrence-free at the time of data censoring, with a median follow-up of 49.2 months. Thus, vaccination with Th17-inducing FRα-loaded DCs is safe, induces antigen-specific immunity, and is associated with prolonged remission.


Conflict of interest statement

K.L.K. is an inventor on a patent filed by the Mayo Clinic, entitled ‘Immunity to Folate Receptors’, which is currently licensed to Marker Therapeutics, Inc. of Houston, TX. M.J.C. is an inventor on a patent filed by the University of Arkansas, entitled ‘Inhibition of dendritic cell-driven regulatory T cell activation and potentiation of tumor antigen-specific T cell responses by interleukin-15 and MAP kinase inhibitor’. The remaining authors have no competing interests.

Figures

Fig. 1
Fig. 1. Immunization with vaccine generates both IFN-γ+ and IL-17+ T cell responses.
ah Induction time courses of antigen-specific IFN-γ+ T cell frequencies (T cells per million PBMCs, mean + s.e.m.) for FRα epitopes FR30, FR56, FR76, FR113, FR238 FRα protein, TT, and control cyclin D1 peptide, respectively, in 18 evaluable patients. ip Induction phase time courses of antigen-specific IL-17+ T cell frequencies (T cells per million PBMCs, mean + s.e.m.) for the same antigens in the same patients. The first time point is prior to apheresis; the second following apheresis and prior to Cycle 1 of vaccine treatment, and the remainder following Cycles 1–5 of vaccine induction. Reddened symbols indicate p < 0.008 (Bonferroni corrected) significance by Wilcoxon matched pairs two-sided test, compared to the baseline value for that antigen. Exact P values are indicated in Supplementary Tables 3 and 4.
Fig. 2
Fig. 2. T cell immunity is generated in the vast majority of patients.
a, d The mean (n = 18) pre-immunization (Pre) and highest post-vaccination (Post) frequency of antigen-specific IFN-γ+ (a) or IL-17+ T (d) cell frequencies (per million PBMCs plated) that recognize the vaccine epitopes as well as the whole FRα protein. Post-vaccination samples included up to week 19. P values were calculated using the 2-sided test Wilcoxon matched pairs at a significance level of P ≤ 0.05. b, e The % of patients that responded to vaccine epitopes with IFN-γ+ or IL-17+ T cell responses, respectively. c, f The distribution of IFN-γ+ and IL-17+ T cell responses to the individual epitopes, respectively. g Correlation analysis heatmap comparing the magnitude of maximal peptide-specific IFN-γ+ T cells to each other and to the maximal FRα protein-specific IFN-γ+ T cell response. Inset values are Spearman’s Rho. h The same for IL-17+T cell responses. All correlations ≥0.45 were P < 0.05 (Benjamini-Hochberg adjusted two-sided test, exact P values are indicated in Supplementary Tables 5 and 6). i Correlation plot between the protein-specific IFN-γ+ T cell response and the IL-17 analyses between the highest FRα protein-specific IFN-γ+ and highest FRα protein-specific IL-17+ T cells. j Correlation analysis between the number of peptides to which IFN-γ+ T cells were generated and the number of peptides to which IL-17+ T cells were generated. k Correlation plots between the vaccine IFN-γ score (The sum of the individual patient T cell response to the epitopes) and tumor FRα expression. Inset values for (ik) are Spearman’s Rho coefficient (r) and P value. l Correlation plots between the vaccine Th17 score (The sum of the individual patient T cell response to the epitopes) and tumor FRα expression. Inset values are Pearson’s Rho coefficient (r) and P value. Each symbol in (il) represents a unique patient (n = 18 for each panel). In some cases the symbols overlap obscuring each other. Inset best-fit lines were calculated with non-linear least squares regression and intended for data trend visualization.
Fig. 3
Fig. 3. DC vaccines induce cognate antibody immunity.
ah Induction phase times courses of antigen-specific antibody levels (μg/ml, mean + s.e.m.) for FRα epitopes FR30, FR56, FR76, FR113, FR238 and FRα protein, TT, and control cyclin D1 peptide, respectively, in 18 evaluable patients. Reddened symbols indicate P < 0.008 (Bonferroni corrected) significance by Wilcoxon matched pairs two-sided test, compared to the baseline value for that antigen. Exact P values are indicated in Supplementary Table 7. i The mean (n = 18) pre-immunization (Pre) and highest post-vaccination (Post) frequency of antigen-specific antibody levels (μg/ml) to the vaccine epitopes as well as the whole FRα protein. Post-vaccination samples included up to week 19. P values were calculated using the two-sided test Wilcoxon matched pairs at a significance level of P ≤ 0.05. j % of patients that responded to vaccine epitopes with antibody responses at the ≥2-fold increase threshold. k The distribution of antibody responses to the individual epitopes. l, m Levels of FRα protein-specific antibodies over the time course of the 19-week vaccine period, expressed a % of baseline, for two patients. Plasma was left either untreated (red line) or pre-absorbed (black line) with pooled vaccine peptides prior to ELISA. Each data symbol represents mean (+s.e.m.) of two replicates. P values were calculated using two-sided two-way analysis of variance. n Correlation heatmap comparing the magnitude of maximal peptide-specific antibody levels to the maximal FRα protein-specific and epitope-specific antibody levels. Inset values are Spearman’s Rho. Correlations >0.56 were P < 0.05 (Benjamini-Hochberg two-sided adjusted P values). Exact P values are indicated in Supplementary Table 8. o Correlation plot between the vaccine antibody score (sum of the individual patients response to each epitope) and tumor FRα expression. Inset values are Pearsons’s Rho coefficient and P value. Each symbol represents a unique patient and the inset line is best-fit lines was calculated with non-linear least squares regression and intended for data trend visualization. p, q Pre- and post-immunization (19-week time point) serum levels of IgG antibodies specific for p53 and hTERT, respectively, in each of the 18 patients. Inset blue bar represents the mean levels of antibodies for all patients at pre- and post-immunization. P values comparing the means were calculated with a two-sided paired Student’s t test.
Fig. 4
Fig. 4. Patients who develop persistent broad immunity against FRα appear to be protected against recurrence.
a The RFS and the OS from the time of study enrollment (4–20 weeks after first-line chemotherapy) for all patients eligible for efficacy analysis (n = 18) via Kaplan–Meier analysis. bd Compare IFN-γ, IL-17, and antibody immune response scores (sum of the mean immune responses to the epitopes), respectively, of those who recurred (blue symbols, n = 11) and those who did not recur (red symbols, n = 78). e Compares the mean (+s.e.m.) antibody levels to whole FRα protein in those that recurred and those that did not recur. P values for (be), comparing the separation of the two curves, are calculated using a two-way ANOVA test. Expanded datasets are shown in Supplementary Fig. 2. fh Maintenance phase time courses of antigen-specific IFN-γ+ and IL-17+ T cell frequencies (T cells per million PBMCs) or the antibody concentrations for FRα epitopes FR30, FR56, FR76, FR113, and FR238, and control cyclin D1 peptide, respectively, in eight evaluable patients. i The individual and mean (±s.e.m.) percentage of dead cells killed through ADCC assayed with post-immunization (Week 19) plasma samples from patients who did not recur (n = 7) and did recur (n = 11). j Bars (mean + s.e.m.) show relative levels of IgG subtypes (IgG1-4) in n = 5 patients with recurrence and n = 3 patients with no recurrence. k The pre- and post-vaccination (i.e., week 19) circulating levels of Tregs in eight evaluable patients. lp The individual and mean (±s.e.m.) tumor Treg counts, tumor CD8 T cell counts, CD8/Treg ratio, tumor FRα, and PD-L1 expression, respectively, in the primary tumors of patients who did (Yes) and did not (No) have recurrence. qt Compare the tumor FRα expression, CD8 T cell infiltration, Treg infiltration, and PD-L1 expression, respectively in primary and corresponding recurrent tumors from n = 5–6 patients with recurrence. P values for (it) were calculated using the two-sided paired Student’s t test. Symbols in some cases overlap obscuring the number of patients.

References

    1. Howlader, N. et al. SEER Cancer Statistics Review, 1975-2016, National Cancer Institute. Bethesda, MD, https://seer.cancer.gov/csr/1975_2016/, based on November 2018 SEER data submission, posted to the SEER web site, April 2019.
    1. Burger RA, et al. Incorporation of bevacizumab in the primary treatment of ovarian cancer. N. Engl. J. Med. 2011;365:2473–2483. doi: 10.1056/NEJMoa1104390. - DOI - PubMed
    1. Zhang L, et al. Intratumoral T cells, recurrence, and survival in epithelial ovarian cancer. N. Engl. J. Med. 2003;348:203–213. doi: 10.1056/NEJMoa020177. - DOI - PubMed
    1. Hamanishi J, et al. Programmed cell death 1 ligand 1 and tumor-infiltrating CD8+ T lymphocytes are prognostic factors of human ovarian cancer. Proc. Natl Acad. Sci. USA. 2007;104:3360–3365. doi: 10.1073/pnas.0611533104. - DOI - PMC - PubMed
    1. Sato E, et al. Intraepithelial CD8+ tumor-infiltrating lymphocytes and a high CD8+/regulatory T cell ratio are associated with favorable prognosis in ovarian cancer. Proc. Natl Acad. Sci. USA. 2005;102:18538–18543. doi: 10.1073/pnas.0509182102. - DOI - PMC - PubMed

Publication types

MeSH terms