. 2020 Oct 14;10(1):17179.
doi: 10.1038/s41598-020-73847-x.

Differentiating Staphylococcus infection-associated glomerulonephritis and primary IgA nephropathy: a mass spectrometry-based exploratory study

Affiliations

Differentiating Staphylococcus infection-associated glomerulonephritis and primary IgA nephropathy: a mass spectrometry-based exploratory study

Anjali A Satoskar et al. Sci Rep. .

Abstract

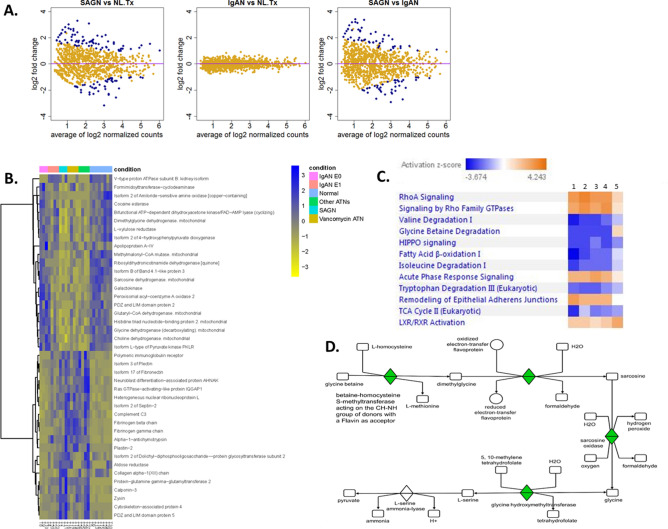
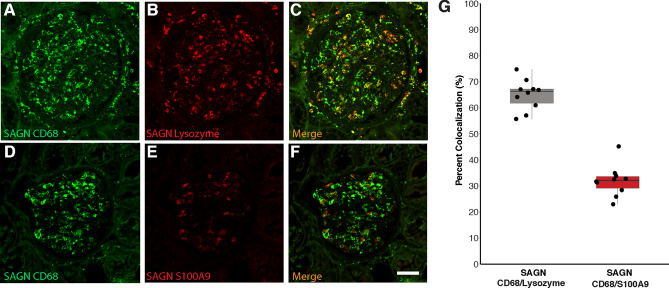
Staphylococcus infection-associated glomerulonephritis (SAGN) and primary IgA nephropathy (IgAN) are separate disease entities requiring different treatment approaches. However, overlapping histologic features may cause a diagnostic dilemma. An exploratory proteomic study to identify potential distinguishing biomarkers was performed on formalin fixed paraffin embedded kidney biopsy tissue, using mass spectrometry (HPLC-MS/MS) (n = 27) and immunohistochemistry (IHC) (n = 64), on four main diagnostic groups-SAGN, primary IgAN, acute tubular necrosis (ATN) and normal kidney (baseline transplant biopsies). Spectral counts modeled as a negative binomial distribution were used for statistical comparisons and in silico pathway analysis. Analysis of variance techniques were used to compare groups and the ROC curve to evaluate classification algorithms. The glomerular proteomes of SAGN and IgAN showed remarkable similarities, except for significantly higher levels of monocyte/macrophage proteins in SAGN-mainly lysozyme and S100A9. This finding was confirmed by IHC. In contrast, the tubulointerstitial proteomes were markedly different in IgAN and SAGN, with a lower abundance of metabolic pathway proteins and a higher abundance of extracellular matrix proteins in SAGN. The stress protein transglutaminase-2 (TGM2) was also significantly higher in SAGN. IHC of differentially-expressed glomerular and tubulointerstitial proteins can be used to help discriminate between SAGN and IgAN in ambiguous cases.


Conflict of interest statement

The authors declare no competing interests.

Figures

Figure 1
Figure 1
The glomerular proteome of SAGN and IgAN. (A) Mean protein expression using dispersion plots—proteins that are differentially expressed are in blue while proteins that are not are in yellow. Fold-change (in log2 scale) is plotted against the mean of normalized protein expression. Each dot represents an individual protein. A fold-change cut-off of ≥ 2 or ≤ -2 in combination with a p value cutoff of ≤ 0.01 was used for detecting differential expression. Only a few proteins are differentially expressed, indicating large overlap in the glomerular proteome of SAGN and primary IgAN. (B) Heat map with unsupervised hierarchical cluster analysis of the top similarly expressed proteins in diseased kidneys compared to normal control kidneys with at least 1.5 fold difference with p ≤ 0.05. Each column represents an individual biopsy sample, and each row represents an individual protein. Blue represents higher expression and yellow lower expression. The degrees of similarity in expression levels are presented in the dendrogram. R version 3.6.0. (C) Differentially-expressed glomerular signaling pathways between SAGN (heat map column 1), primary IgAN-Oxford E1 (heat map column 2), and primary IgAN-Oxford Class E0 (heat map column 3) using Ingenuity pathway analysis (IPA) and z scores (Qiagen Bioinformatics). Orange indicates pathways predicted to be activated, while blue indicates pathways predicted to be inhibited.
Figure 2
Figure 2
The tubulointerstitial proteome of SAGN and IgAN. (A) Mean protein expression using dispersion plots—proteins that are differentially expressed are in blue while proteins that are not are in yellow. Fold-change (in log2 scale) is plotted against the mean of normalized protein expression. Each dot represents an individual protein. A fold-change cut-off of ≥ 2 or ≤ -2 in combination with a p value cutoff of ≤ 0.01 was used for detecting differential expression. Many proteins were differentially expressed. (B) Heat map with unsupervised hierarchical clustering analysis of the top differentially expressed tubulointerstitial proteins between SAGN and IgAN (3 or greater fold difference, p < / = 0.01). Each column represents an individual biopsy sample, and each row represents an individual protein. Blue represents higher expression and yellow represents lower expression. The degrees of similarity in expression levels are presented in the dendrogram. R version 3.6.0. (C) Differentially-expressed tubulointerstitial signaling pathways between SAGN (heat map column 1), vancomycin-induced ATN (heat map column 2), ATN of other causes (heat map column 3), primary IgAN-Oxford Class E1 (heat map column 4), and primary IgAN-Oxford Class E0 (heat map column 5). Orange indicates pathways predicted to be activated while blue indicates pathways predicted to be inhibited. (D) Glycine betaine degradation pathway in SAGN as seen by IPA (Qiagen Bioinformatics). Sarcosine dehydrogenase is downregulated (shown in green and labeled as sarcosine oxidase). This correlates with the significantly low spectral counts for sarcosine dehydrogenase in SAGN biopsies by mass spectrometry.
Figure 3
Figure 3
(AC) Glomerular IHC staining for lysozyme in biopsy of IgAN E0; IgAN E1; and SAGN respectively. (DF) Box and whisker plots showing average number of positively stained cells for lysozyme; CD68; and S100A9 respectively for each group—baseline transplant biopsies, ATN, IgAN E0, IgAN E1, and SAGN. Each dot indicates mean count for each biopsy. SAGN showed significantly higher counts compared to both subgroups of IgAN (p values shown) and also compared to normal kidney and ATN with all three antibodies (details not shown). (GI) Receiver–operator characteristic curves for SAGN versus IgAN E1 for lysozyme; CD68; and S100A9, respectively.
Figure 4
Figure 4
Glomerular macrophage expression of lysozyme and S100A9. Co-localization with CD68. Using kidney biopsy tissue from a case of SAGN, staining for macrophages was done using a FITC-conjugated antibody to CD68. Consecutive tissues sections were stained with rhodamine-conjugated antibodies to lysozyme and S100A9. The images were merged to determine the proportion of co-localization in macrophages. (AC) CD68 and lysozyme co-localization. (DF) CD68 and S100A9 co-localization (G). Graphical representation shows showed 65% co-localization of CD68 and lysozyme; and 31% co-localization of CD68 and S100A9. R Core Team. 2018. "A Language and Environment for Statistical Computing", R Foundation for Statistical Computing, Vienna Austria, https://www.R-project.org.
Figure 5
Figure 5
(AD) Immunohistochemical staining for glutamine gamma-glutamyltransferase (TGM2), and (EH). Xylulose reductase (DCXR) staining. Tissue from normal kidney (A,E), IgAN-E0 (B,F), SAGN (C,G), and vancomycin-induced ATN (D,H) was stained. Strong tubulointerstitial expression of TGM2 is seen in SAGN and ATN compared to normal and IgAN biopsies. Conversely, there is decreased expression of DCXR in SAGN and ATN compared to normal and IgAN biopsies. (I,J) Quantification of IHC staining for TGM2 and DCXR in each biopsy was performed using image analysis software, by calculating ratio of brown pixel area to total pixel area within the biopsy sample (Aperio ImageScope ver. 12.3.0.5056 (Leica Biosystems Inc., Buffalo Grove, IL, USA). These ratios were expressed as percentage. Distribution of the average percentages are shown by group for TGM2 (I) and DCXR (J).

References

    1. Satoskar AA, Nadasdy T, Silva FG. Acute post-infectious glomerulonephritis and Glomerulonephritis caused by persistent bacterial infection. Chapter 10. In: Jennette JC, Olson JL, D’Agati VD, Silva F, editors. Heptinstall’s Pathology of the Kidney. 7. Philadelphia: LWW; 2014. pp. 367–436.
    1. Nasr SH, et al. IgA-dominant acute poststaphylococcal glomerulonephritis complicating diabetic nephropathy. Hum. Pathol. 2003;34:1235–1241. doi: 10.1016/s0046-8177(03)00424-6. - DOI - PubMed
    1. Satoskar AA, et al. Staphylococcus infection-associated glomerulonephritis mimicking IgA nephropathy. Clin. J. Am. Soc. Nephrol. 2006;1:1179–1186. doi: 10.2215/CJN.01030306. - DOI - PubMed
    1. Haas M, Racusen LC, Bagnasco SM. IgA-dominant postinfectious glomerulonephritis: A report of 13 cases with common ultrastructural features. Hum. Pathol. 2008;39:1309–1316. doi: 10.1016/j.humpath.2008.02.015. - DOI - PubMed
    1. Worawichawong S, et al. Immunoglobulin A-dominant postinfectious glomerulonephritis: Frequent occurrence in nondiabetic patients with Staphylococcus aureus infection. Hum. Pathol. 2011;42:279–284. doi: 10.1016/j.humpath.2010.07.009. - DOI - PubMed

Publication types

MeSH terms