

Review
doi: 10.1038/s10038-020-00851-4.
Epub 2020 Oct 14.
A review of UMAP in population genetics
Affiliations
- PMID: 33057159
- PMCID: PMC7728596
- DOI: 10.1038/s10038-020-00851-4
Item in Clipboard
Review
A review of UMAP in population genetics
J Hum Genet.
2021 Jan.
Abstract
Uniform manifold approximation and projection (UMAP) has been rapidly adopted by the population genetics community to study population structure. It has become common in visualizing the ancestral composition of human genetic datasets, as well as searching for unique clusters of data, and for identifying geographic patterns. Here we give an overview of applications of UMAP in population genetics, provide recommendations for best practices, and offer insights on optimal uses for the technique.
Conflict of interest statement
The authors declare that they have no conflict of interest.
Figures
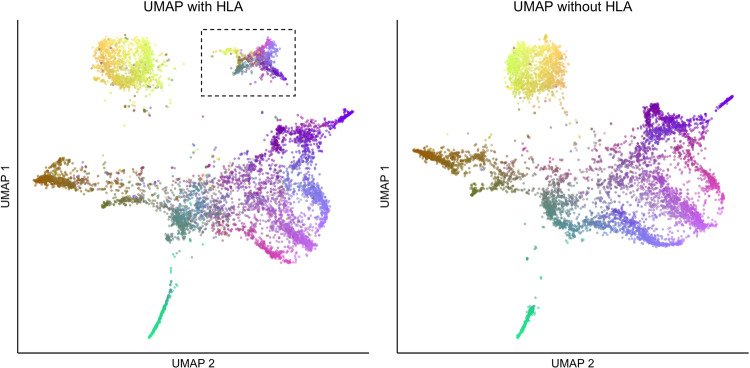
UMAP with (left) and without (right) HLA regions used on the Genizon database. The cluster in the dotted lines disappears when filtering for HLA and linkage disequilibrium
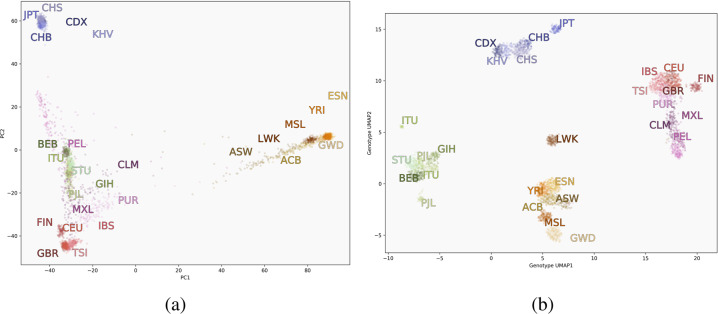
Visualizations of data from the 1000GP. The first two principal components (left) versus a two-dimensional UMAP embedding (right). ACB African Caribbean in Barbados, ASW Americans of African Ancestry in Southwest US, BEB Bengali from Bangladesh, CDX Chinese Dai in Xishuangbanna, China, CEU Utah residents with Northern/Western European ancestry, CHB Han Chinese in Beijing, CHS Southern Han Chinese, CLM Colombian in Medellin, Colombia, ESN Esan in Nigeria, FIN Finnish in Finland, GBR British in England and Scotland, GWD Gambian in Western Divisions in the Gambia, GIH Gujarati Indian in Houston, Texas, IBS Iberian in Spain, ITU Indian Telugu in the UK, JPT Japanese in Tokyo, KHV Kinh in Vietnam, LWK Luhya in Kenya, MSL Mende in Sierra Leone, MXL Mexican in Los Angeles, California, PEL Peruvian in Lima, PJL Punjabi in Lahore, Pakistan, PUR Puerto Rican, STU Sri Lankan Tamil in the UK, TSI Tuscani in Italy, YRI, Yoruba in Nigeria
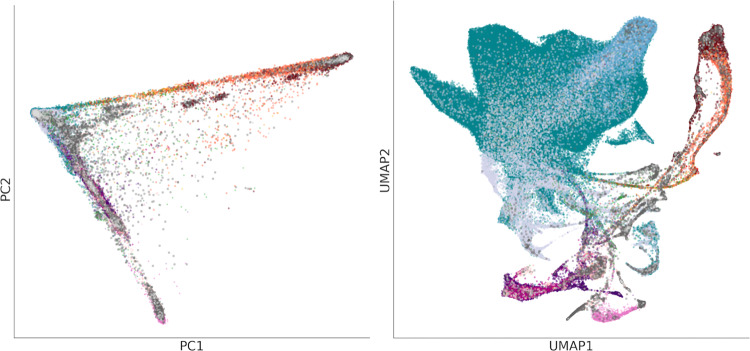
PCA (left) and UMAP (right) projections of the UKB data, coloured by self-identified ethnic background. Unlike PCA, UMAP focuses on preserving local relationships and emphasizes fine-scale patterns in data. Groups in the UMAP projection are less compressed showing, for example, the relative size of the British and Irish populations in the UKB, alongside populations of other ancestries, while simultaneously showing the population structure between and within groups

The Genome Aggregation Database (gnomAD, left) and Biobank Japan (BBJ, right) visualized using UMAP. UMAP illustrates the ancestral diversity of gnomAD, showing many the relationships between populations on continental and subcontinental levels. For the relatively more homogeneous BBJ data, it splits data geographically into the large mainland cluster (consisting of Hokkaido, Tohoku, Kanto-Koshinetsu, Chubu-Hokuriku, Kinki, and Kyushu regions), and smaller non-mainland clusters. The gnomAD image is reproduced from [10], and the BBJ image is reproduced from [12]
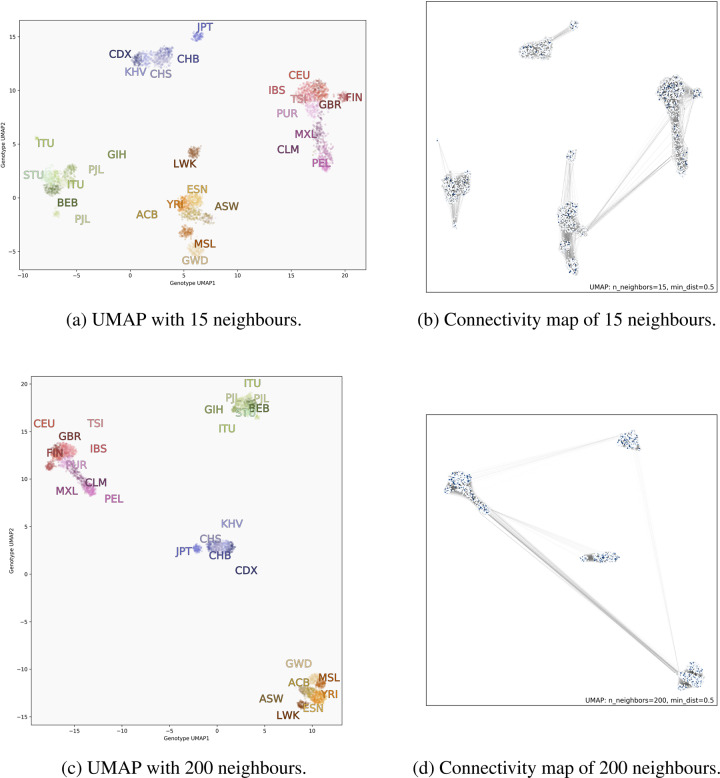
UMAP projection of the same genotype data from the 1000GP comparing parametrization with a small (top) and large (bottom) number of nearest neighbours. Left images are coloured by population; right images are the same points but with the simplicial complex drawn. When adding more neighbours, subclusters become less separated, as with the LWK population, for example. Looking at the connectivity maps, we see new connections between continental groups, such as the Central/South American clusters and East Asian clusters. Darker lines indicate that individuals are closer to each other in genotype space
References
-
- Maaten Lvd, Hinton G. Visualizing data using t-sne. J Mach Learn Res. 2008;9:2579–2605.
-
- McInnes L, Healy J, Melville J. UMAP: uniform manifold approximation and projection for dimension reduction. arXiv 2018. http://arxiv.org/abs/1802.03426.
Publication types
MeSH terms
Substances
Grants and funding
LinkOut - more resources
Full Text Sources