

Near-real-time monitoring of global CO2 emissions reveals the effects of the COVID-19 pandemic
- PMID: 33057164
- PMCID: PMC7560733
- DOI: 10.1038/s41467-020-18922-7
Near-real-time monitoring of global CO2 emissions reveals the effects of the COVID-19 pandemic
Erratum in
-
Author Correction: Near-real-time monitoring of global CO2 emissions reveals the effects of the COVID-19 pandemic.Nat Commun. 2020 Dec 2;11(1):6292. doi: 10.1038/s41467-020-20254-5. Nat Commun. 2020. PMID: 33268773 Free PMC article.
Abstract
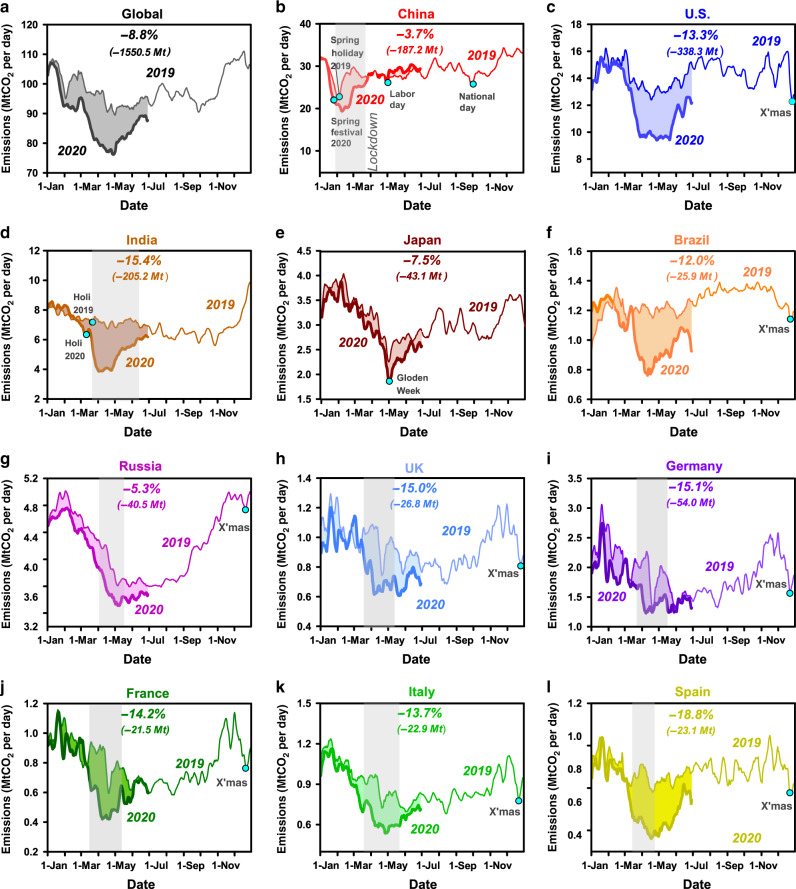
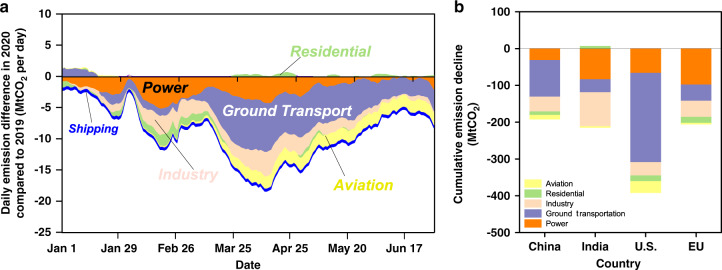
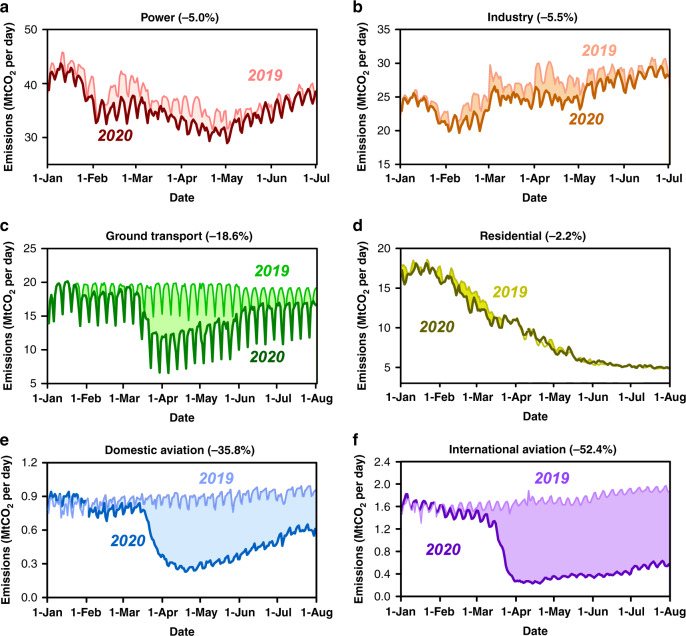
The COVID-19 pandemic is impacting human activities, and in turn energy use and carbon dioxide (CO2) emissions. Here we present daily estimates of country-level CO2 emissions for different sectors based on near-real-time activity data. The key result is an abrupt 8.8% decrease in global CO2 emissions (-1551 Mt CO2) in the first half of 2020 compared to the same period in 2019. The magnitude of this decrease is larger than during previous economic downturns or World War II. The timing of emissions decreases corresponds to lockdown measures in each country. By July 1st, the pandemic's effects on global emissions diminished as lockdown restrictions relaxed and some economic activities restarted, especially in China and several European countries, but substantial differences persist between countries, with continuing emission declines in the U.S. where coronavirus cases are still increasing substantially.
Conflict of interest statement
Authors declare no competing interests.
Figures

Comment in
-
COVID curbed carbon emissions in 2020 - but not by much.Nature. 2021 Jan;589(7842):343. doi: 10.1038/d41586-021-00090-3. Nature. 2021. PMID: 33452515 No abstract available.
References
-
- Oxford Economics. World economic prospects monthly. Economic Outlook. 2020;44:1–33. doi: 10.1111/1468-0319.12509. - DOI
-
- Andrew RM. A comparison of estimates of global carbon dioxide emissions from fossil carbon sources. Earth Syst. Sci. Data. 2020;12:1437–1465. doi: 10.5194/essd-12-1437-2020. - DOI
-
- Guan D, Liu Z, Geng Y, Lindner S, Hubacek K. The gigatonne gap in China’s carbon dioxide inventories. Nat. Clim. Change. 2012;2:672–675. doi: 10.1038/nclimate1560. - DOI
-
- Janssens-Maenhout G, et al. EDGAR v4.3.2 Global Atlas of the three major Greenhouse Gas Emissions for the period 1970–2012. Earth Syst. Sci. Data. 2019;11:959–1002. doi: 10.5194/essd-11-959-2019. - DOI
