. 2020 Oct 14;10(1):17223.
doi: 10.1038/s41598-020-74245-z.

Serum metabolomics approach to monitor the changes in metabolite profiles following renal transplantation

Affiliations

Serum metabolomics approach to monitor the changes in metabolite profiles following renal transplantation

Ivana Stanimirova et al. Sci Rep. .

Abstract

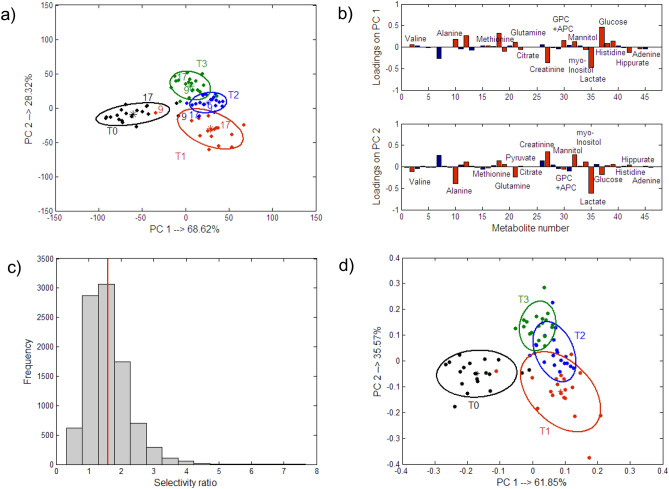
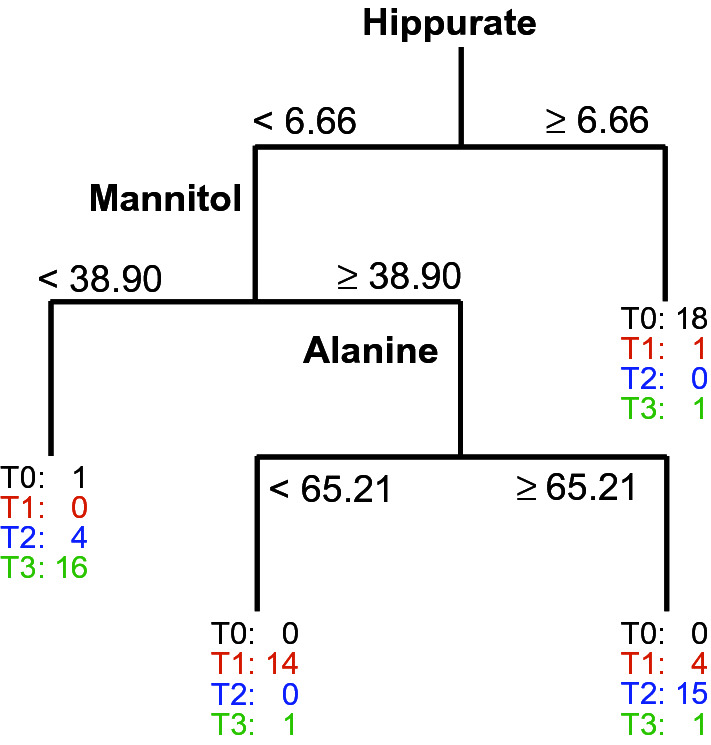
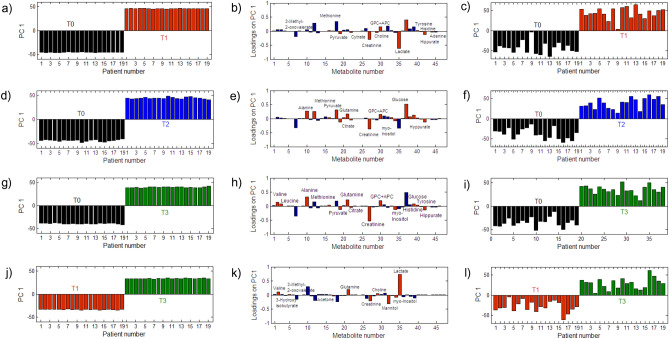
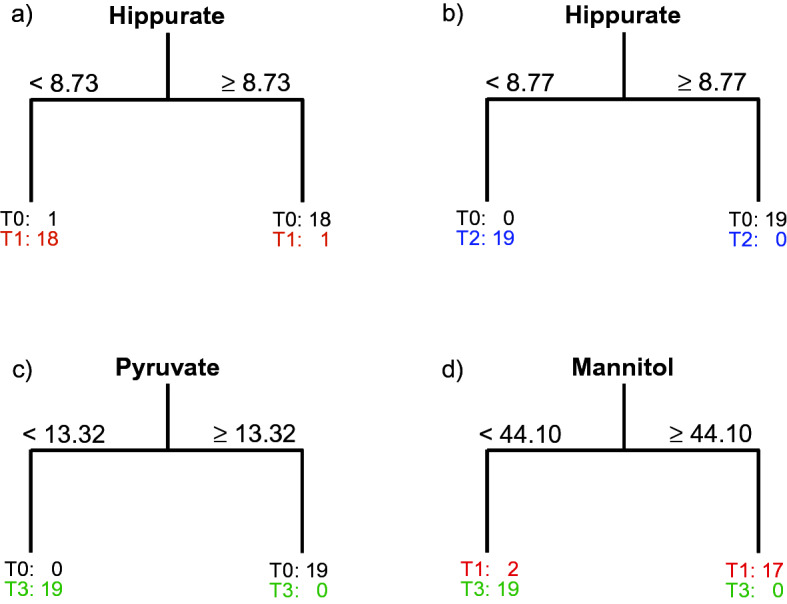
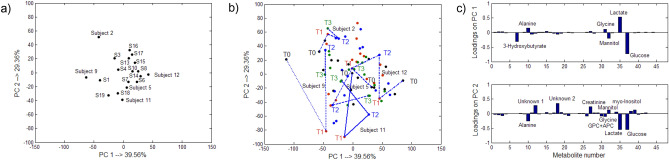
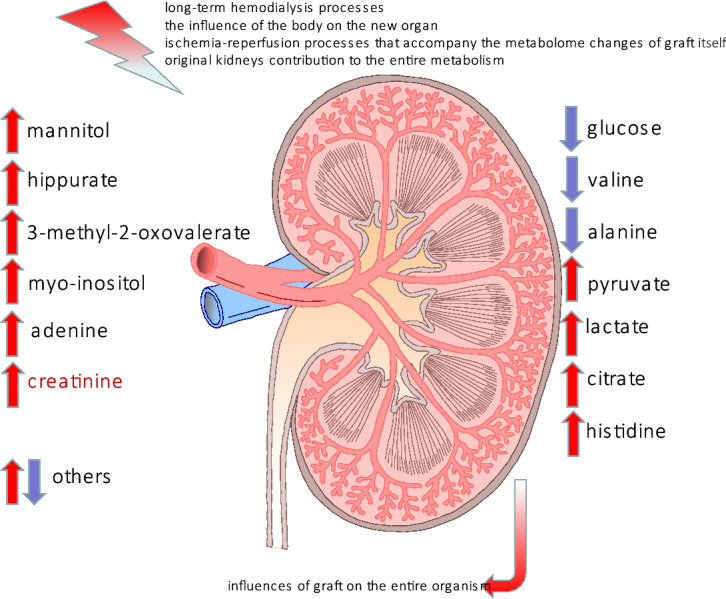
Systemic metabolic changes after renal transplantation reflect the key processes that are related to graft accommodation. In order to describe and better understand these changes, the 1HNMR based metabolomics approach was used. The changes of 47 metabolites in the serum samples of 19 individuals were interpreted over time with respect to their levels prior to transplantation. Considering the specific repeated measures design of the experiments, data analysis was mainly focused on the multiple analyses of variance (ANOVA) methods such as ANOVA simultaneous component analysis and ANOVA-target projection. We also propose here the combined use of ANOVA and classification and regression trees (ANOVA-CART) under the assumption that a small set of metabolites the binary splits on which may better describe the graft accommodation processes over time. This assumption is very important for developing a medical protocol for evaluating a patient's health state. The results showed that besides creatinine, which is routinely used to monitor renal activity, the changes in levels of hippurate, mannitol and alanine may be associated with the changes in renal function during the post-transplantation recovery period. Specifically, the level of hippurate (or histidine) is more sensitive to any short-term changes in renal activity than creatinine.


Conflict of interest statement

The authors declare no competing interests.

Figures

Figure 1
Figure 1
Projection of the samples in the space spanned by the first two latent components that were obtained from (a) ANOVA-TP using all of the metabolites along with the 90% confidence ellipses, which were placed at the centroids of the groups that were defined according to the ‘time’ factor, (b) The respective projections of metabolites on the first two PCs that were obtained from the ANOVA-TP. The most important metabolites are indicated by red bars. All of the metabolites with the mean selectivity ratio values, which were estimated by the bootstrapping procedure and were larger than 1.0 are finally considered being important. (c) Histogram constructed for the selectivity ratio values for the pyruvate metabolite that were obtained from 10,000 bootstrapped samples. The vertical red line illustrates the mean value of the selectivity ratio (mean SR = 1.6), which is also listed in Table 1. and (d) Projection of the samples in the space spanned by the first two latent components that were obtained from ANOVA-TP using selected metabolites.
Figure 2
Figure 2
Classification tree that was constructed for 76 blood samples collected from 19 individuals with a target variable that described all four time points. The tree was grown using the ‘time’ factor matrix that was obtained from ANOVA summed with the residual matrix (ANOVA-CART).
Figure 3
Figure 3
Target projection scores (a,d,g,j) and loadings (b,e,h,k) vector that were associated with the ‘time’ effect from the ANOVA-TP with all of the metabolites as well as the target projection scores (c,f,i, l) from the ANOVA-TP with selected metabolites (Table 1) for T0 vs. T1 (ac), T0 vs. T2 (df), T0 vs. T3 (gi) and T1 vs. T3 (jl).
Figure 4
Figure 4
Classification trees that were obtained from the ANOVA-CART for the blood samples that had been collected from 19 individuals with the target variable describing (a) the ‘before’ and ‘after’ transplantation samples (T0 vs. T1), (b) T0 vs. T2, (c) T0 vs T3 and the period after transplantation (d) T1 vs. T3.
Figure 5
Figure 5
Results obtained from ASCA for the inter-individual changes: (a) the centroids of the individuals over time that were projected in the space that was spanned by PC1 and PC2, (b) the trajectories for some selected individuals in the space spanned by PC1 and PC2 and (c) projections of the metabolites on the PC 1 and PC2.
Figure 6
Figure 6
Schematic representation of the external and internal stimuli that influenced the changes in the serum metabolites at T0. The up-regulated metabolites are represented by red arrows while the down-regulated metabolites are indicated by blue arrows.

References

    1. Mullins LJ, Conway BR, Menzies RI, Denby L, Mullins JJ. Renal disease pathophysiology and treatment: Contributions from the rat. Dis. Model Mech. 2016;9(12):1419–1433. doi: 10.1242/dmm.027276. - DOI - PMC - PubMed
    1. Hill NR, et al. Global prevalence of chronic kidney disease—A systematic review and meta-analysis. PLoS ONE. 2016;11(7):e0158765. doi: 10.1371/journal.pone.0158765. - DOI - PMC - PubMed
    1. Jha V, et al. Chronic kidney disease: Global dimension and perspectives. Lancet. 2013;382(9888):260–272. doi: 10.1016/S0140-6736(13)60687-X. - DOI - PubMed
    1. Inker LA, et al. KDOQI US commentary on the 2012 KDIGO clinical practice guideline for the evaluation and management of CKD. Am. J. Kidney Dis. 2014;63(5):713–735. doi: 10.1053/j.ajkd.2014.01.416. - DOI - PubMed
    1. Webster AC, Nagler EV, Morton RL, Masson P. Chronic kidney disease. Lancet. 2017;389(10075):1238–1252. doi: 10.1016/S0140-6736(16)32064-5. - DOI - PubMed

Publication types