. 2020 Dec;588(7836):112-117.
doi: 10.1038/s41586-020-2821-8. Epub 2020 Oct 14.

The cellular basis of distinct thirst modalities

Affiliations

The cellular basis of distinct thirst modalities

Allan-Hermann Pool et al. Nature. 2020 Dec.

Abstract

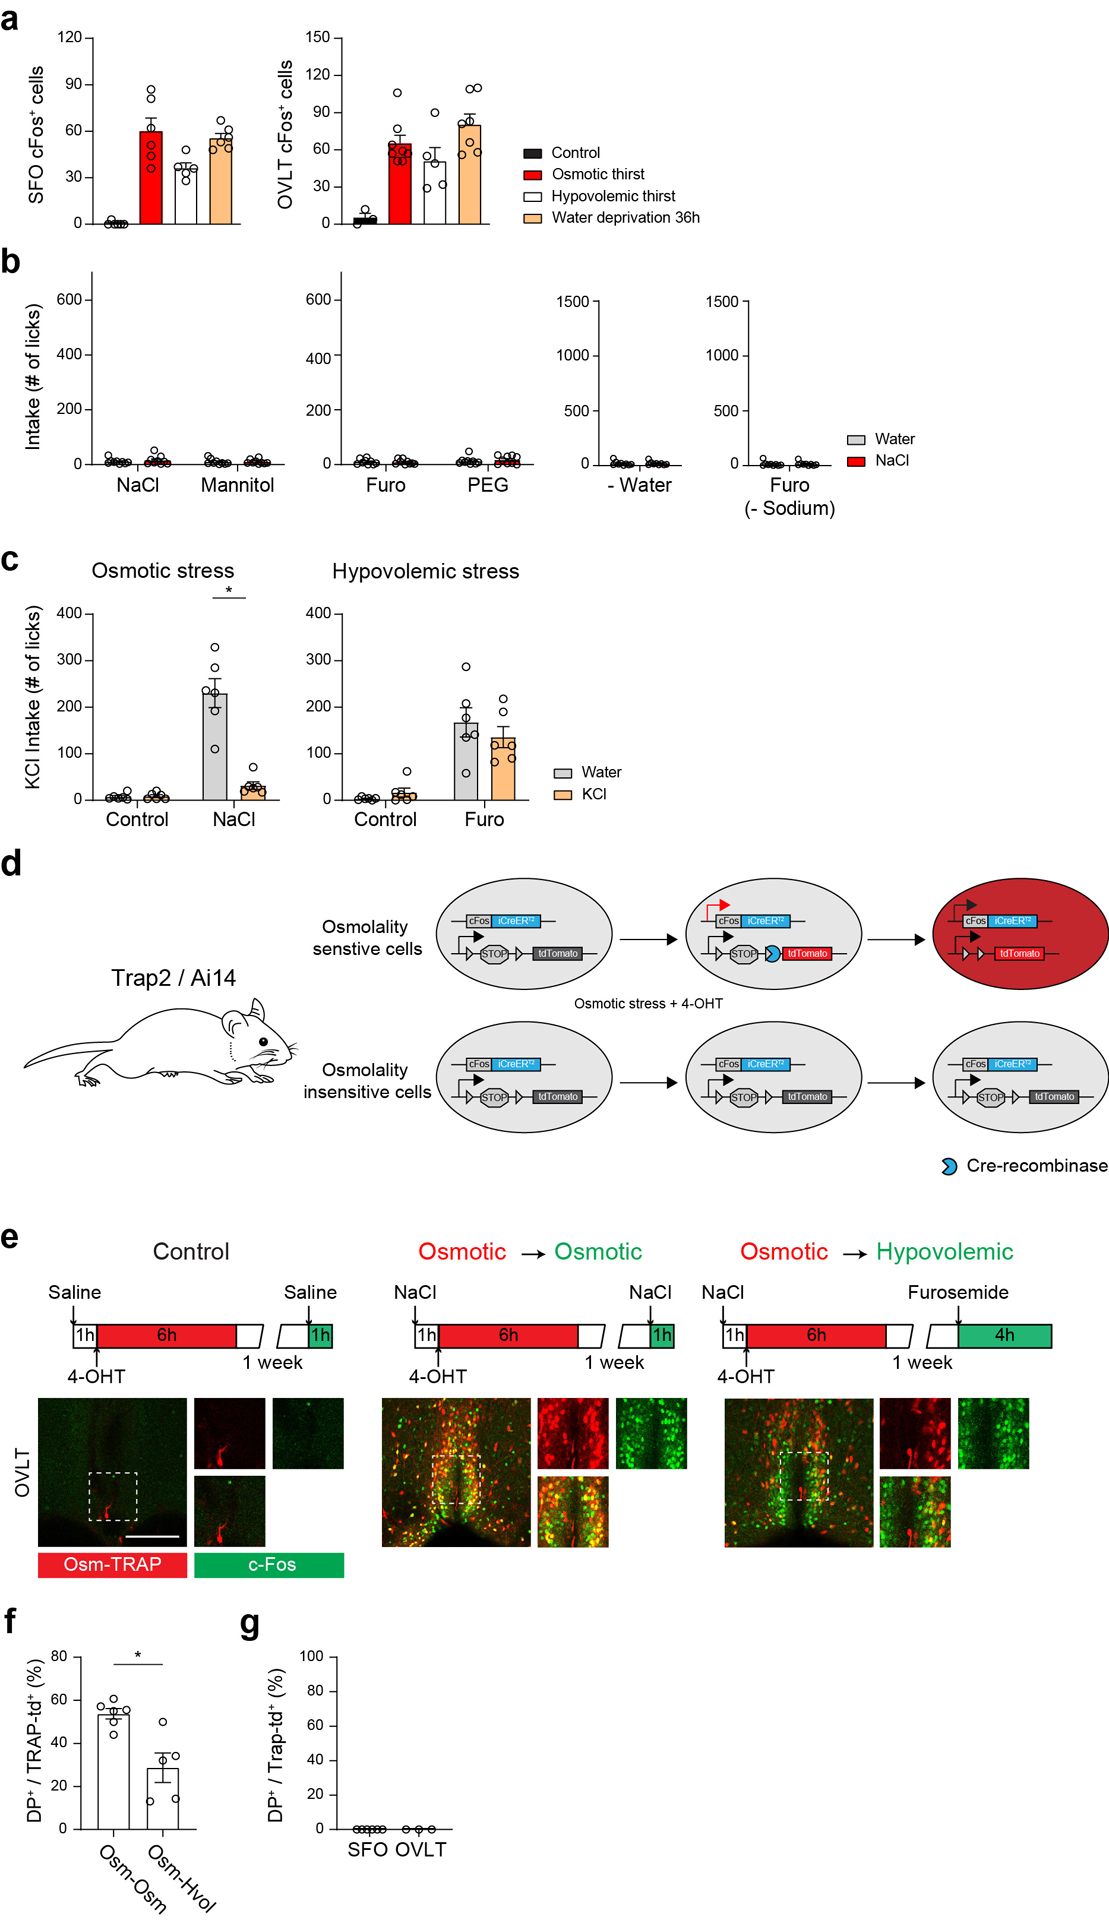
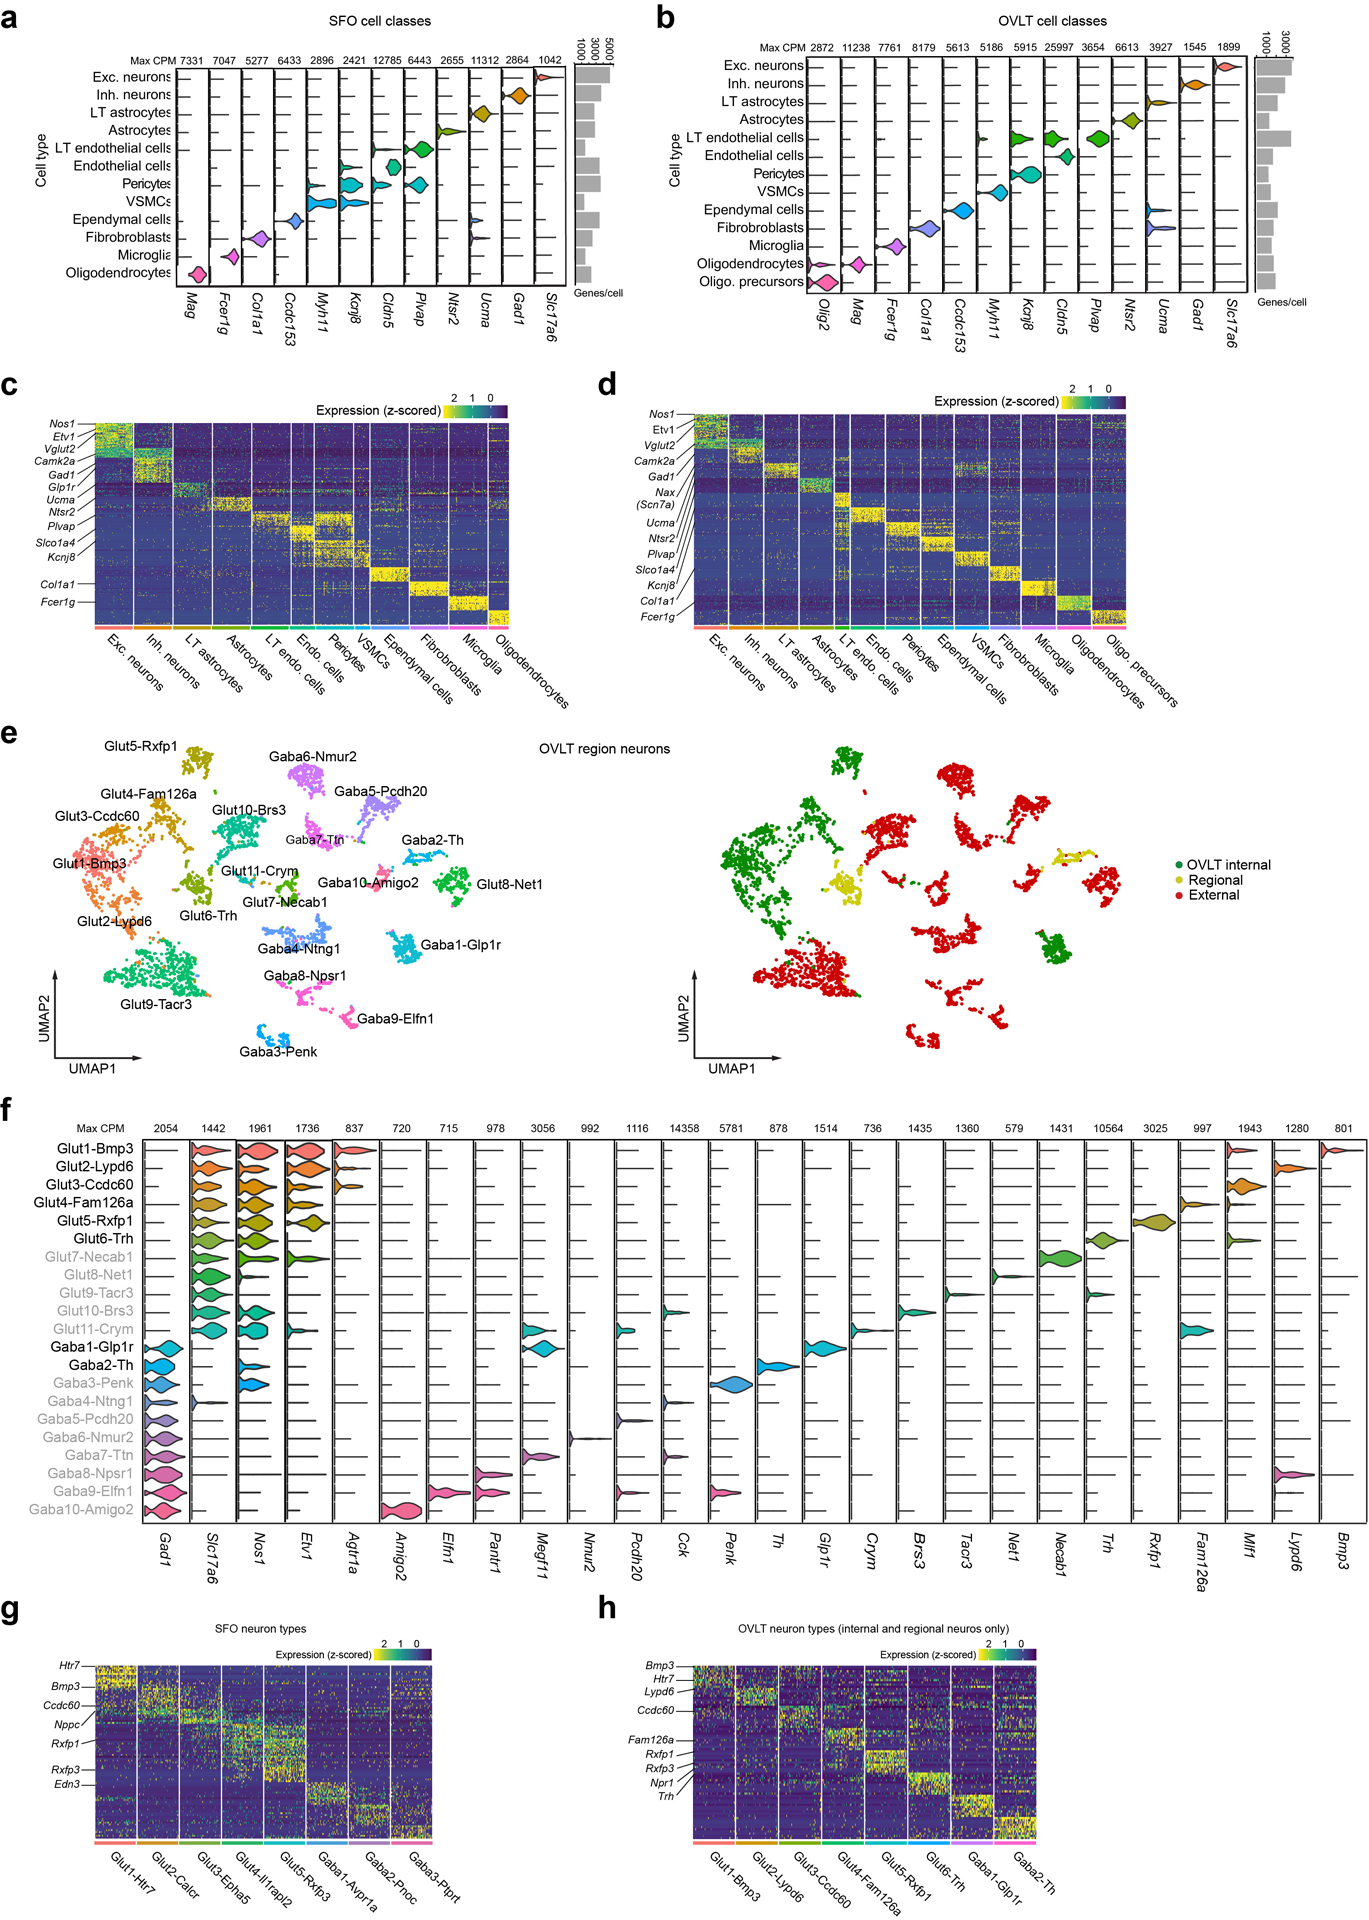
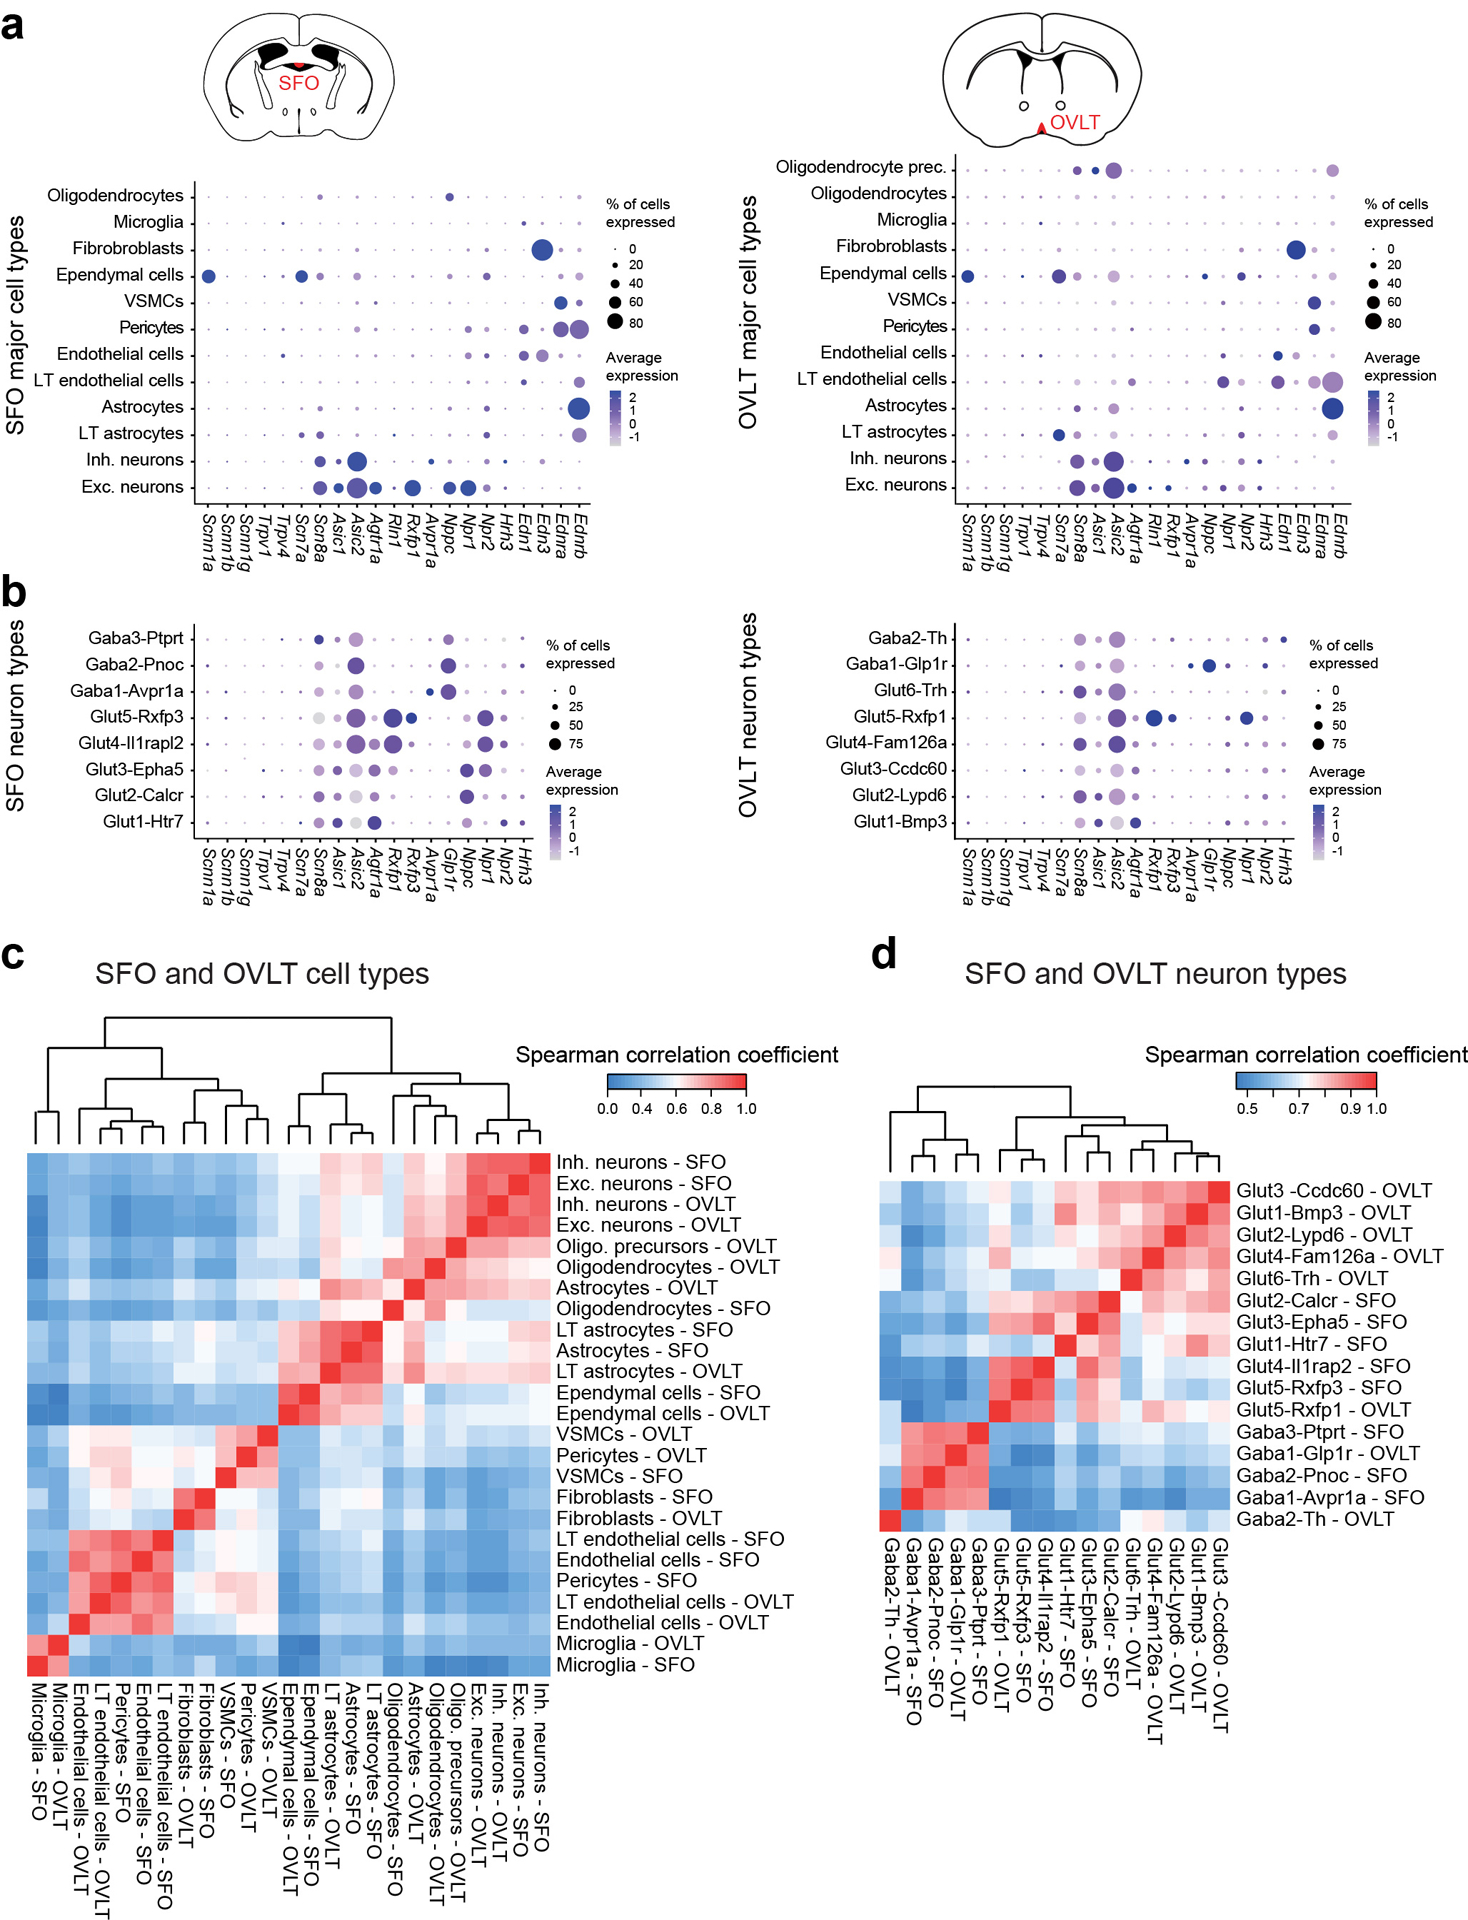
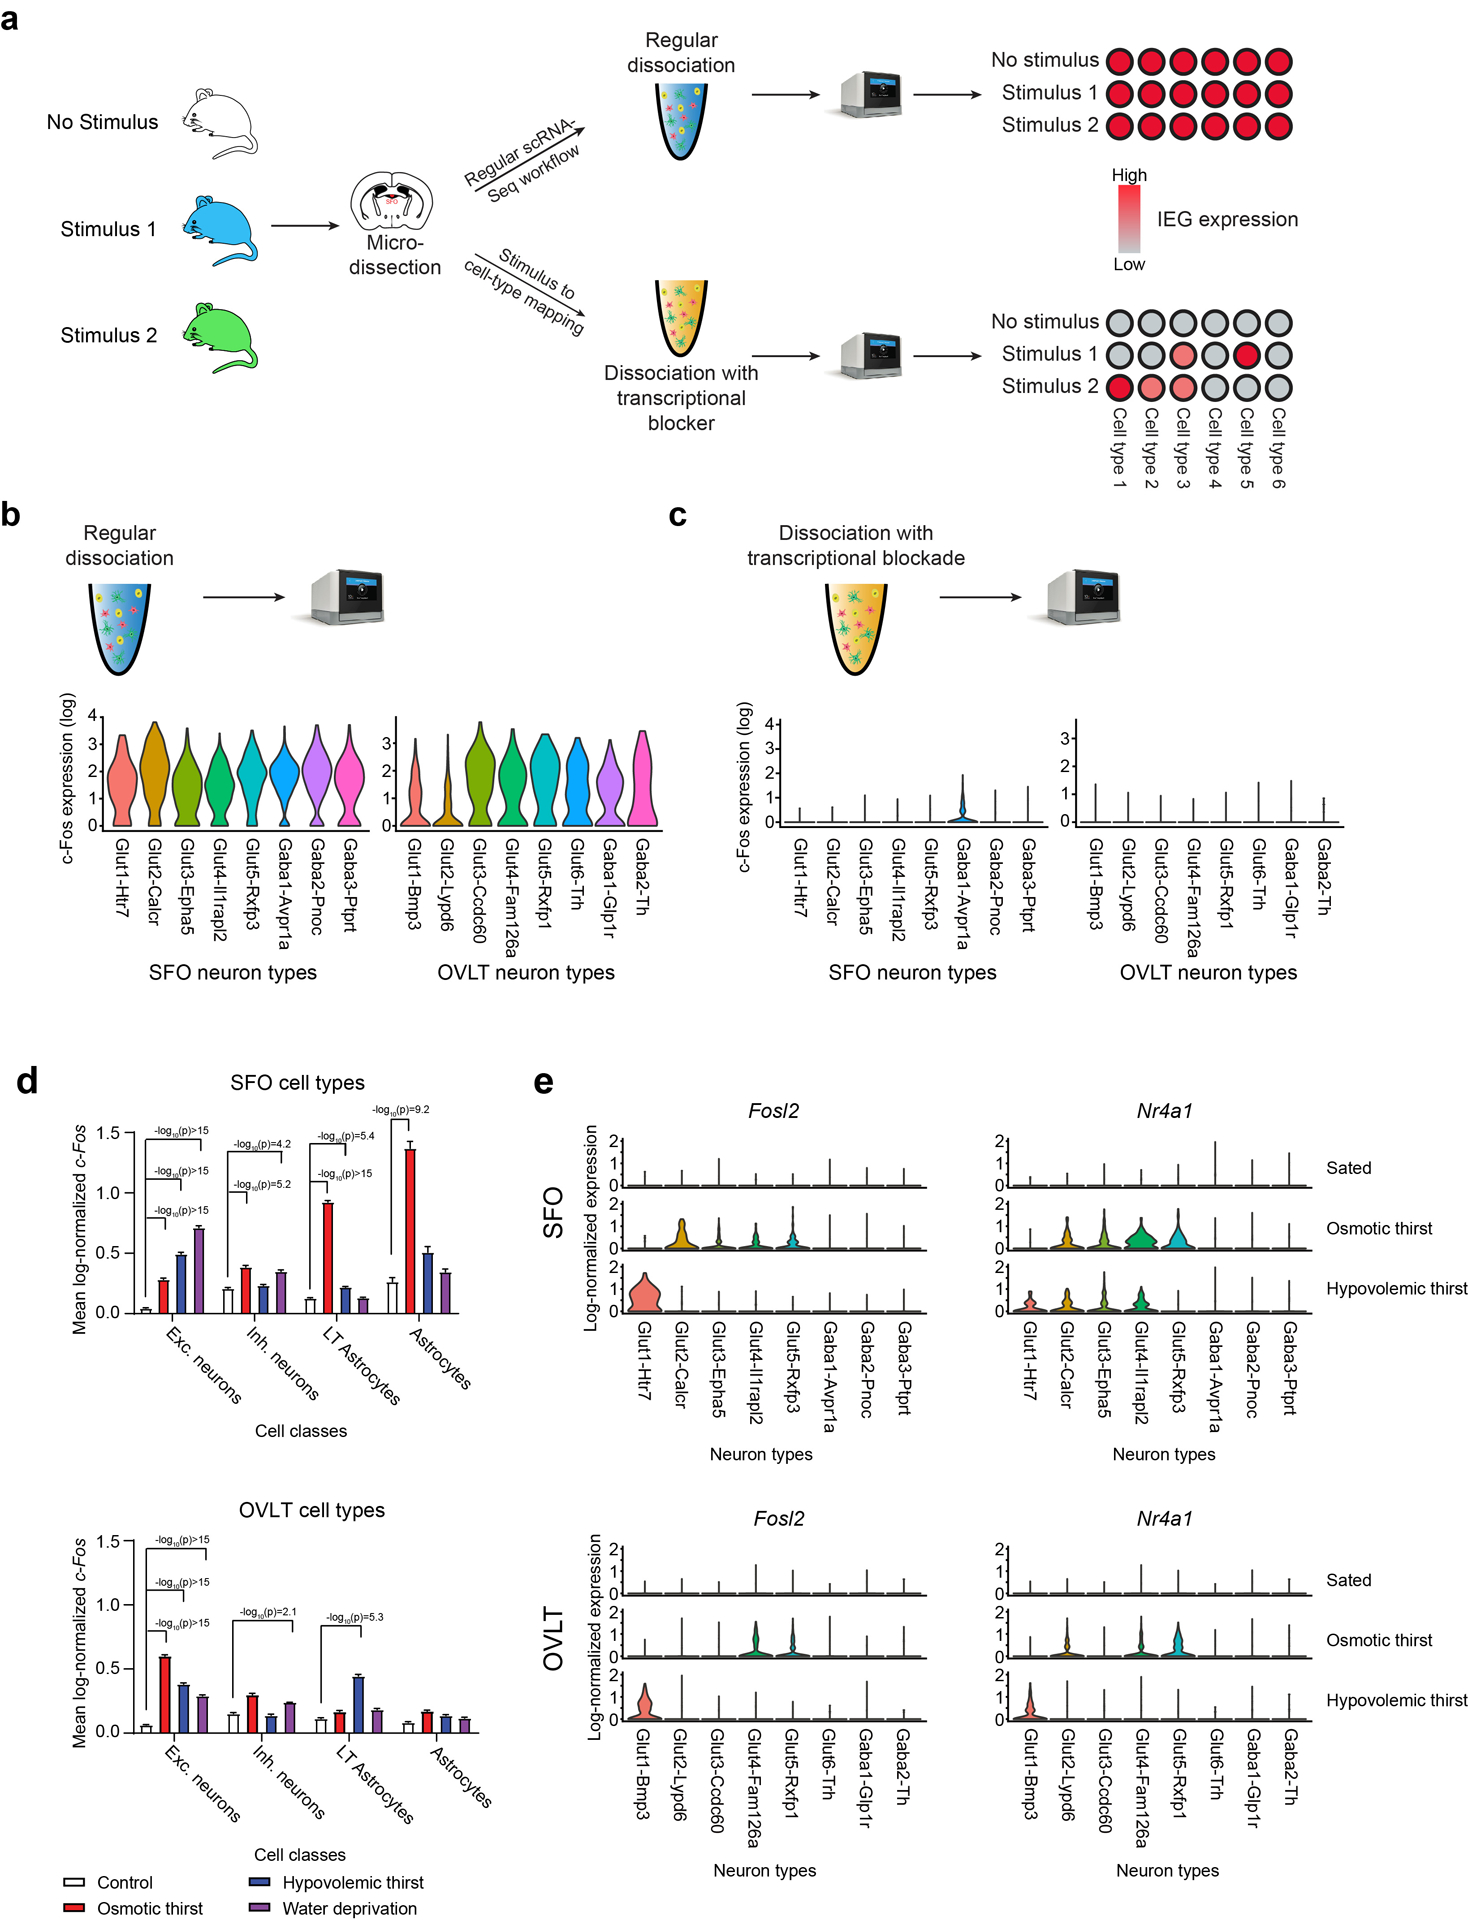
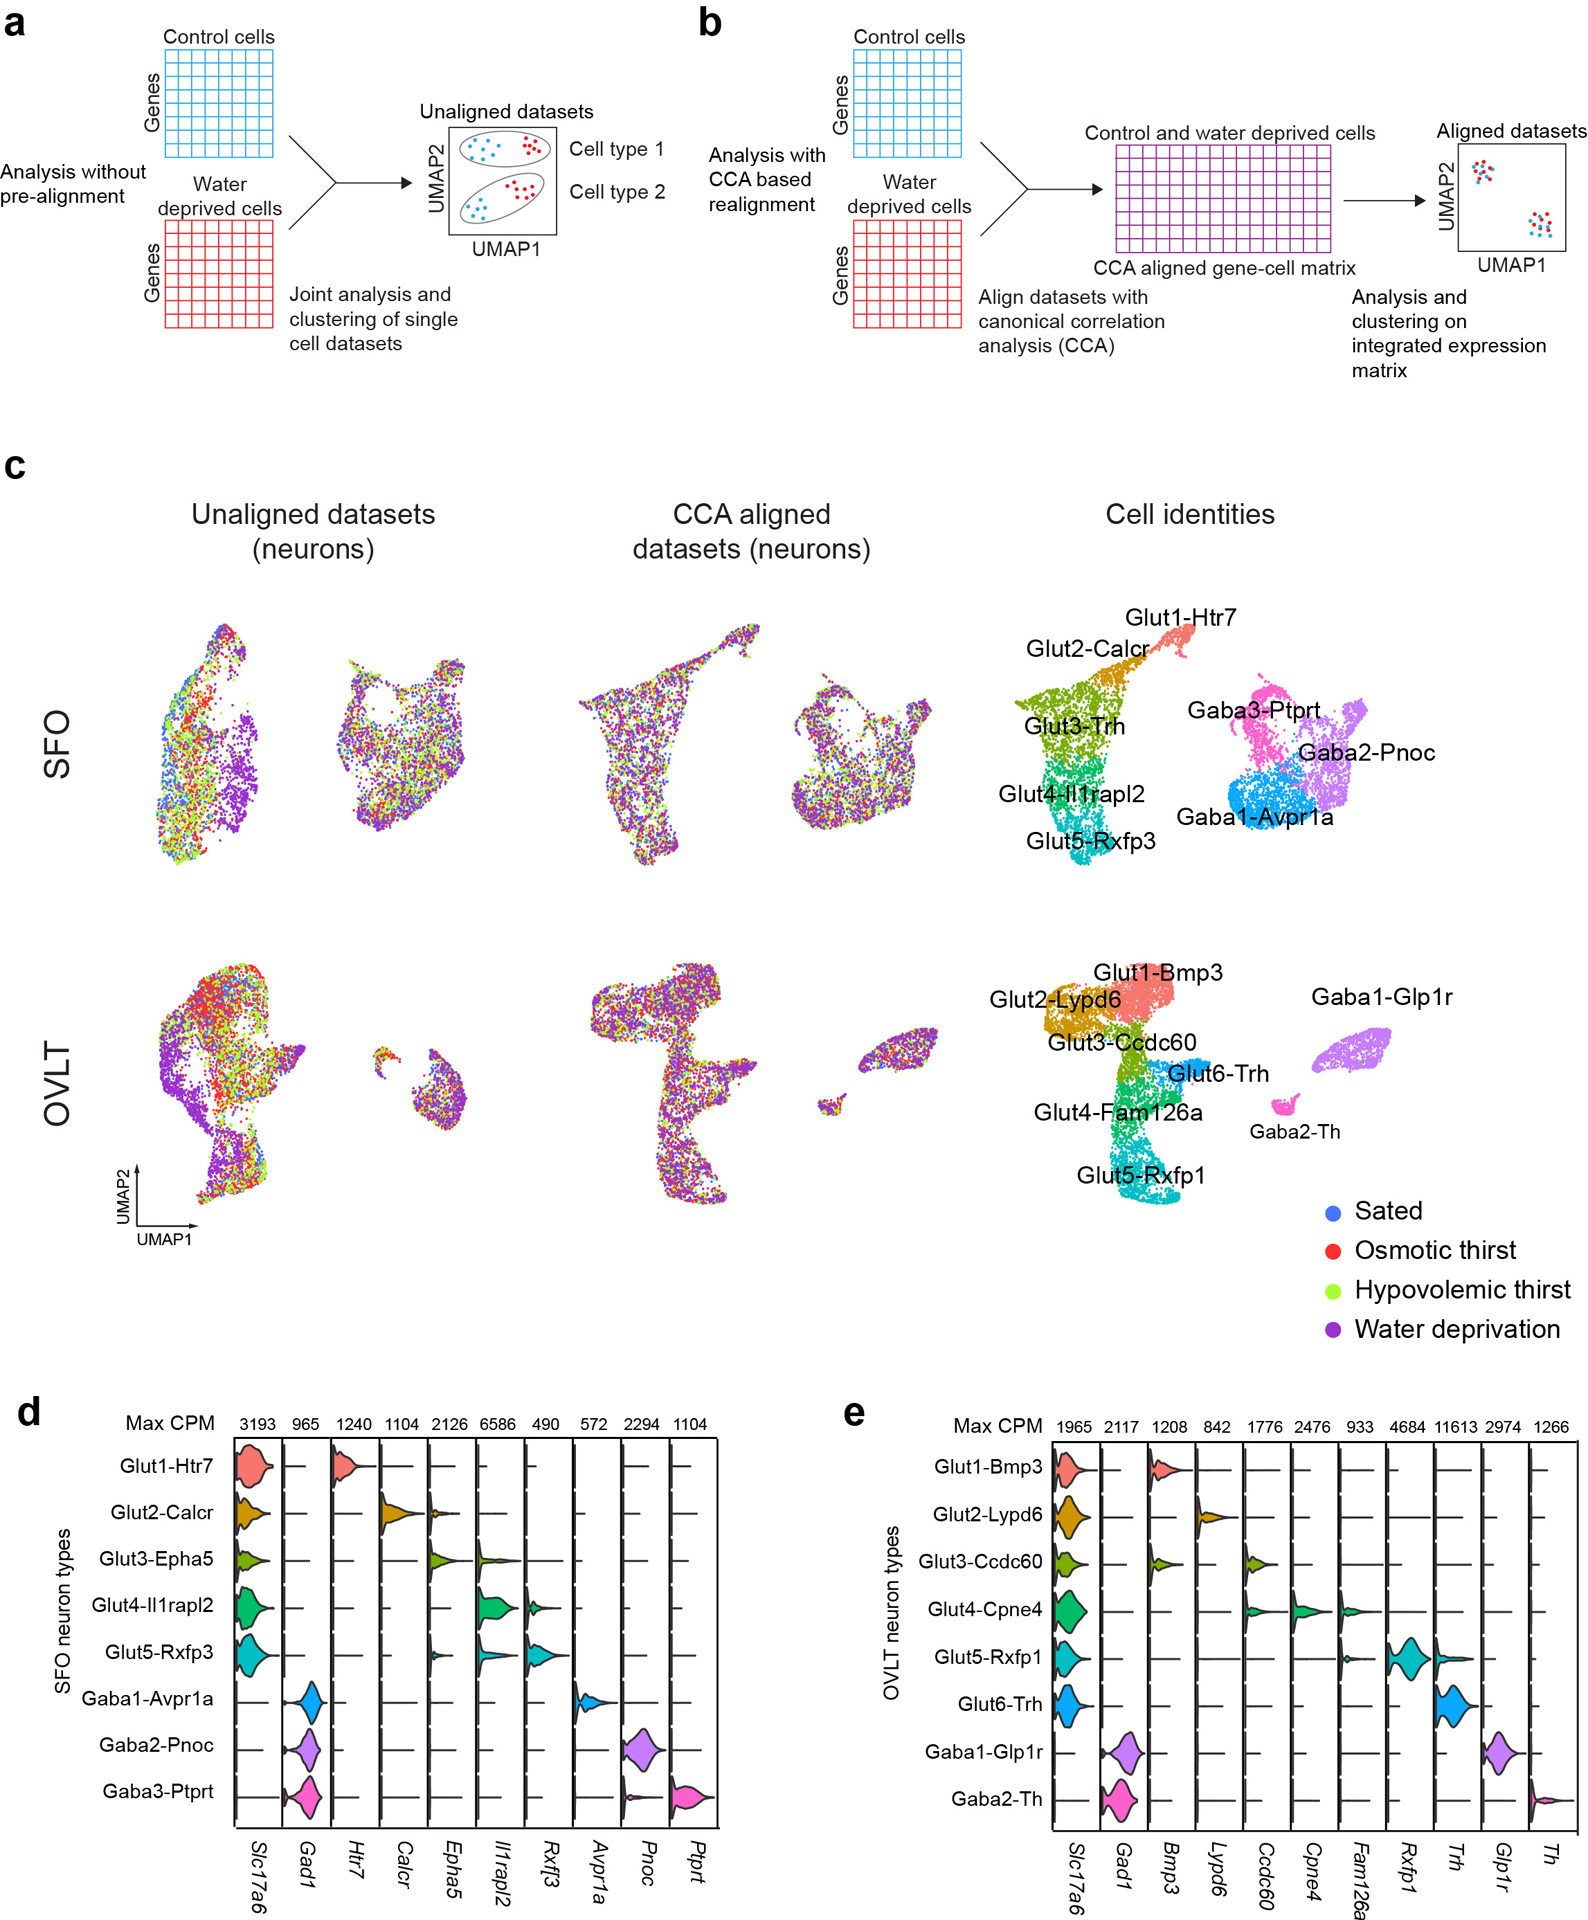
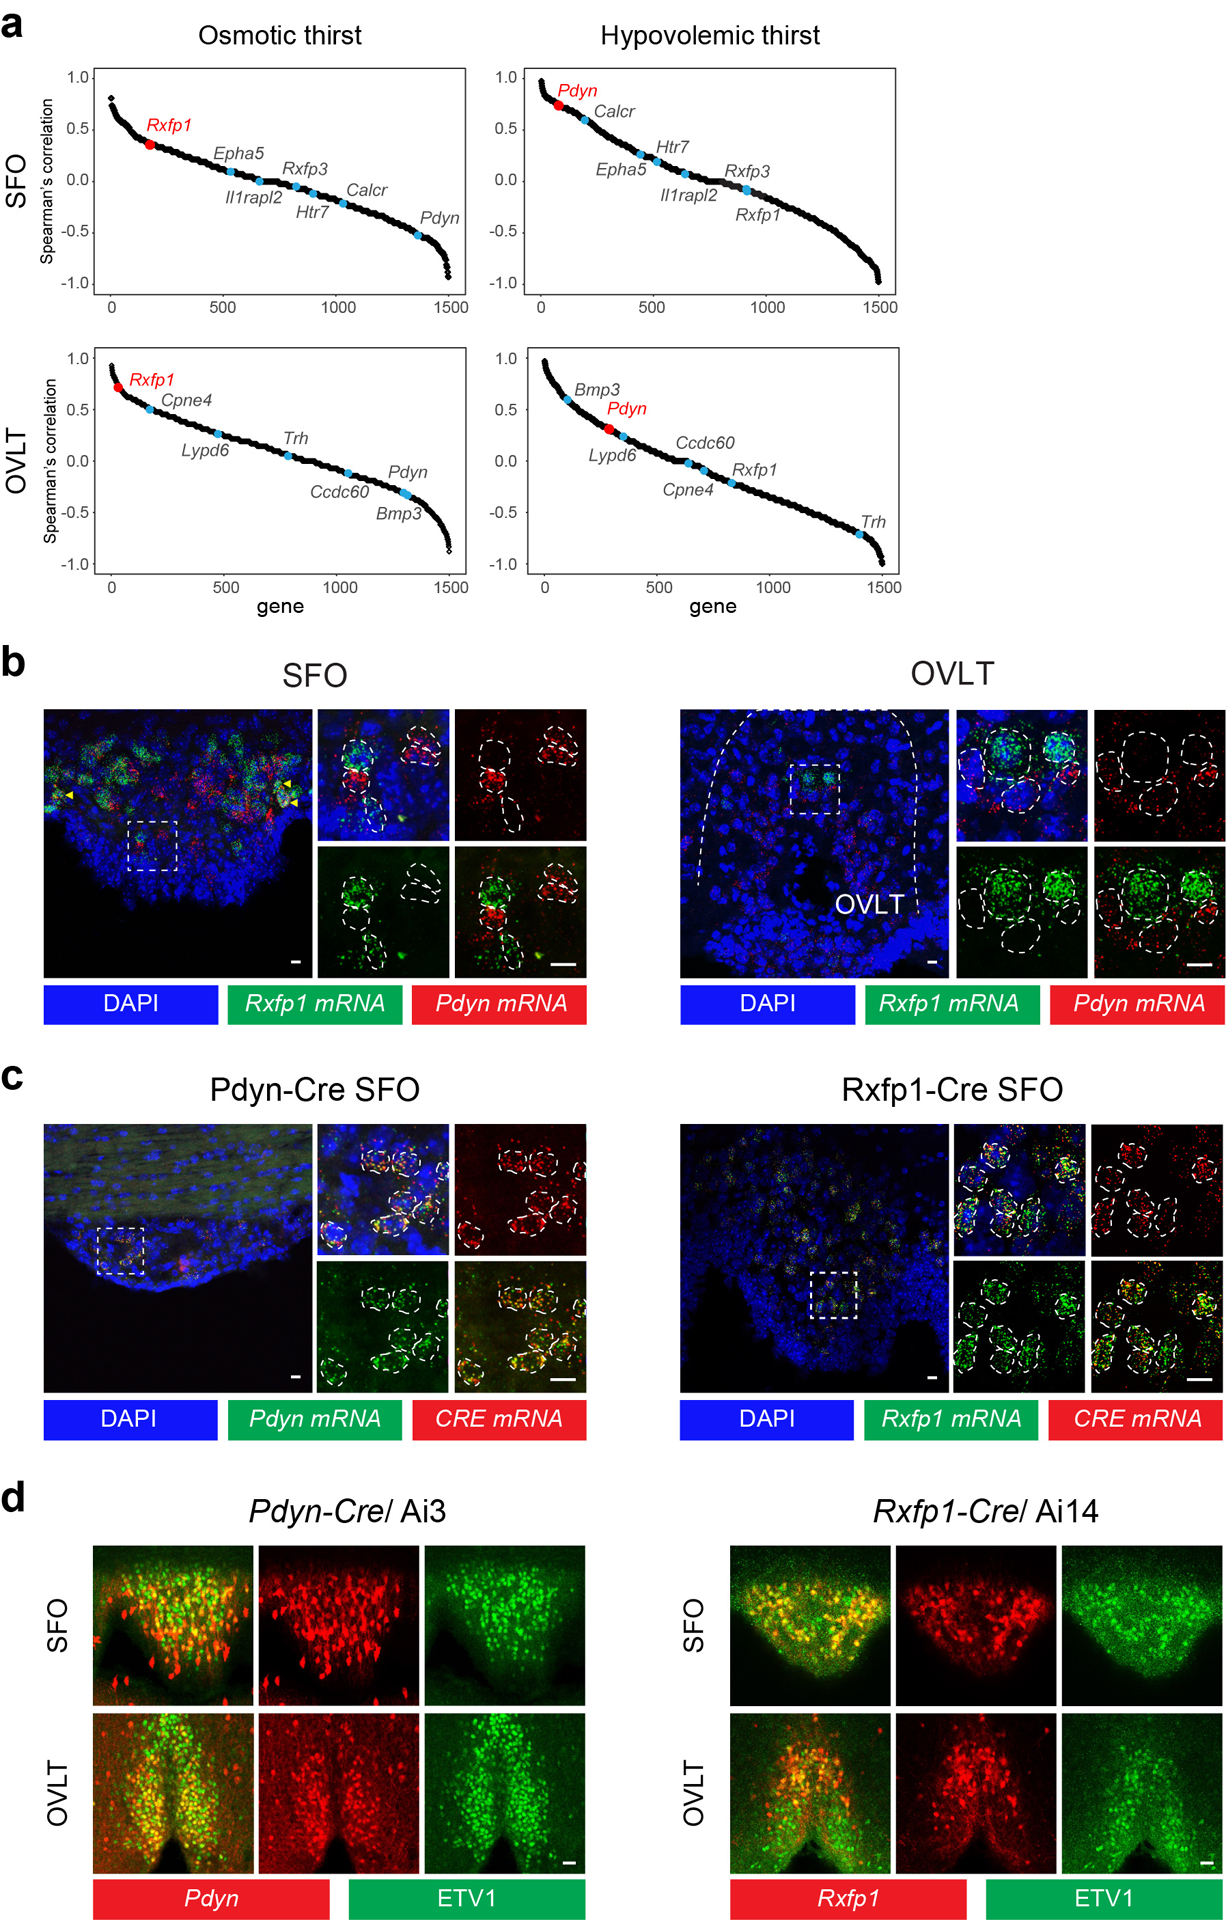
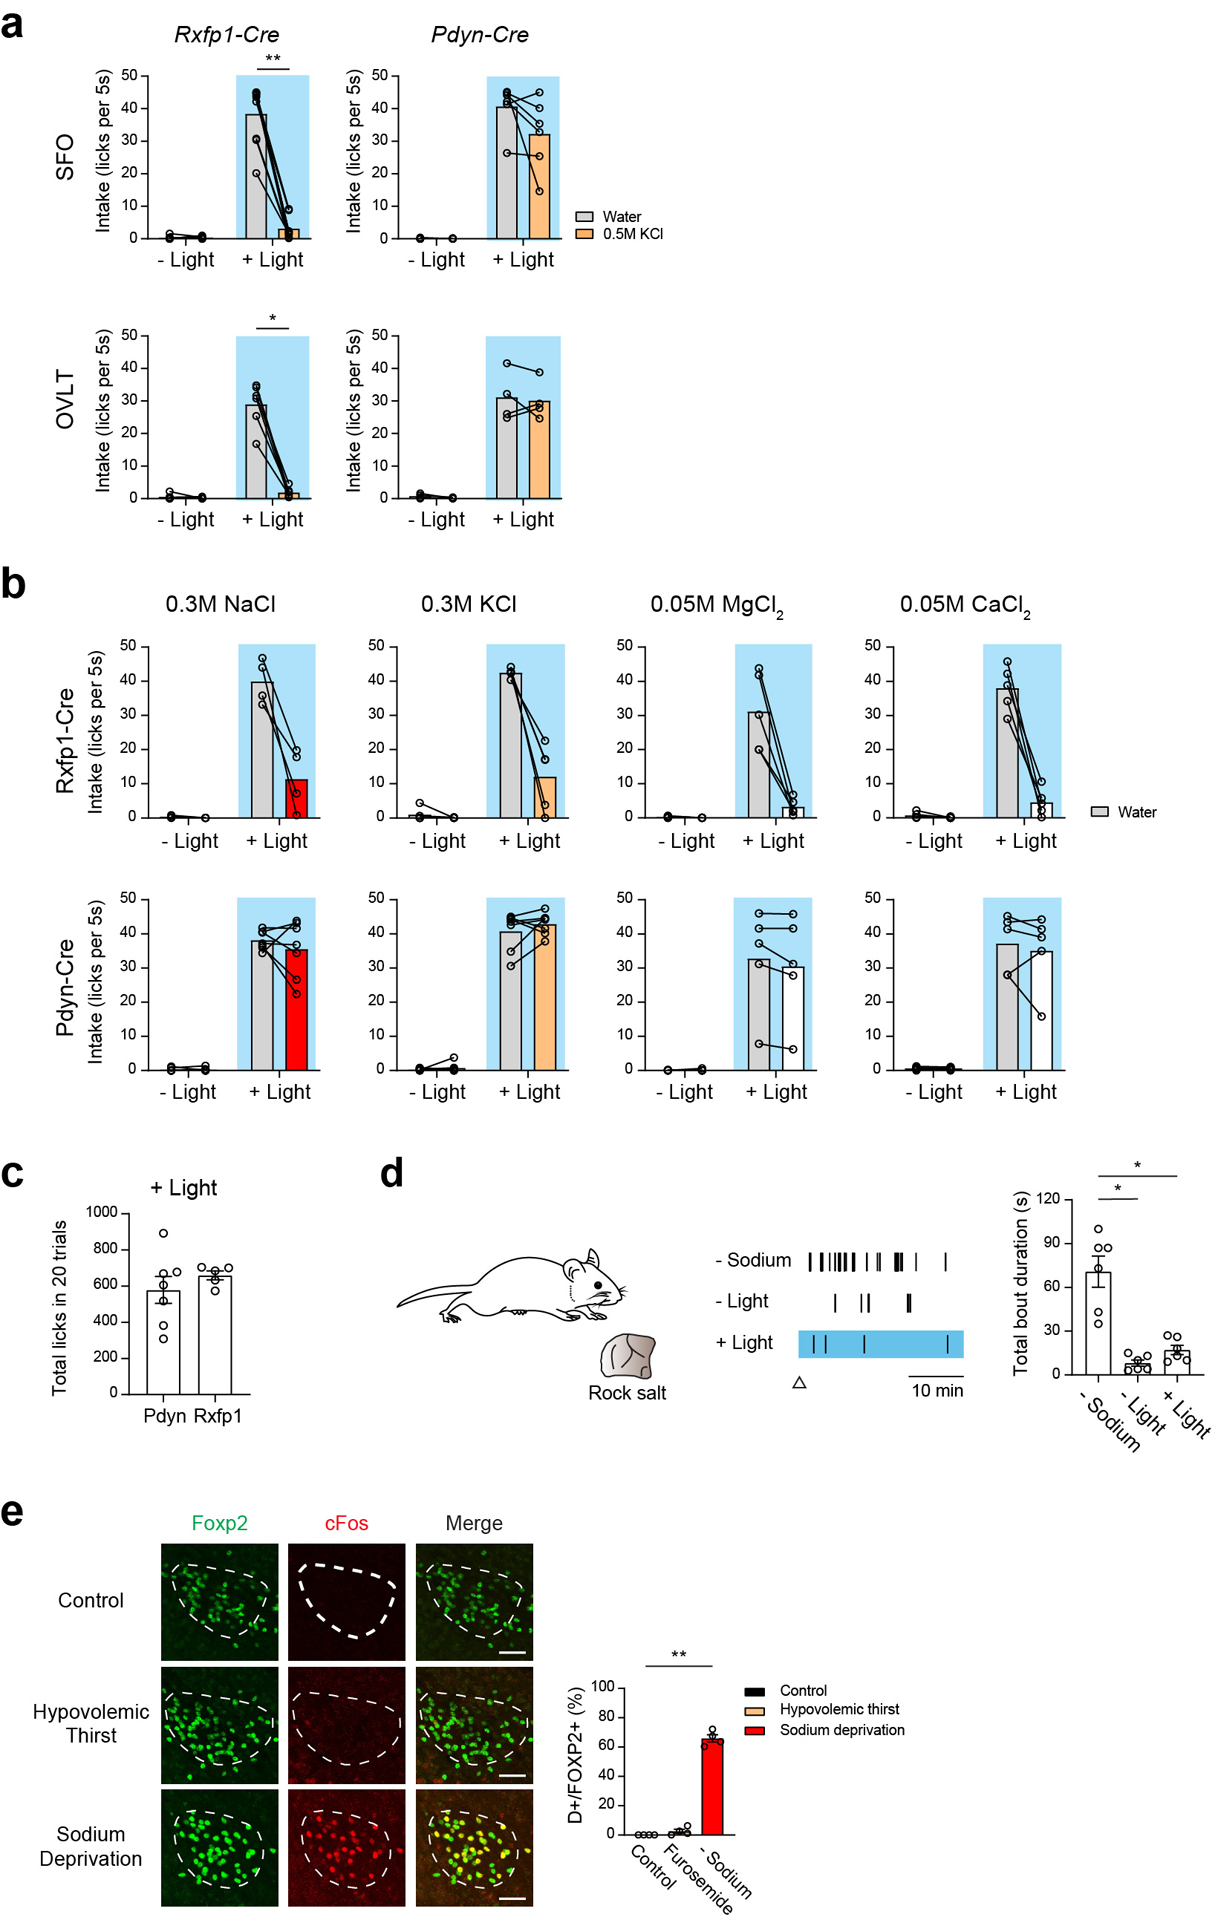
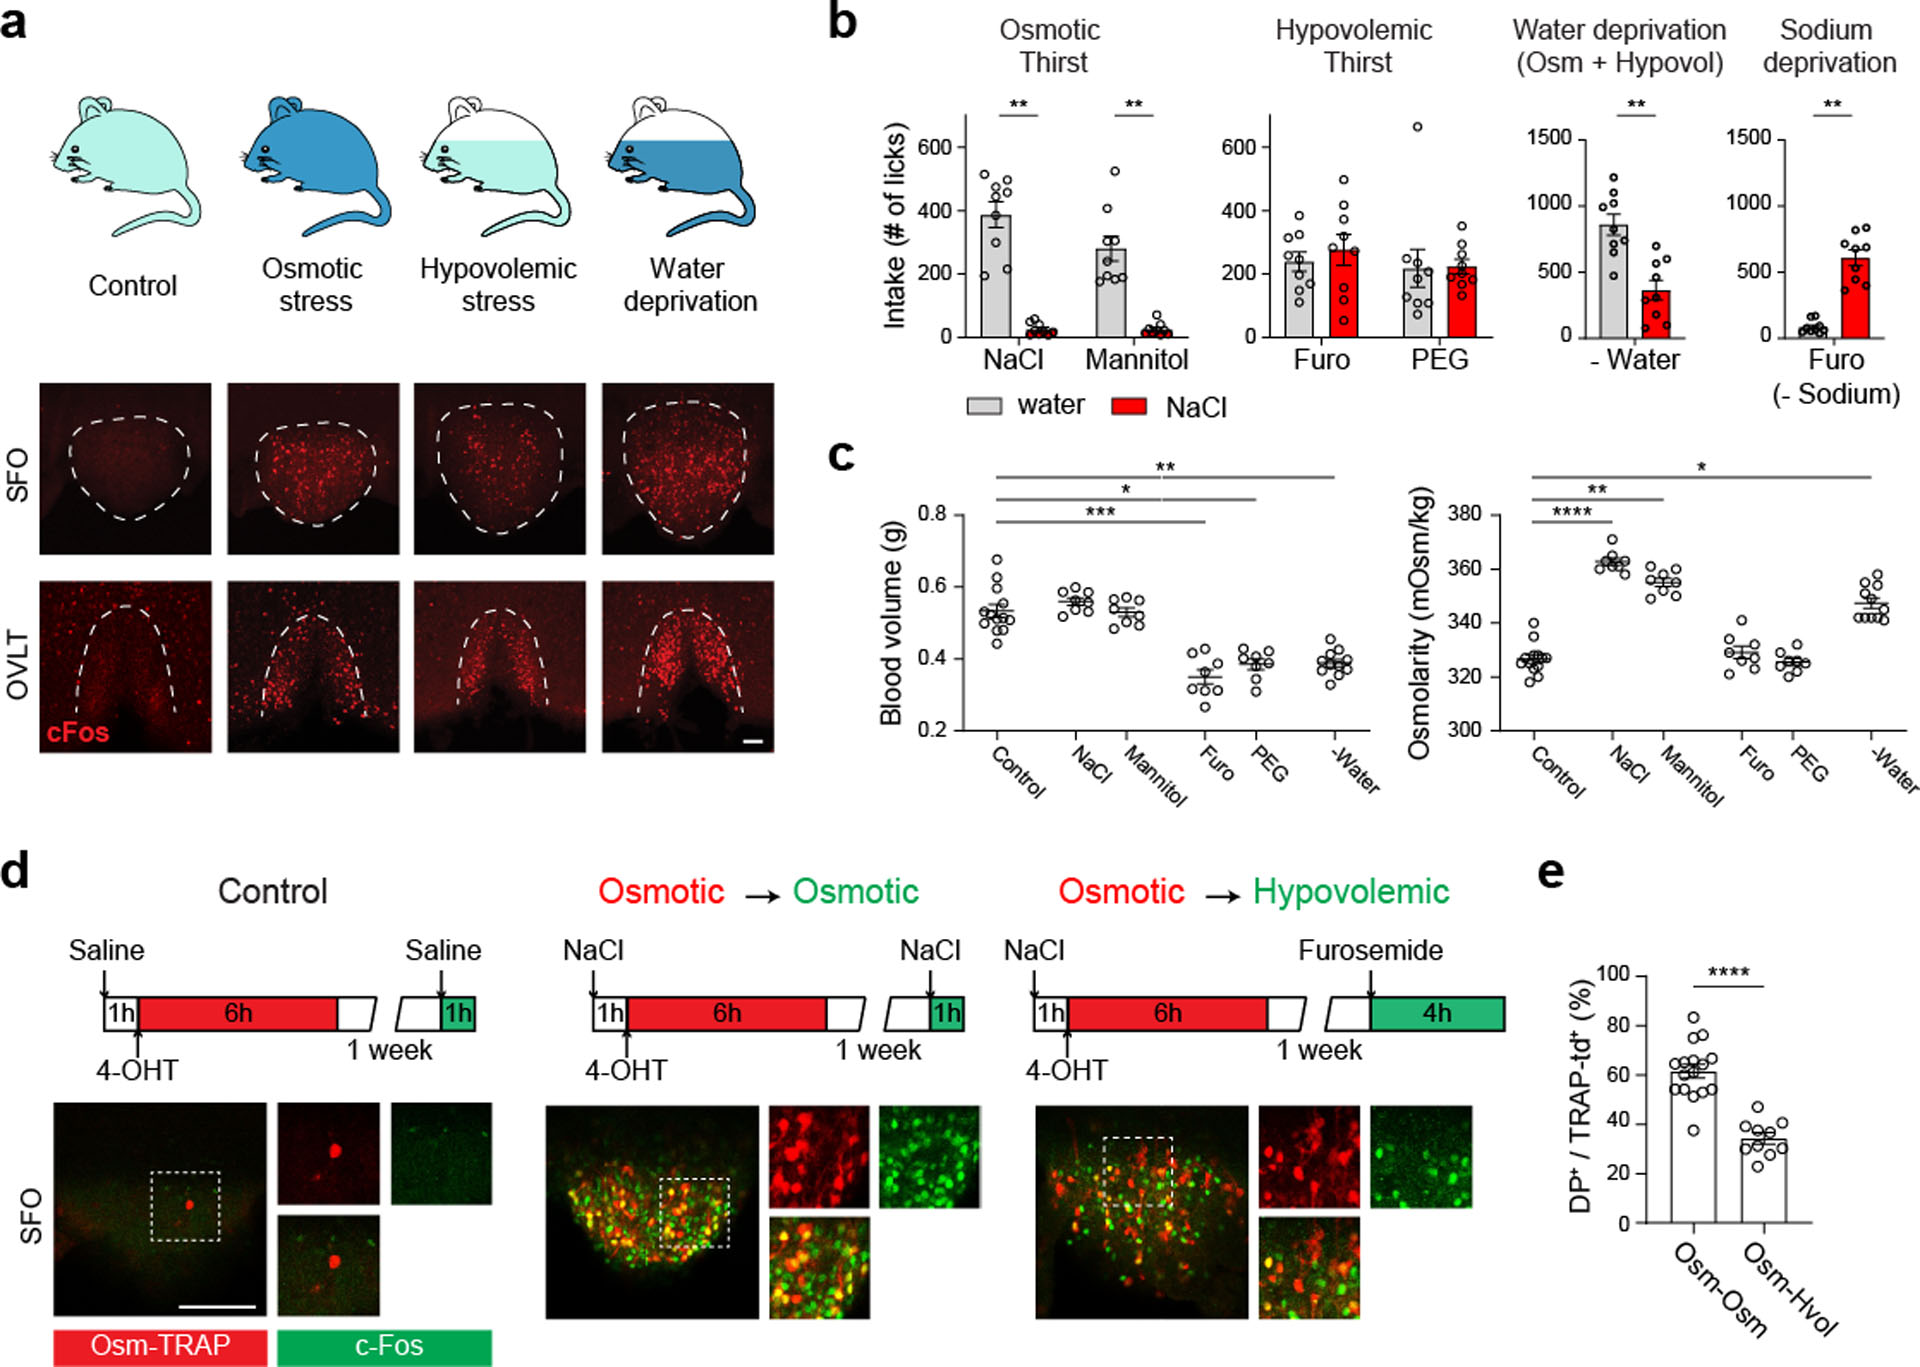
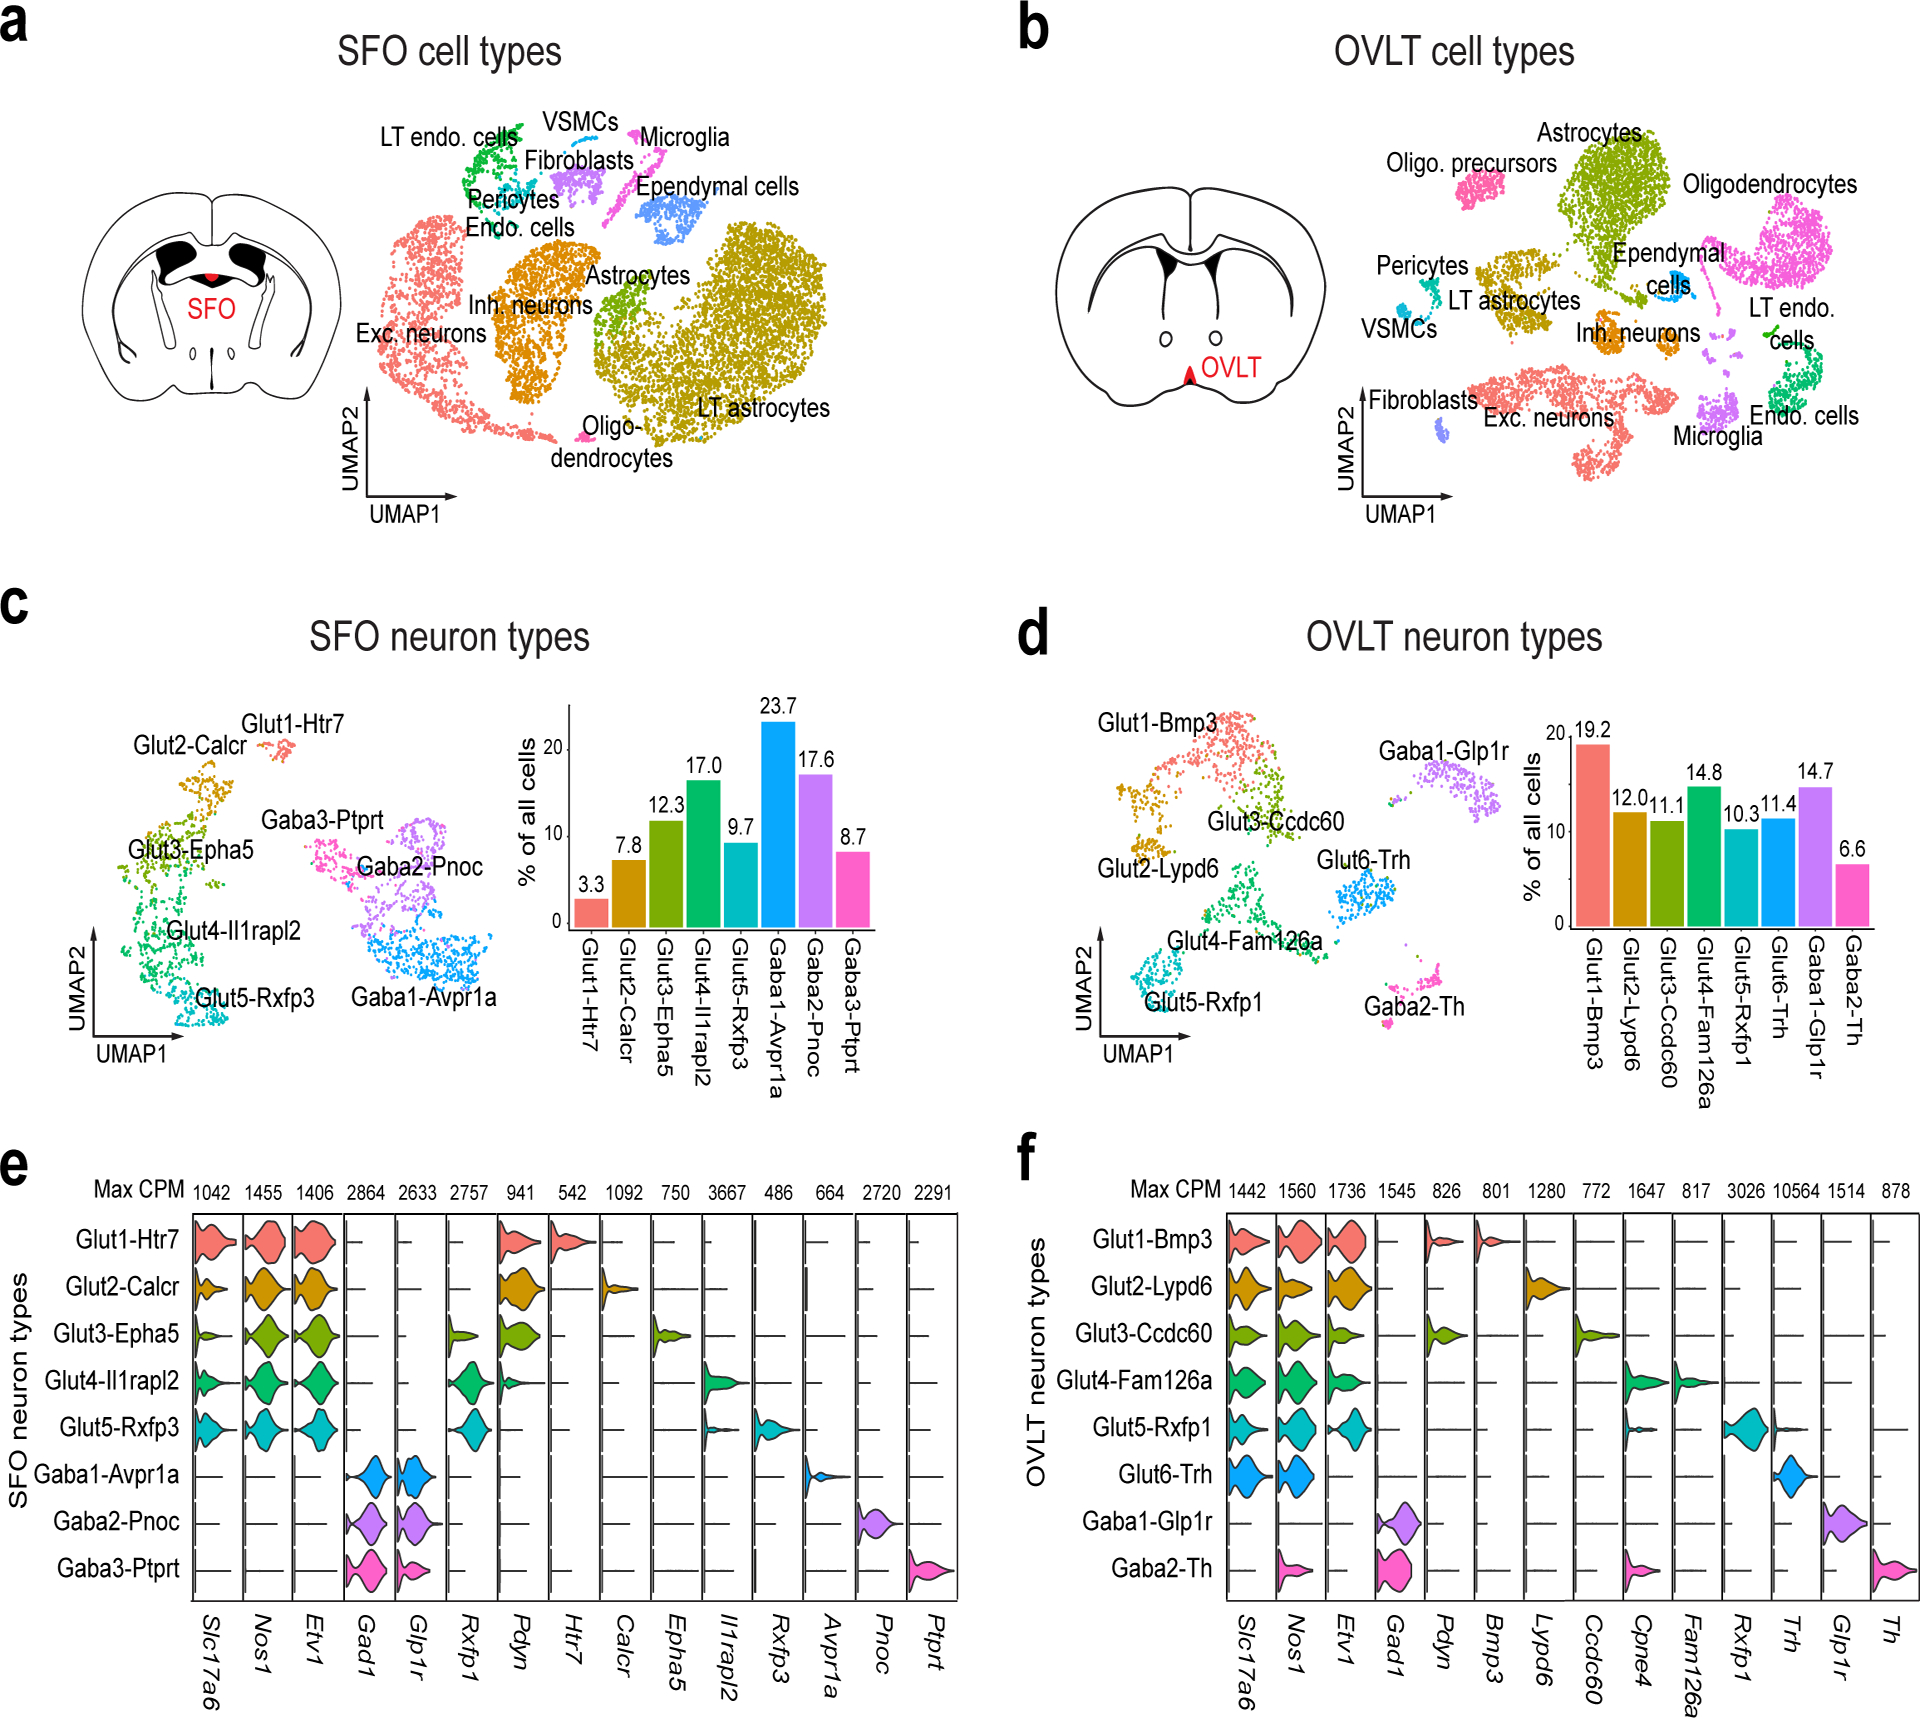
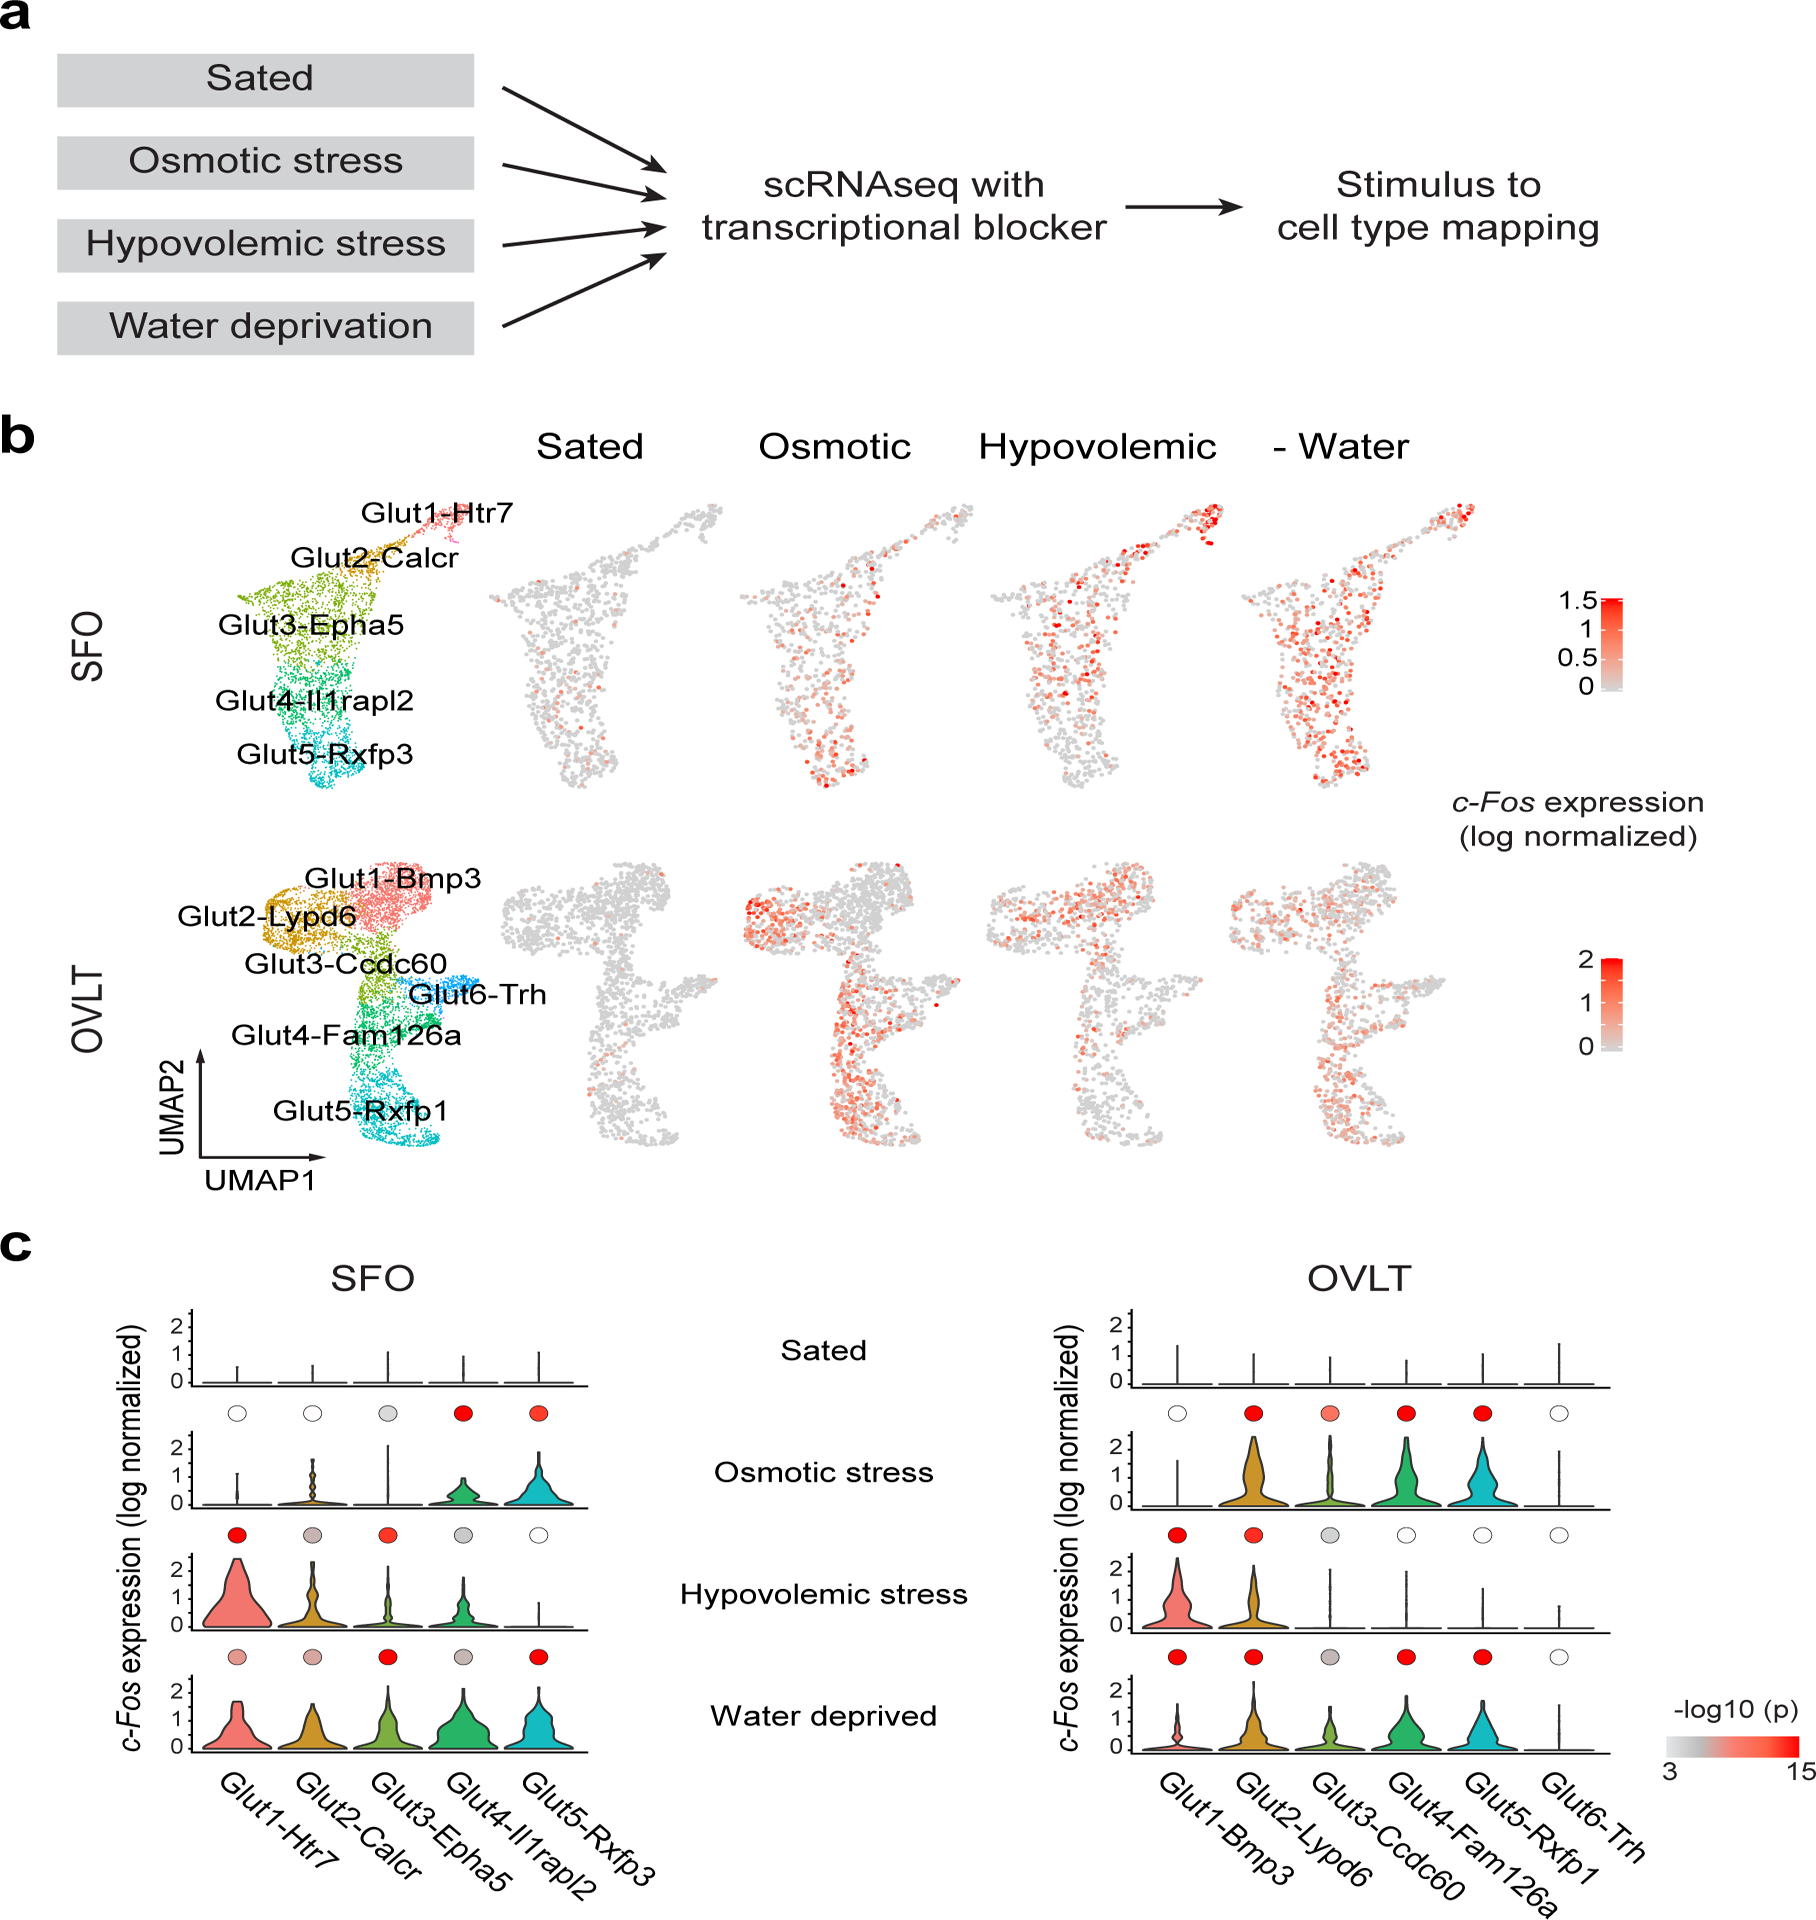
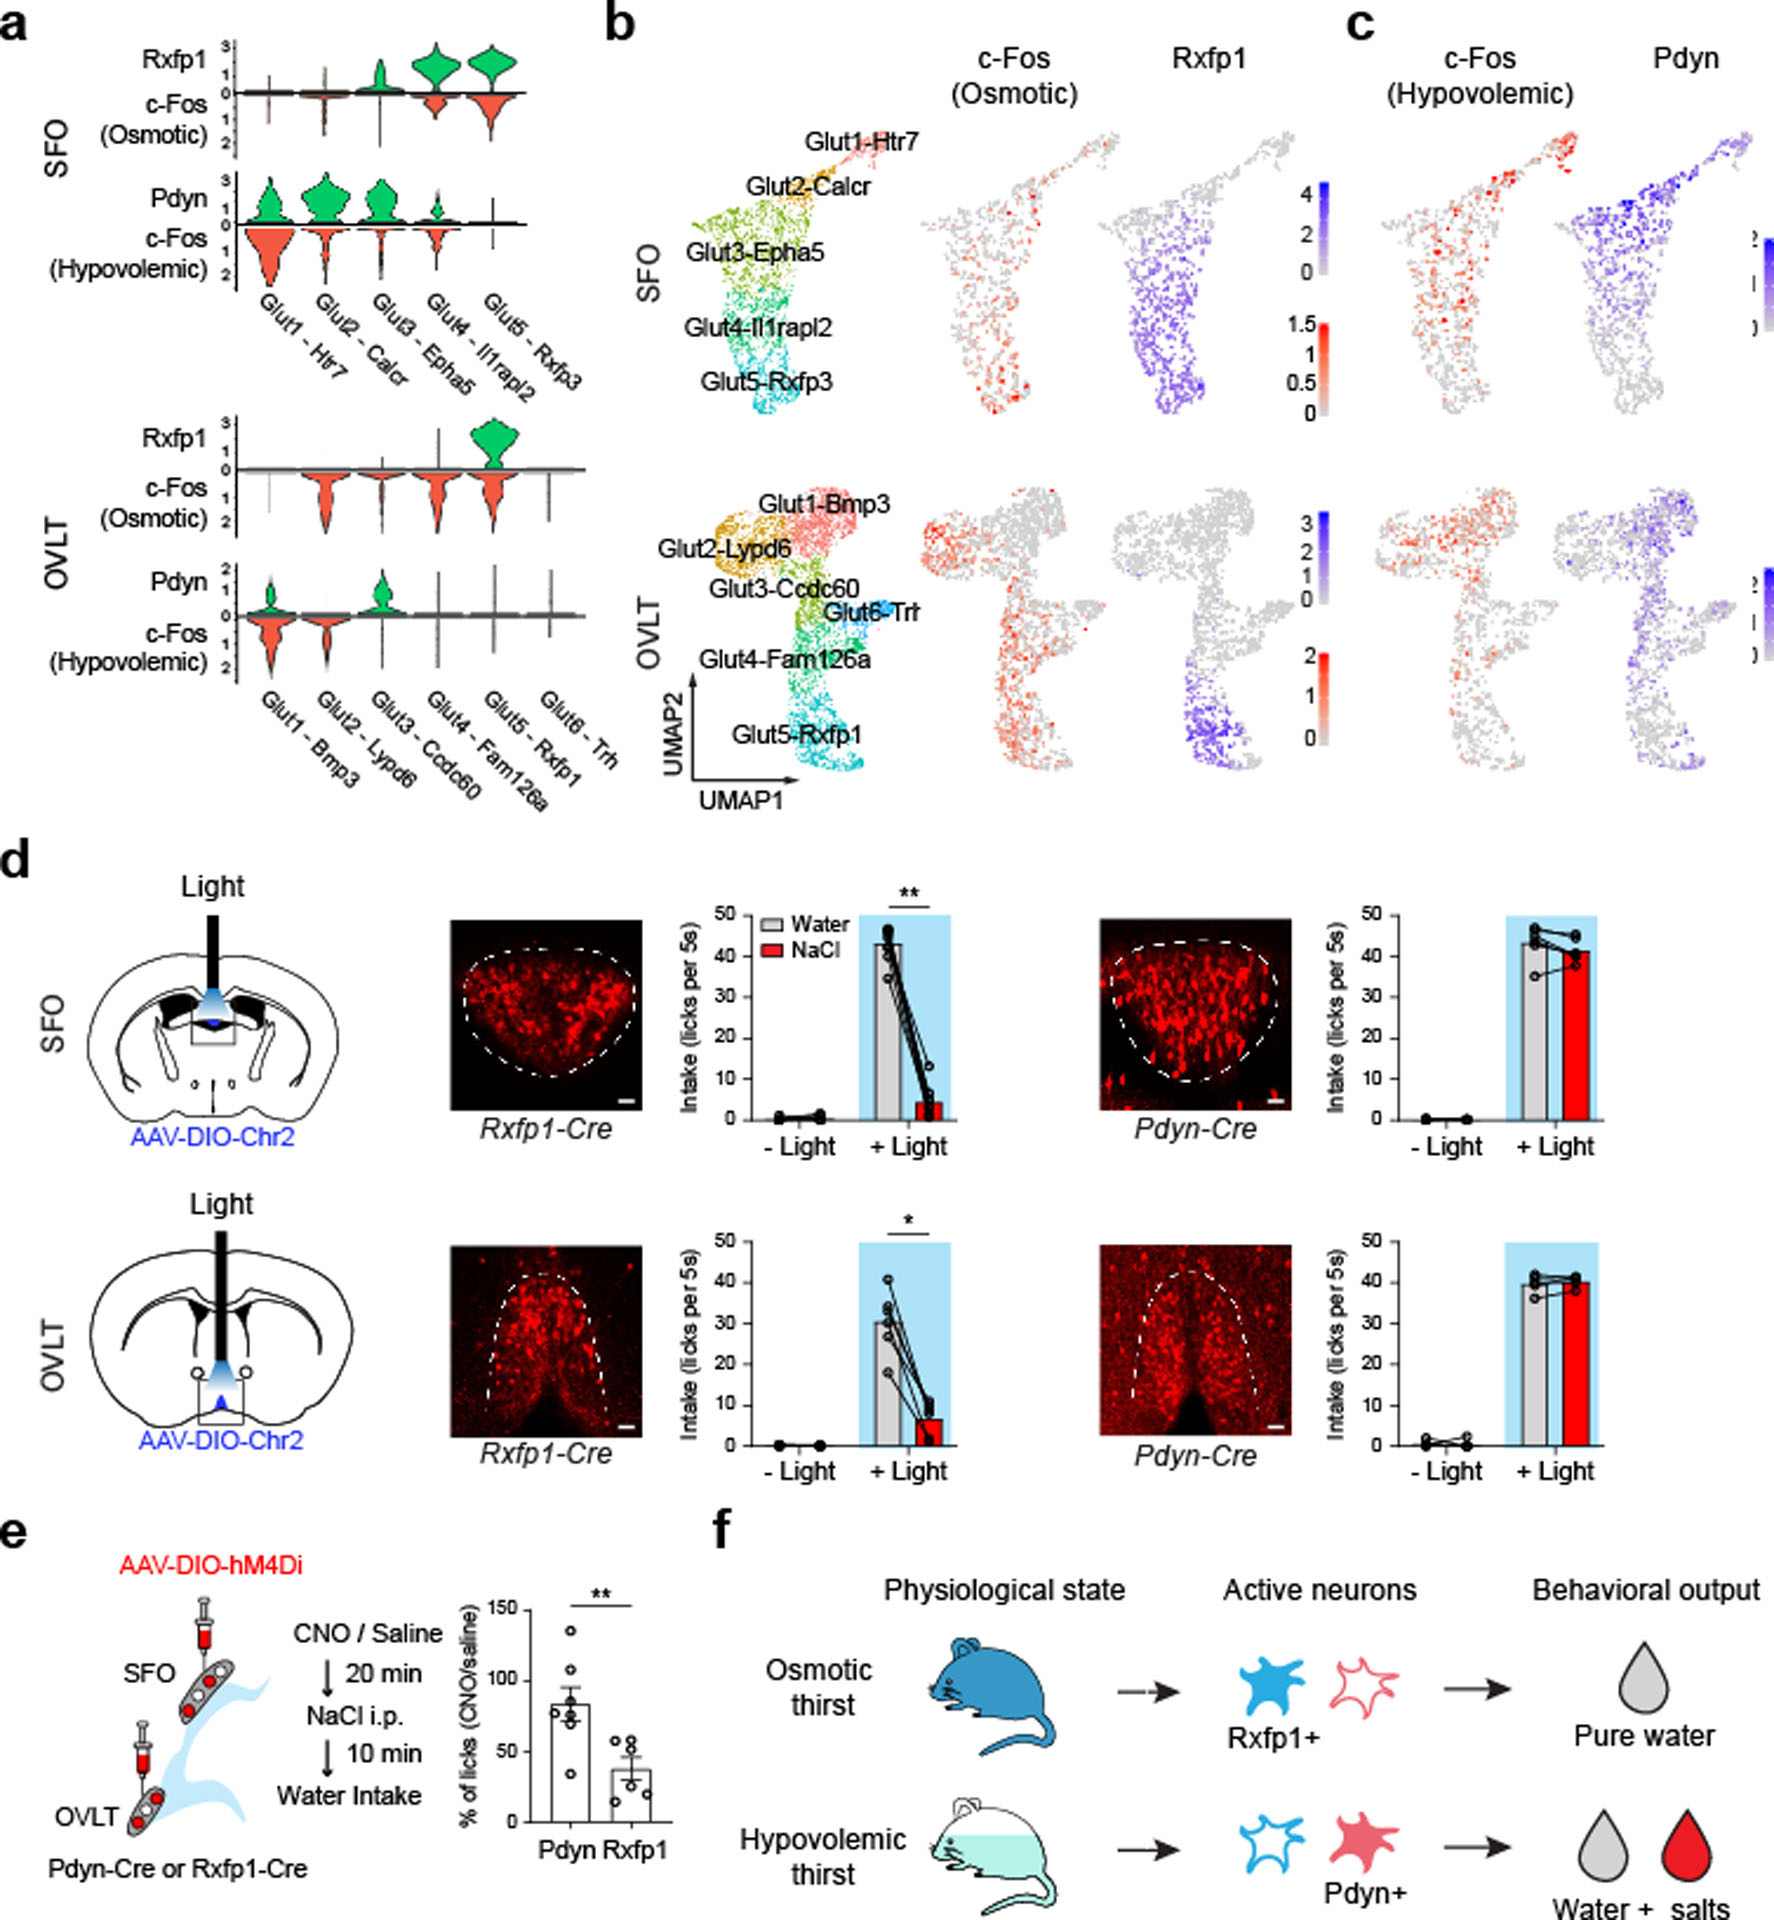
Fluid intake is an essential innate behaviour that is mainly caused by two distinct types of thirst1-3. Increased blood osmolality induces osmotic thirst that drives animals to consume pure water. Conversely, the loss of body fluid induces hypovolaemic thirst, in which animals seek both water and minerals (salts) to recover blood volume. Circumventricular organs in the lamina terminalis are critical sites for sensing both types of thirst-inducing stimulus4-6. However, how different thirst modalities are encoded in the brain remains unknown. Here we employed stimulus-to-cell-type mapping using single-cell RNA sequencing to identify the cellular substrates that underlie distinct types of thirst. These studies revealed diverse types of excitatory and inhibitory neuron in each circumventricular organ structure. We show that unique combinations of these neuron types are activated under osmotic and hypovolaemic stresses. These results elucidate the cellular logic that underlies distinct thirst modalities. Furthermore, optogenetic gain of function in thirst-modality-specific cell types recapitulated water-specific and non-specific fluid appetite caused by the two distinct dipsogenic stimuli. Together, these results show that thirst is a multimodal physiological state, and that different thirst states are mediated by specific neuron types in the mammalian brain.


Conflict of interest statement

The authors declare no competing financial interests.

Figures

Extended Data Figure 1.
Extended Data Figure 1.. Thirst-state-dependent drinking behavior and genetic labeling of active neurons.
a, c-Fos expression in the SFO (left) and OVLT (right) under the five conditions (SFO: n = 6 mice for control, osmotic thirst, and water deprivation 36 hours, 5 for hypovolemic thirst; OVLT: n = 3 for control, 8 for osmotic thirst, 5 for hypovolemic thirst, 7 for water deprivation 36 hours). b, Water and 0.3M NaCl consumption in sated control animals. The number of total licks for water (grey) and 0.3M saline (red) were quantified during a one-hour session (n = 9 mice for each group). c, Water (grey) and 0.3M KCl intake (orange) under osmotic and hypovolemic thirst states. The number of total licks was quantified during a one-hour session (n = 6 mice). d, Experimental diagram for TRAP2 activity-dependent genetic labeling. TRAP2/Ai14 double transgenic animals were challenged with osmotic stress by i.p. injection of NaCl solution in the presence of 4-hydroxytamoxifen (4-OHT). Osmolality sensitive cells (upper) express Cre-ER under the promoter of c-Fos gene, which turns on tdTomato expression (red). In osmolality insensitive cells, the same stimulus does not induce tdTomato expression (bottom). e, Genetic labeling of thirst-sensitive neurons in the OVLT of TRAP2/Ai14 mice. Experimental design to label activated neurons under osmotic thirst and hypovolemic thirst (top). Osmolality sensitive neurons (Osm-TRAP, red) in the OVLT (bottom) overlapped with NaCl-induced acute c-Fos expression (green). Individual labeling and merged images are shown. By contrast, a significantly smaller fraction of Osm-TRAP neurons was co-labeled with hypovolemia-induced c-Fos. Scale bars, 50 μm. f, Quantification of OVLT TRAP2 experiments (n = 6 from 4 mice for Osm-Osm, n = 5 from 4 mice for Osm-Hvol). g, TRAP labeling in the SFO and OVLT of sated control animals (n = 6 from 3 mice for SFO, n = 3 from 2 mice for OVLT). * p < 0.05, ** p < 0.01, *** p < 0.001 by two-tailed Wilcoxon matched-pairs signed rank test or Mann-Whitney test. Data are shown as mean ± s.e.m.
Extended Data Figure 2.
Extended Data Figure 2.. Profiling of cell and neuron types in the SFO and OVLT.
a and b, Violin plots of log-normalized expression of cell-type-defining genes for SFO (a) and OVLT (b) major cell classes with maximum counts per million (max CPM). Bar graph shows profiling resolution per cell type in median genes/cell. c and d, Heat maps of cell-type-specific gene expression in the major cell classes of SFO (c) and OVLT (d). Gene expression data are z-scored with warmer colors indicating higher gene expression. e, Transcriptomic neuron types in the OVLT region (n = 4109 cells) shown in a UMAP embedding (left). Based on Allen In Situ Brain Atlas, cell types were annotated into three anatomic classes: OVLT internal (green), external(red), and regional (both inside and outside of the OVLT) (yellow). We excluded non-OVLT cell types (red) for further analyses (Fig. 2, Extended Data Fig. 2e). f, Violin plot of log-normalized gene expression for all neuron types in the OVLT area. Neuron types outside the OVLT are shown in grey. g and h, Heat map of neuron-type-specific gene expression in the SFO (g) and OVLT (h).
Extended Data Figure 3.
Extended Data Figure 3.. Expression of putative osmoregulatory channels/hormone receptors and cellular comparison between the SFO and OVLT.
a, Dotplot of cell-type-specific expression for putative osmosensory ion channels and receptor genes for osmoregulatory hormone systems in major cell types in the SFO and OVLT (dot size is proportional to % of cells with transcript count > 0 expression, color scale represents z-scored average gene expression, n = 7950 and 6161 cells for SFO and OVLT respectively). b, Dotplot of neuron-type-specific expression for putative osmosensory ion channels and receptor genes for osmoregulatory hormone systems in neuron types in the SFO and OVLT. Although some of the putative genes are not enriched in the SFO or OVLT, they may function outside the LT to regulate thirst (n = 2642 and 1511 neurons for SFO and OVLT respectively). c, Evaluation of transcriptional homology between SFO and OVLT cell types based on Spearman correlation between average expression of top 850 most variable genes from the SFO and OVLT, respectively (n = 1224 genes total). Euclidean distance matrix between cell types was calculated based on the Spearman correlation coefficients between cell types, which were then hierarchically clustered using Ward agglomeration. d, Same analysis on transcriptional homology between SFO and OVLT neuron types based on top 200 most variable genes from the SFO and OVLT (n = 315 genes total).
Extended Data Figure 4.
Extended Data Figure 4.. Stimulus to cell-type mapping in SFO and OVLT.
a, A diagram of scRNA-seq-based stimulus to cell-type mapping protocol. As previously reported, regular scRNA-seq results in artificial induction of IEGs in all neuron types stemming from tissue dissociation,. Performing scRNA-seq with a transcriptional blocker during tissue dissociation suppresses artificial induction of IEGs revealing the stimulus or behavior induced IEG expression pattern. b, Regular scRNA-seq induces high levels of c-Fos expression in all SFO and OVLT neuron types. Data are shown as a violin plot of log-normalized c-Fos transcript count data. c, In the presence of actinomycin D, artificial induction of IEGs in non-stimulated SFO and OVLT neurons is abolished. Images were provided by 10x Genomics. d, Expression of c-Fos in SFO and OVLT major cell classes under distinct thirst states (SFO excitatory neurons n = 931, 689, 775, 706; SFO inhibitory neurons n = 935, 714, 997, 793; SFO LT astrocytes n = 2085, 1907, 2544, 3177; SFO astrocytes n = 110, 138, 97, 265; OVLT excitatory neurons n = 2623, 3027, 2115, 2489; OVLT inhibitory neurons n = 853, 831, 661, 773; OVLT LT astrocytes n = 1229, 1087, 1133, 1238; OVLT astrocytes n = 1736, 1225, 1384, 1353). Data are shown as mean ± s.e.m. e, Expression of other IEGs (Nr4a1 and Fosl2) in SFO and OVLT neuron types under distinct thirst states. All data were analyzed with two-tailed Kruskal-Wallis test with Dunn’s post test. P -values are shown on a log10(p) scale.
Extended Data Figure 5.
Extended Data Figure 5.. Canonical correlation analysis (CCA) based alignment of transcriptomic neuron types under different physiological conditions.
a, A diagram illustrating the misalignment of cell types under distinct physiological states with regular graph-based clustering analysis. b, The CCA workflow for realigning cell types for joint analysis of transcriptomic datasets. c, UMAP embedded scRNA-seq data from SFO and OVLT neurons under distinct thirst states without alignment (left panel), with CCA alignment (middle panel) and cell type identification on CCA aligned data (right panel). d, e, Violin plots of cell-type defining marker genes in CCA aligned stimulus to cell-type mapping datasets for SFO and OVLT respectively.
Extended Data Figure 6.
Extended Data Figure 6.. ulti-color in situ hybridization for anatomical validation of transcriptomic cell-types.
M a, Quantification of SFO Htr7- and Rxfp1-positive cells and their overlap in the SFO (n=12 slices from 4 animals). Scale bar 20 μm. Nuclei are visualized by DAPI staining (white). b, Quantification of Bmp3- and Rxfp1-positive cells and their overlap in the OVLT (n=15 slices from 8 animals). Scale bar 20 μm. c, Rxfp1-and Pdyn-positive cells co-express c-Fos under water deprived conditions. Representative images from 8, 4, 8 and 4 sections from 2 independent experiments for SFO Rxfp1/c-Fos, OVLT Rxfp1/c-Fos, SFO Pdyn/c-Fos and OVLT Pdyn/c-Fos stains respectively. Scale bar 10 μm. d, Cell types labeled by Rxfp3 (SFO) and Cpne4 (OVLT) express c-Fos under osmotic thirst conditions (left). Cell types labeled by Htr7 (SFO) and Bmp3 (OVLT) express c-Fos under hypovolemic thirst (right). Representative images from 2, 2, 3 and 2 sections from 2 independent experiments for SFO Rxfp3/c-Fos, OVLT Cpne4/c-Fos, SFO Htr7/c-Fos and OVLT Bmp3/c-Fos stains respectively. Scale bar 10 μm.
Extended Data Figure 7.
Extended Data Figure 7.. Genetic targeting of osmotic and hypovolemic thirst activated cell populations in the SFO and OVLT.
a, Spearman correlation between c-Fos expression under distinct thirst states and cell-type-specific and thirst-state-specific marker genes. Thirst-state-specific marker genes (Rxfp1 and Pdyn) show higher correlation with c-Fos expression compared to cell-type-specific genes. b, Two-color in situ hybridization of Pdyn and Rxfp1. These gene expression patterns are mostly distinct with minor overlap (arrowhead). Representative images from 8 and 2 slices from 2 independent experiments for SFO (left) and OVLT (right) respectively. Scale bar 10 μm. c, Validation of Cre expression in Pdyn-Cre and Rxfp1-Cre lines. 95.5% of Pdyn-Cre and 100% of Rxfp1-Cre expression matched endogenous gene expression. Representative images from 3 slices from 2 independent experiments for both Pdyn/Cre and Rxfp1/Cre stains. Scale bar 10 μm. d, Immunostaining of the SFO (top) and OVLT (bottom). Shown are Pdyn-positive neurons in Pdyn-Cre/Ai3 animals (representative images out of 8 slices from 4 mice for both SFO and OVLT, left) and Rxfp1-positive neurons in Rxfp1-Cre/Ai14 animals (representative images out of 6 slices from 3 mice for both SFO and OVLT, right). Pdyn- and Rxfp1-positive neurons (red) are a partial population of Etv1-positive excitatory neurons (green). Almost all (>90%) Pdyn- and Rxfp1-positive neurons expressed Etv1. Rxfp1 and Pdyn data are from Fig. 4d. Scale bar 10 μm.
Extended Data Figure 8.
Extended Data Figure 8.. Characterization of Rxfp1-Cre and Pdyn-Cre activation derived consumption phenotypes.
a, Photostimulation of Rxfp1 neurons in the SFO triggered robust drinking preference to pure water (middle panel, n = 9 mice), while photostimulation of SFOPdyn neurons induced indiscriminate intake of both water and 0.5 M KCl (n = 6 mice). We observed similar preference in OVLT neurons (n = 6 mice for Rxfp1-Cre, and n = 4 mice for Pdyn-Cre). b, Drinking patterns of Rxfp1-Cre and Pdyn-Cre animals to different concentrations and various salts. Photoactivation of SFORxfp1 induced robust pure water drinking, while the same animal avoided NaCl (0.3 M, n = 4 mice), KCl (0.3 M, n = 5 mice), MgCl2 (0.05 M, n = 5) and CaCl2 (0.05M, n = 5). Animals that receive stimulation in SFOPdyn neurons accepted all of the above solutions (n = 7 mice for NaCl and KCl, 5 mice for MgCl2 and CaCl2). c, Photostimulation of SFOPdyn and SFORxfp1 neurons triggered comparable total fluid intake (n = 7 mice for SFOPdyn, n = 5 mice for SFORxfp1). The total lick number over 20 trials was quantified. d, Photostimulation of SFOPdyn neurons did not drive sodium-licking behavior (n = 6 animals). Schematic of rock salt behavior test (left). Representative salt licking raster plots under sodium deprivation (-Sodium), sated (- Light) and photostimulation (+ Light) are presented (middle). Triangle marks the start time of recording. The total bout duration is quantified (right). e, Hypovolemic stress failed to activate sodium appetite neurons in Pre-LC. Representative images of c-Fos (red) and Foxp2 expression (a genetic marker for sodium appetite neurons, green) under sated (Control), hypovolemic thirst (Furosemide) and sodium deprived conditions (Sodium deprivation). Quantification shows percentage of activated sodium appetite neurons (double positive / Foxp2 positive neurons, right, n = 4 mice per group). Scale bar, 50 μm. * p < 0.05, ** p < 0.01, *** p < 0.001, **** p < 0.0001, by two-tailed Wilcoxon matched-pairs signed rank test, Mann-Whitney test, Friedman test or Kruskal-Wallis test followed by a Dunn’s post test. Data are shown as mean ± s.e.m.
Figure 1.
Figure 1.. Fluid consumption, physiological changes, and neural activation pattern under distinct thirst states
a, Schematic of different thirst states (top): sated (control), osmotic stress, hypovolemic stress, and water-deprivation. Representative images of c-Fos expression are shown for the SFO (middle) and OVLT (bottom, one from 6 mice). b, Water (grey) and hypertonic saline intake (0.3 M NaCl, red) under different thirst states during a one-hour session (n = 9 mice). c, Blood volume and osmolality under different thirst states (n = 13 mice for control, 8 for NaCl, Mannitol, Furo, and PEG, and 11 for water deprivation). d, Genetic labeling of thirst-sensitive neurons in TRAP2/Ai14 mice (top). Osmolality sensitive neurons (Osm-TRAP, red) in the SFO (bottom) overlapped with NaCl-induced acute c-Fos expression (green). By contrast, significantly smaller fractions of Osm-TRAP neurons were co-labeled with hypovolemia-induced c-Fos. e, Quantification of TRAP2 experiments (n = 16 sections from 8 mice for Osm-Osm, 10 sections from 5 mice for Osm-Hvol). * p < 0.05, ** p < 0.01, *** p < 0.001, **** p < 0.0001 by two-tailed Wilcoxon matched-pairs signed rank test, Kruskal-Wallis test followed by a Dunn’s post test or Mann-Whitney test. Data are shown as mean ± s.e.m. Scale bars, 50 μm.
Figure 2.
Figure 2.. Major cell classes and neuron types in the SFO and OVLT.
a and b, Transcriptomic analyses of the SFO and OVLT. The SFO contains 12 transcriptomic cell classes shown in a UMAP embedding of 7950 cells with color-coded cell identity (a), OVLT contains 13 transcriptomic cell classes (n= 6161 cells) (b). c and d, Transcriptomic analyses of neuron types in the SFO and OVLT. The SFO contains 5 transcriptionally distinct excitatory and 3 inhibitory neuron types shown in a UMAP embedding with color-coded cell identity (c, left, n=2642 cells). The prevalence of each neuron type is shown (c, right). The OVLT contains 6 excitatory and 2 inhibitory neuron types (d, n=1511 cells). e and f, Violin plot of log-normalized expression of cell-type-defining genes for SFO (e) and OVLT (f) neuron types with maximum counts per million (max CPM).
Figure 3.
Figure 3.. Stimulus to cell-type mapping reveals neuron types tuned to distinct thirst states.
a, Experimental design for identifying active neurons under distinct thirst states. scRNA-seq was performed in the presence of actinomycin D, a transcriptional blocker. Activated neuron types were mapped based on IEG expression. b, Neuronal data from the SFO (top) and OVLT (bottom) under four physiological conditions were aligned using Canonical Correlation Analysis (CCA) and mapped on a UMAP embedding (n= 6540 and n = 7206 neurons for SFO and OVLT, respectively). Expression of c-Fos is plotted on a log-normalized scale as a proxy for neural activation (red). 1866, 1403, 1772 and 1499 neurons (SFO), and 1841, 2257, 1461 and 1647 neurons (OVLT) were analyzed For control, osmotic stress, hypovolemic stress and water deprivation states. c, Violin plot of log-normalized c-Fos expression under different thirst states with color-coded log scaled p-values (–log10p). Two-tailed Kruskal-Wallis test with Dunn’s post test was used to compare cell type specific gene expression under control conditions to corresponding cell types in three experimental conditions. White color indicates p>0.001.
Figure 4.
Figure 4.. Activation of thirst-state-specific cell populations in the SFO and OVLT recapitulates thirst modality specific drinking patterns.
a, Violin plot of Rxfp1 and Pdyn log-normalized expression in SFO and OVLT excitatory neuron types (green) compared to thirst-state-specific c-Fos expression (red) in corresponding cell types. The data were reanalyzed from Fig. 2 and 3. b and c, UMAP embedding for Rxfp1 and Pdyn expression (blue) in SFO (top) and OVLT (bottom) excitatory neuron types. C-Fos data are replotted for reference from Fig. 3b. d, Optogenetic activation of osmotic and hypovolemic stress sensitive neurons in the SFO (top) and OVLT (bottom). Diagram of optogenetic gain-of-function experiments for distinct thirst neuron subtypes (left). Representative images of Rxfp1-Cre labeled cells (middle, Rxfp1-Cre/Ai14). Consumption of pure water (grey) and 0.5M NaCl (red) were quantified from 9 mice for SFO and 6 mice for OVLT. Conversely, stimulation of Pdyn neurons drives consumption of both water and hyperosmotic salt solution (right), Data are quantified from 6 mice for SFO and 5 mice for OVLT. Scale bar = 10 um. e, Schematic of chemogenetic inhibition of Rxfp1- and Pdyn-positive neurons under osmotic thirst (left). NaCl (i.p.)-induced drinking was significantly suppressed by the inhibition of Rxfp1-positive neurons (n = 6 mice), but not by Pdyn-positive neurons (n = 7 mice). f, Diagram depicting the cellular logic underlying distinct thirst states. * p < 0.05, ** p < 0.01, *** p < 0.001, **** p < 0.0001, by two-tailed Wilcoxon matched-pairs signed rank test or Mann-Whitney test. All data are shown as mean ± s.e.m.

References

    1. Fitzsimons JT The physiology of thirst and sodium appetite. Monogr Physiol Soc, 83–122 (1979). - PubMed
    1. Leib DE, Zimmerman CA & Knight ZA Thirst. Curr Biol 26, R1260–R1265, doi:10.1016/j.cub.2016.11.019 (2016). - DOI - PMC - PubMed
    1. McKinley MJ & Johnson AK The physiological regulation of thirst and fluid intake. News Physiol Sci 19, 1–6 (2004). - PubMed
    1. Augustine V, Lee S & Oka Y Neural Control and Modulation of Thirst, Sodium Appetite, and Hunger. Cell 180, 25–32, doi:10.1016/j.cell.2019.11.040 (2020). - DOI - PMC - PubMed
    1. Bourque CW Central mechanisms of osmosensation and systemic osmoregulation. Nature reviews. Neuroscience 9, 519–531, doi:10.1038/nrn2400 (2008). - DOI - PubMed

Publication types