. 2020 Nov;587(7835):644-649.
doi: 10.1038/s41586-020-2825-4. Epub 2020 Oct 14.

Cell-type-specific 3D epigenomes in the developing human cortex

Affiliations

Cell-type-specific 3D epigenomes in the developing human cortex

Michael Song et al. Nature. 2020 Nov.

Abstract

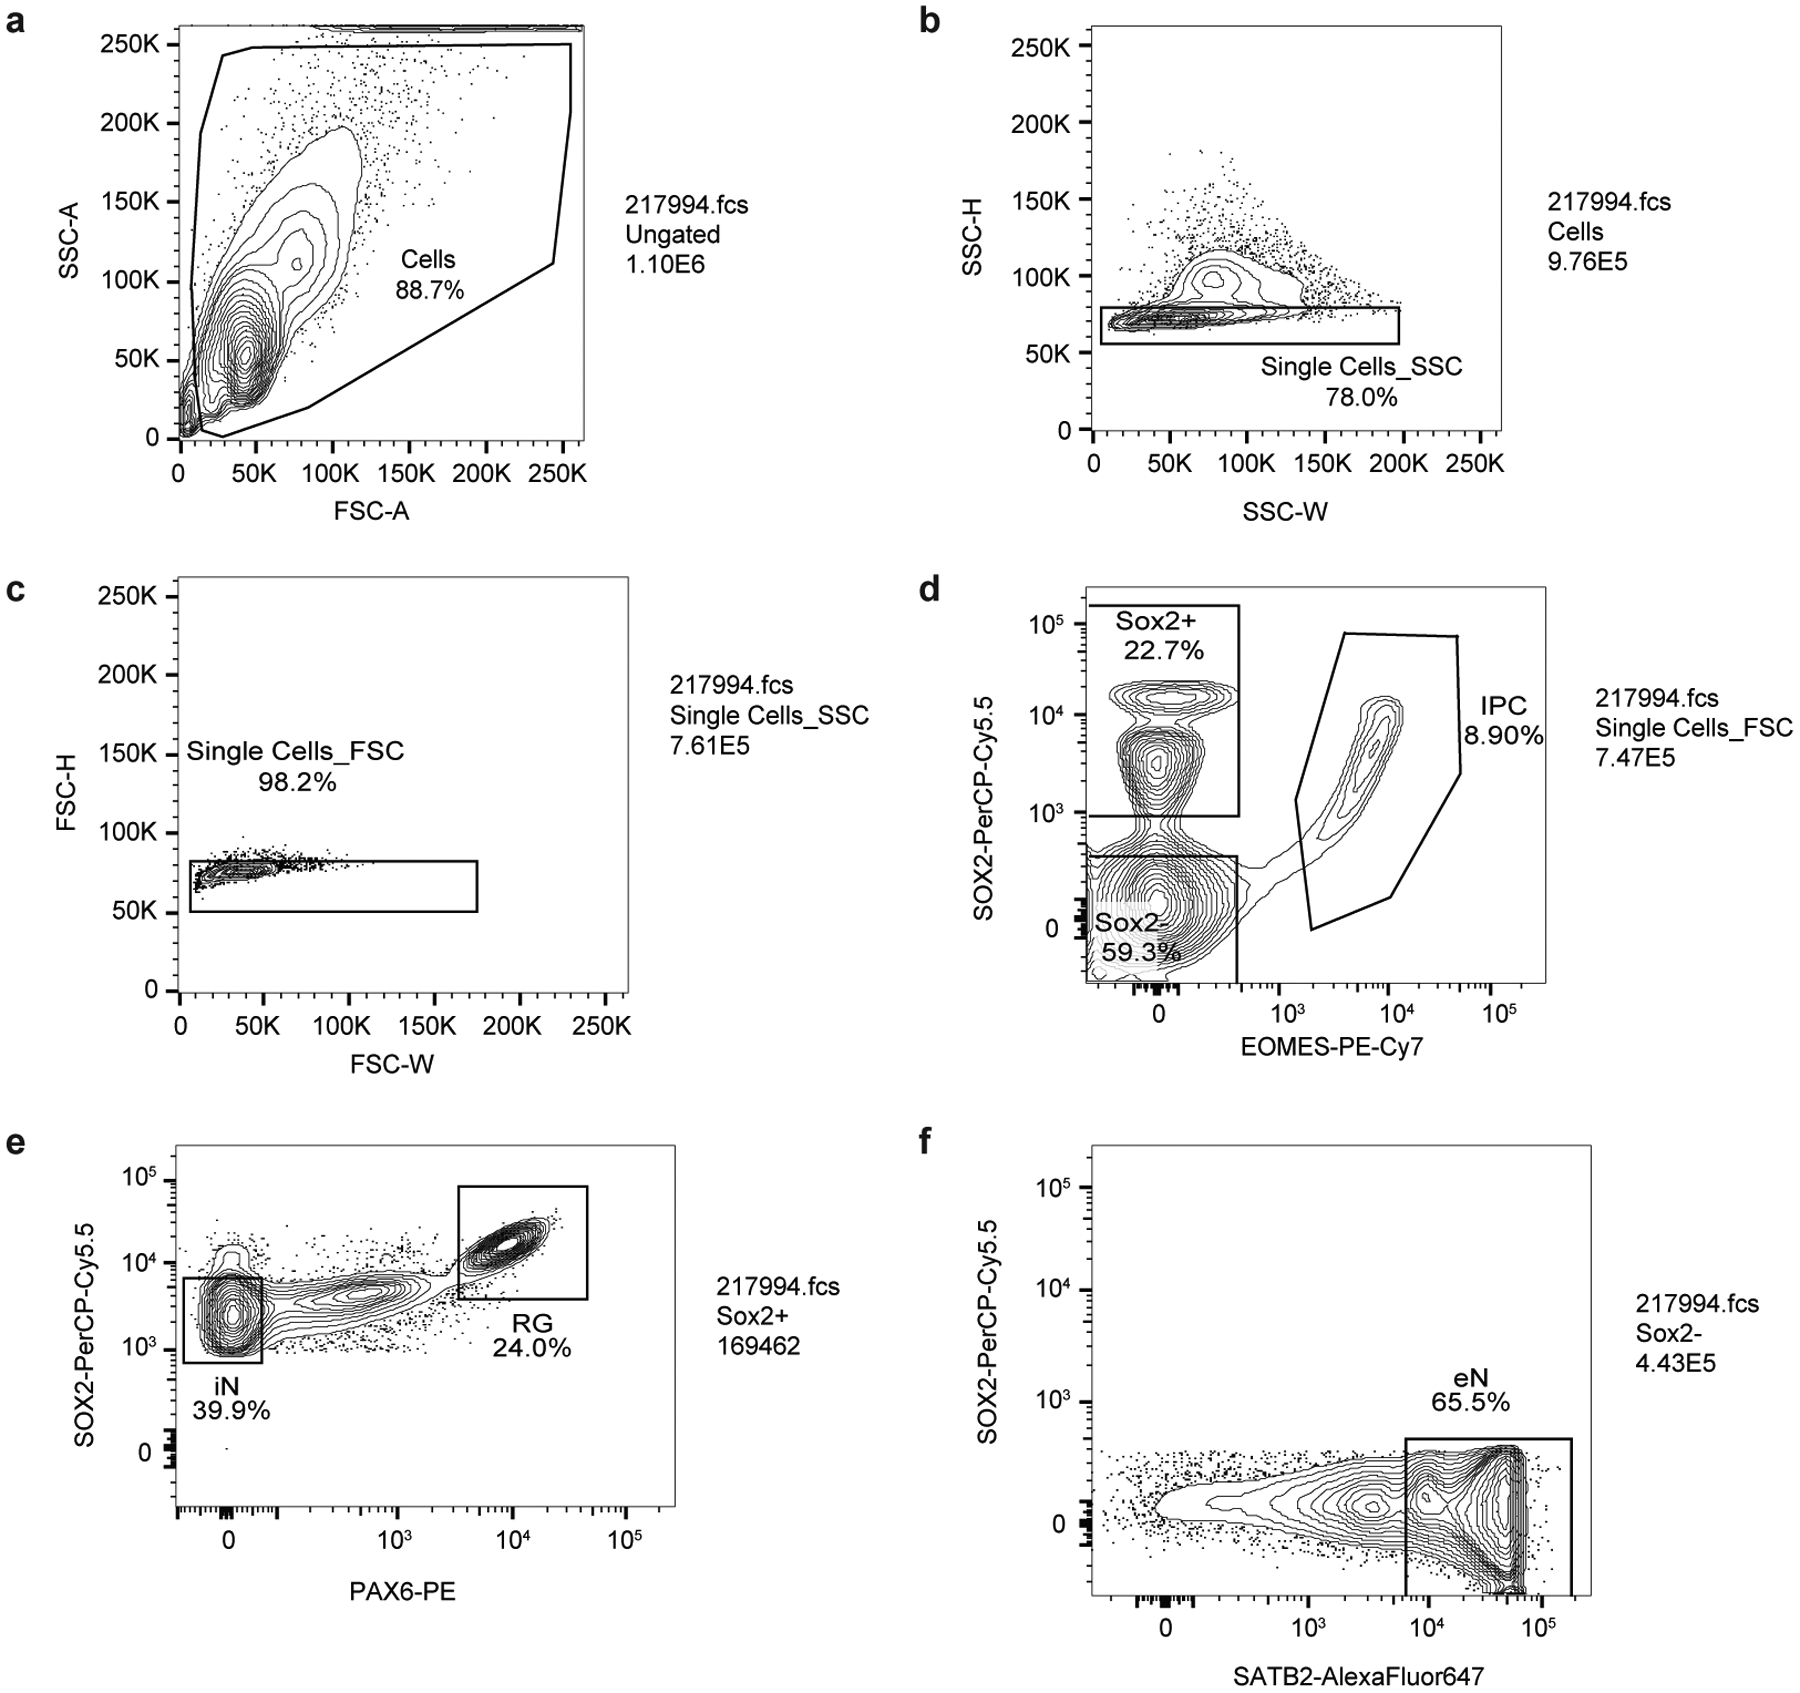
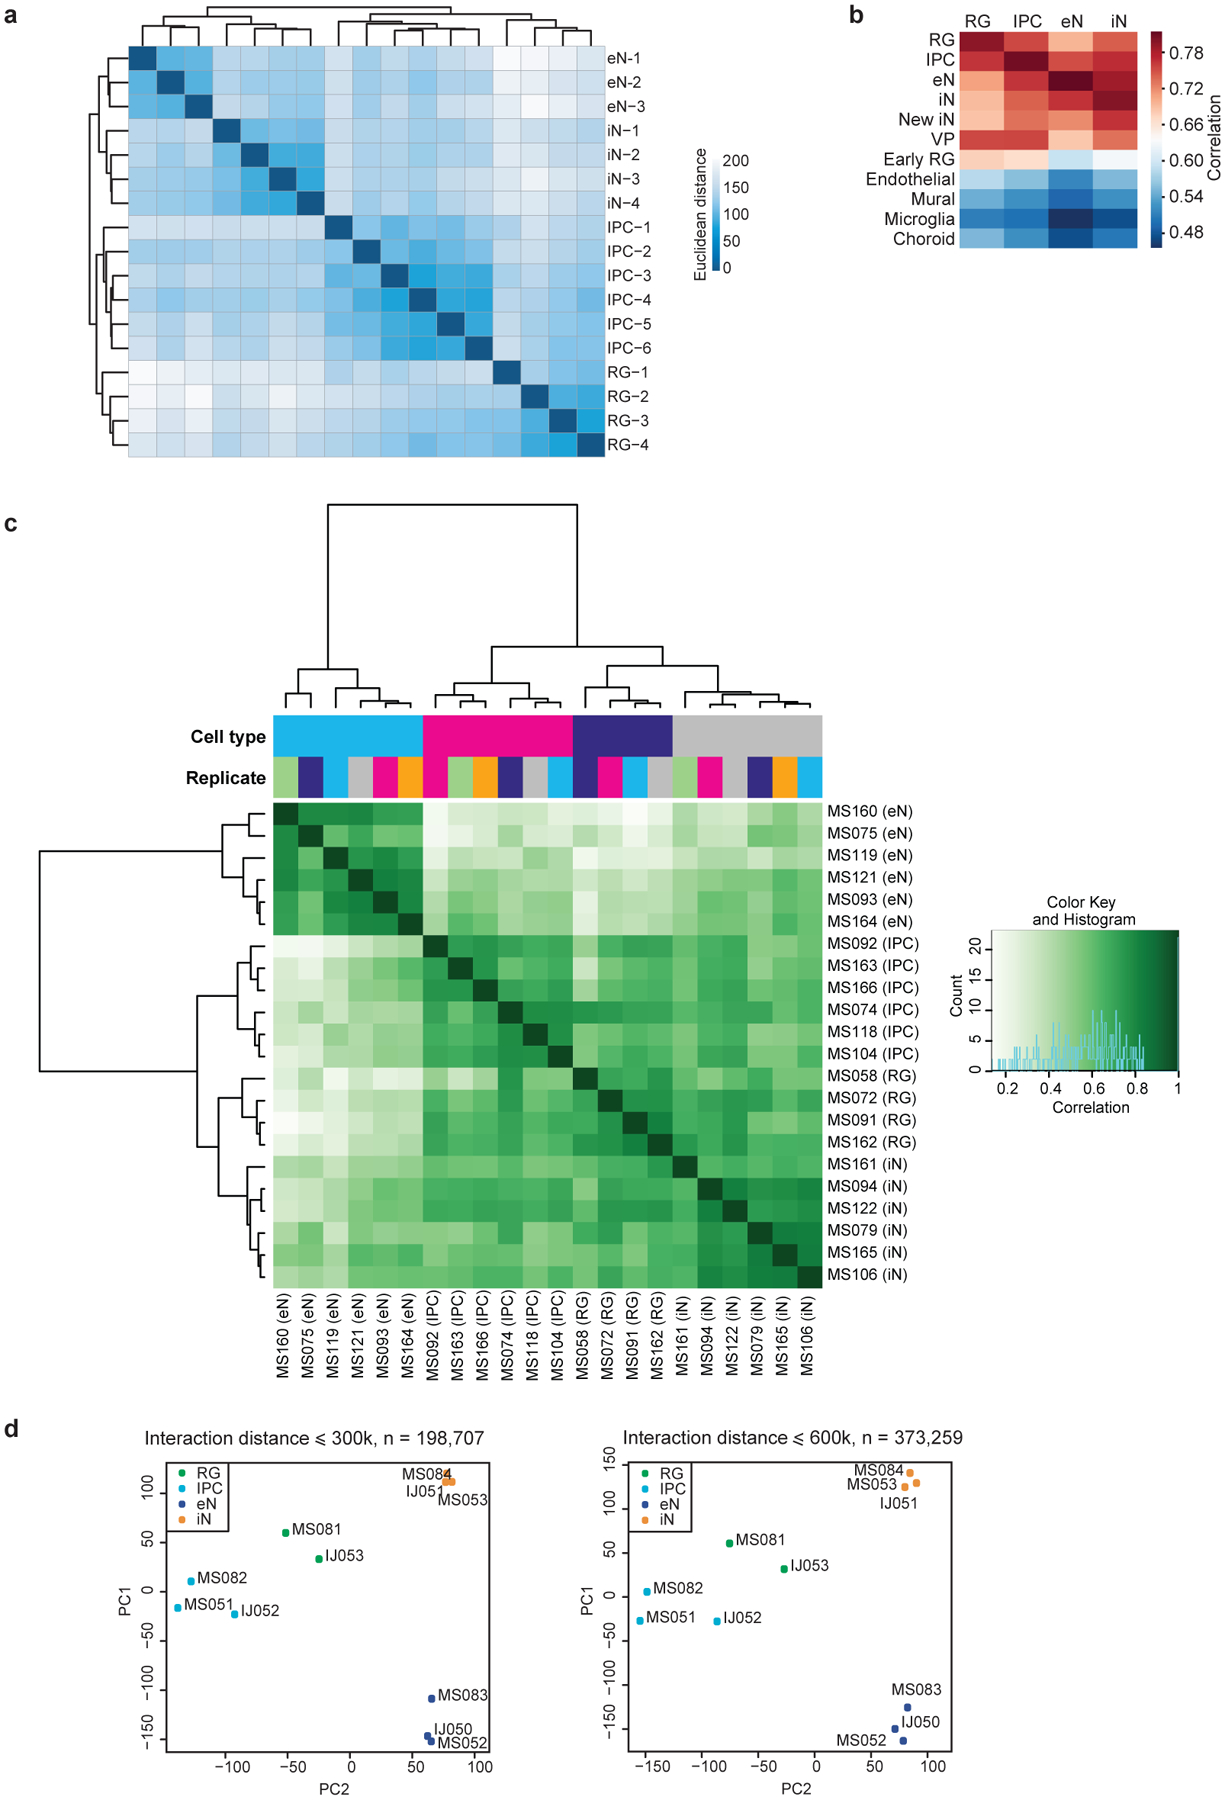
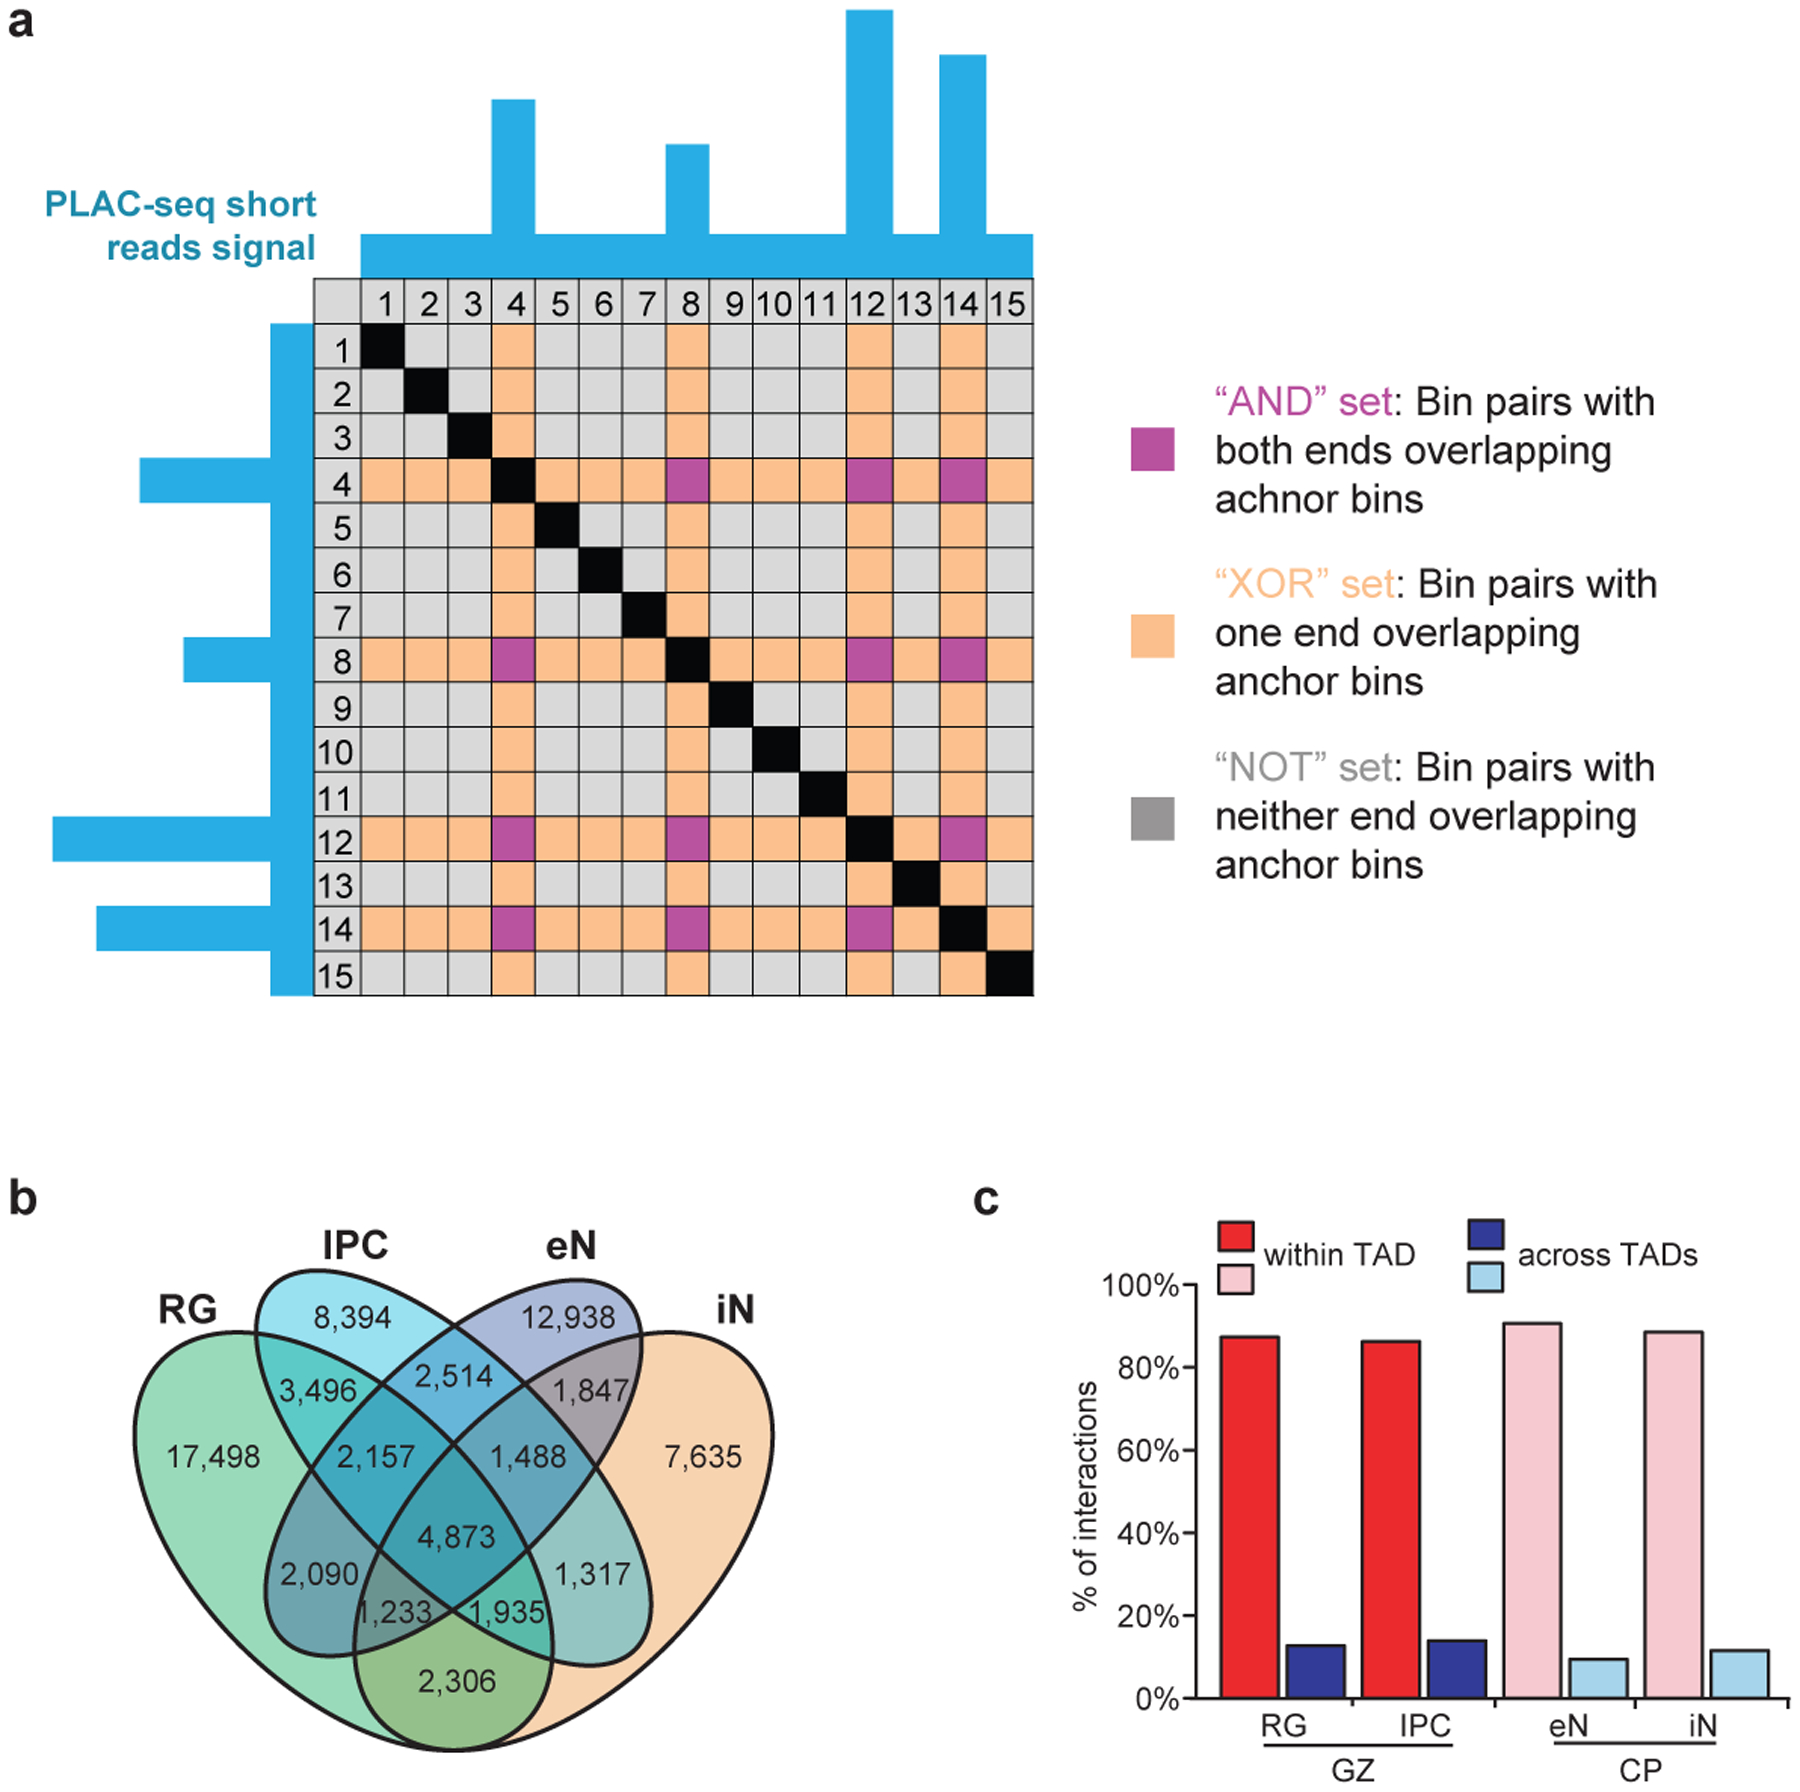
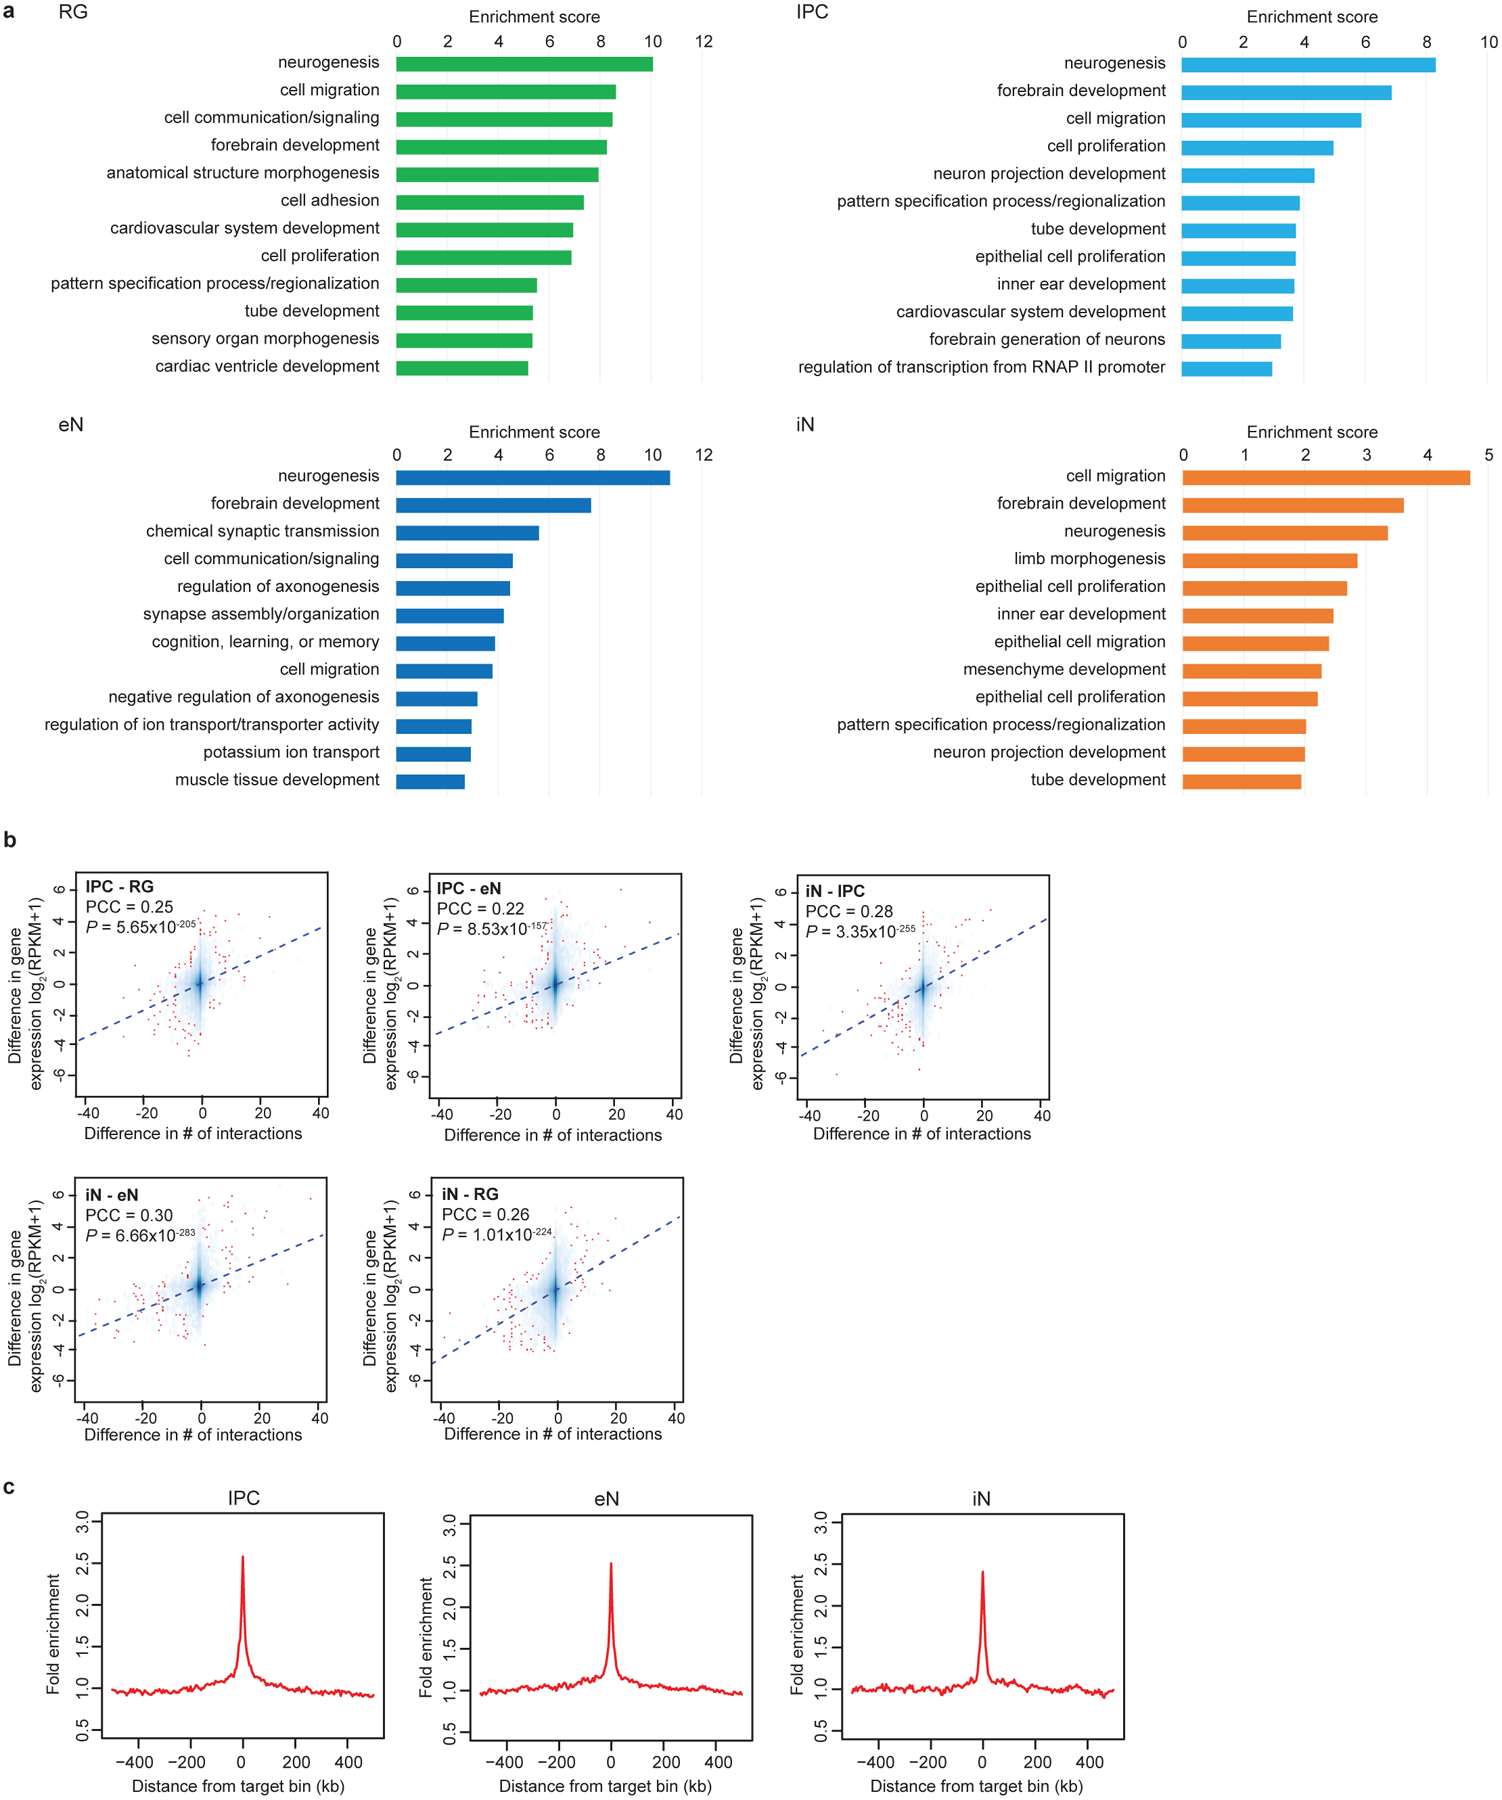
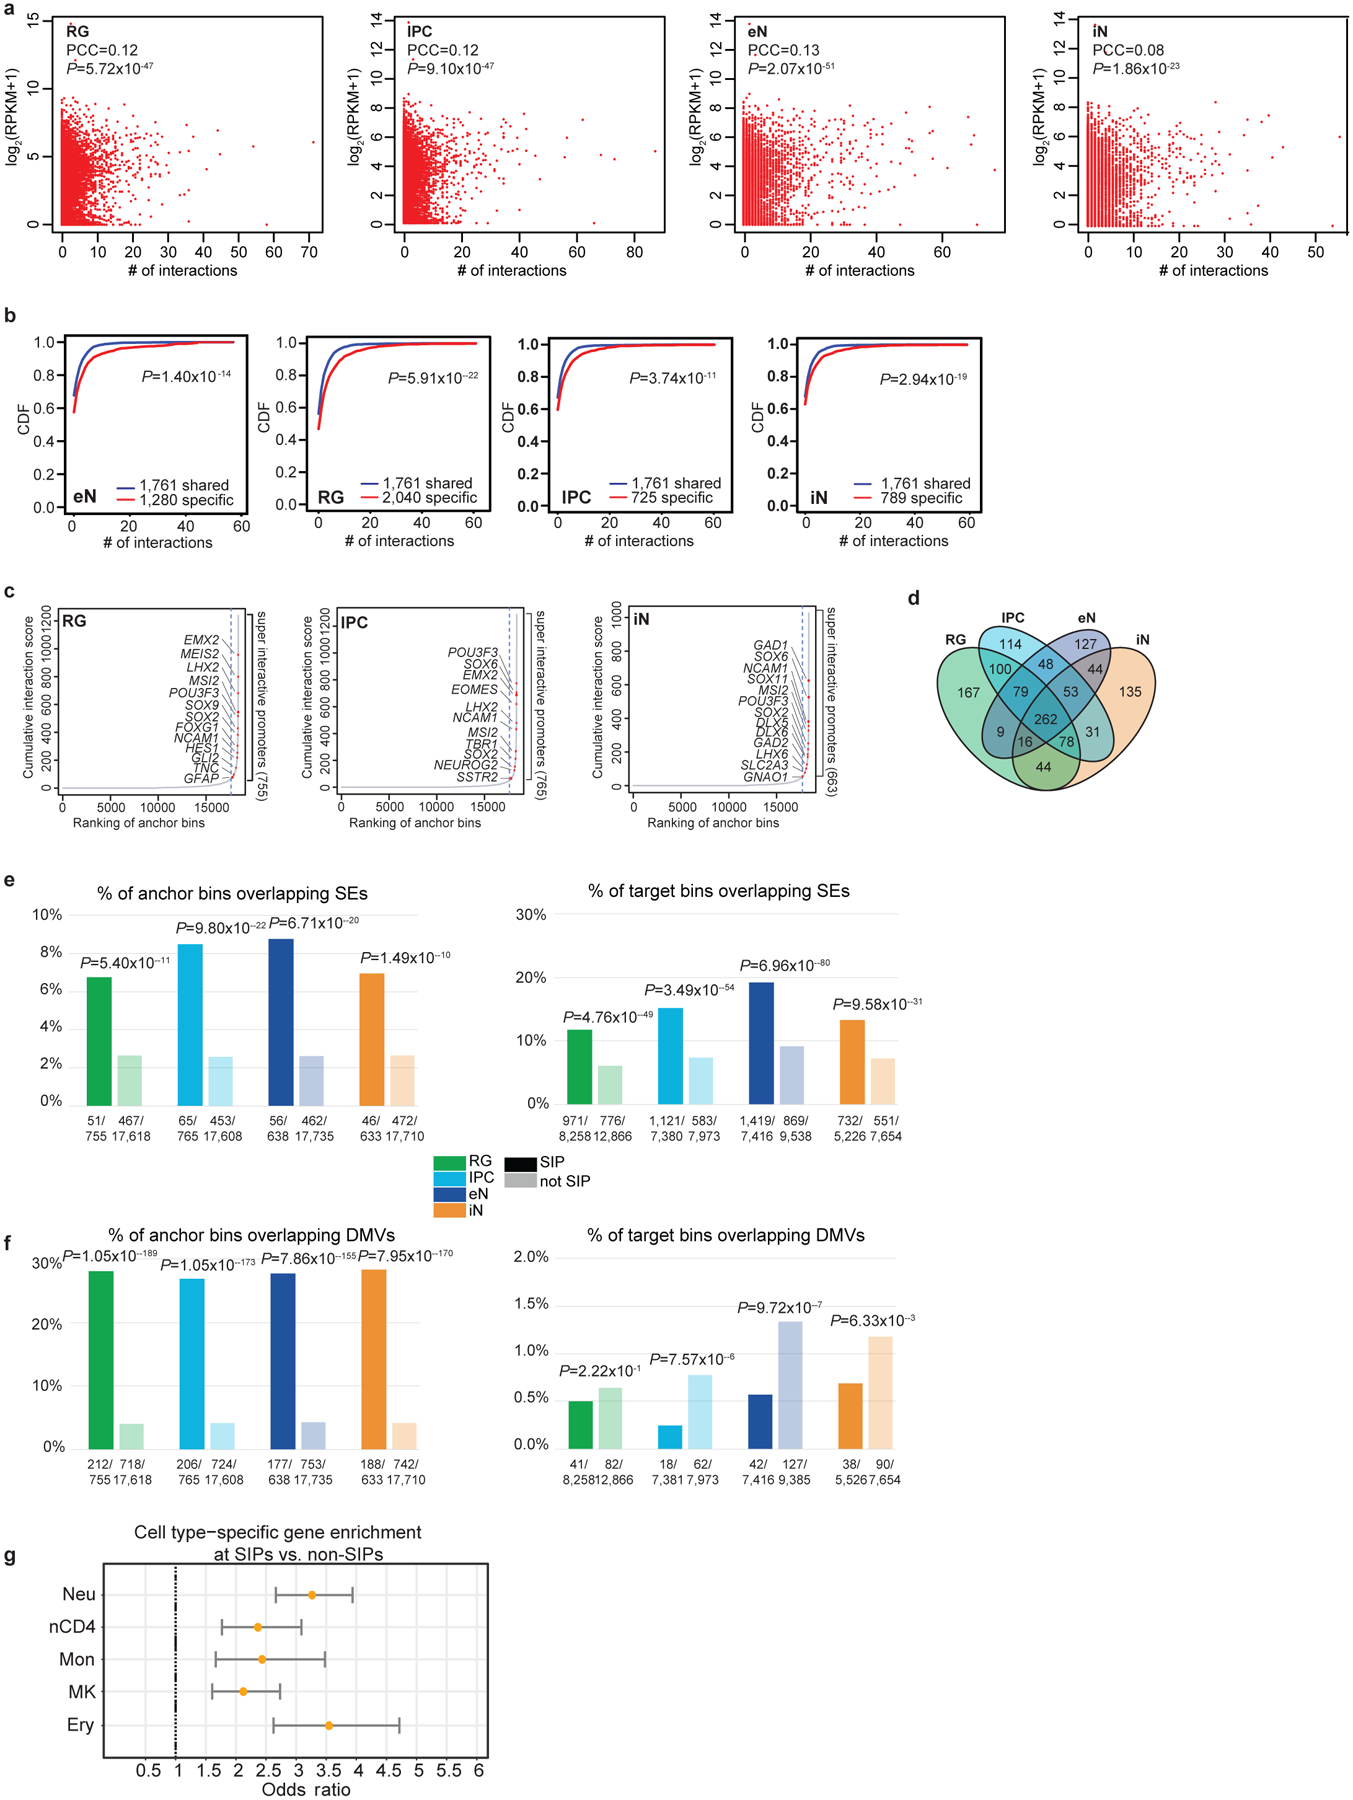
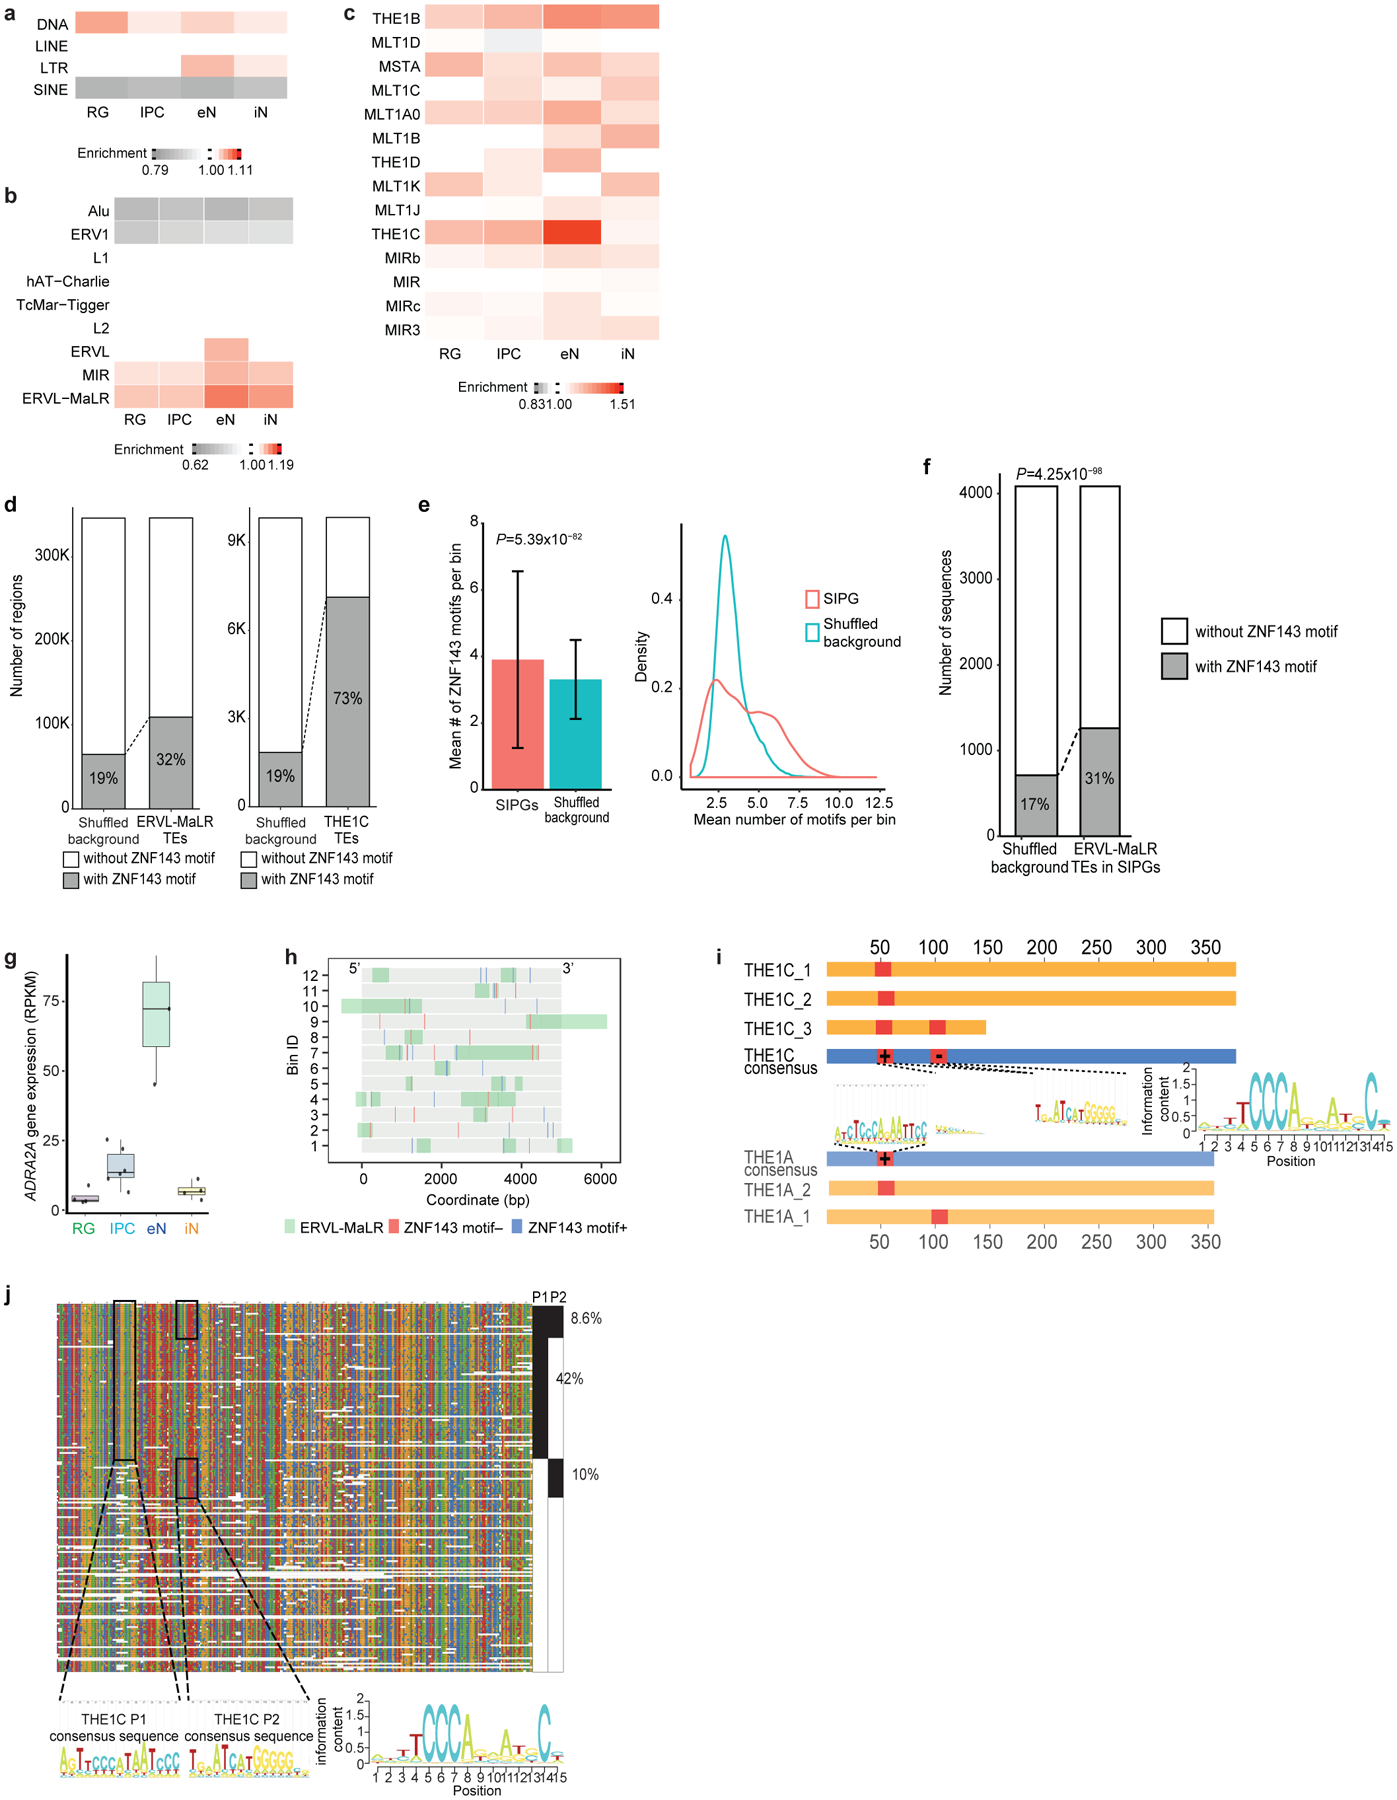
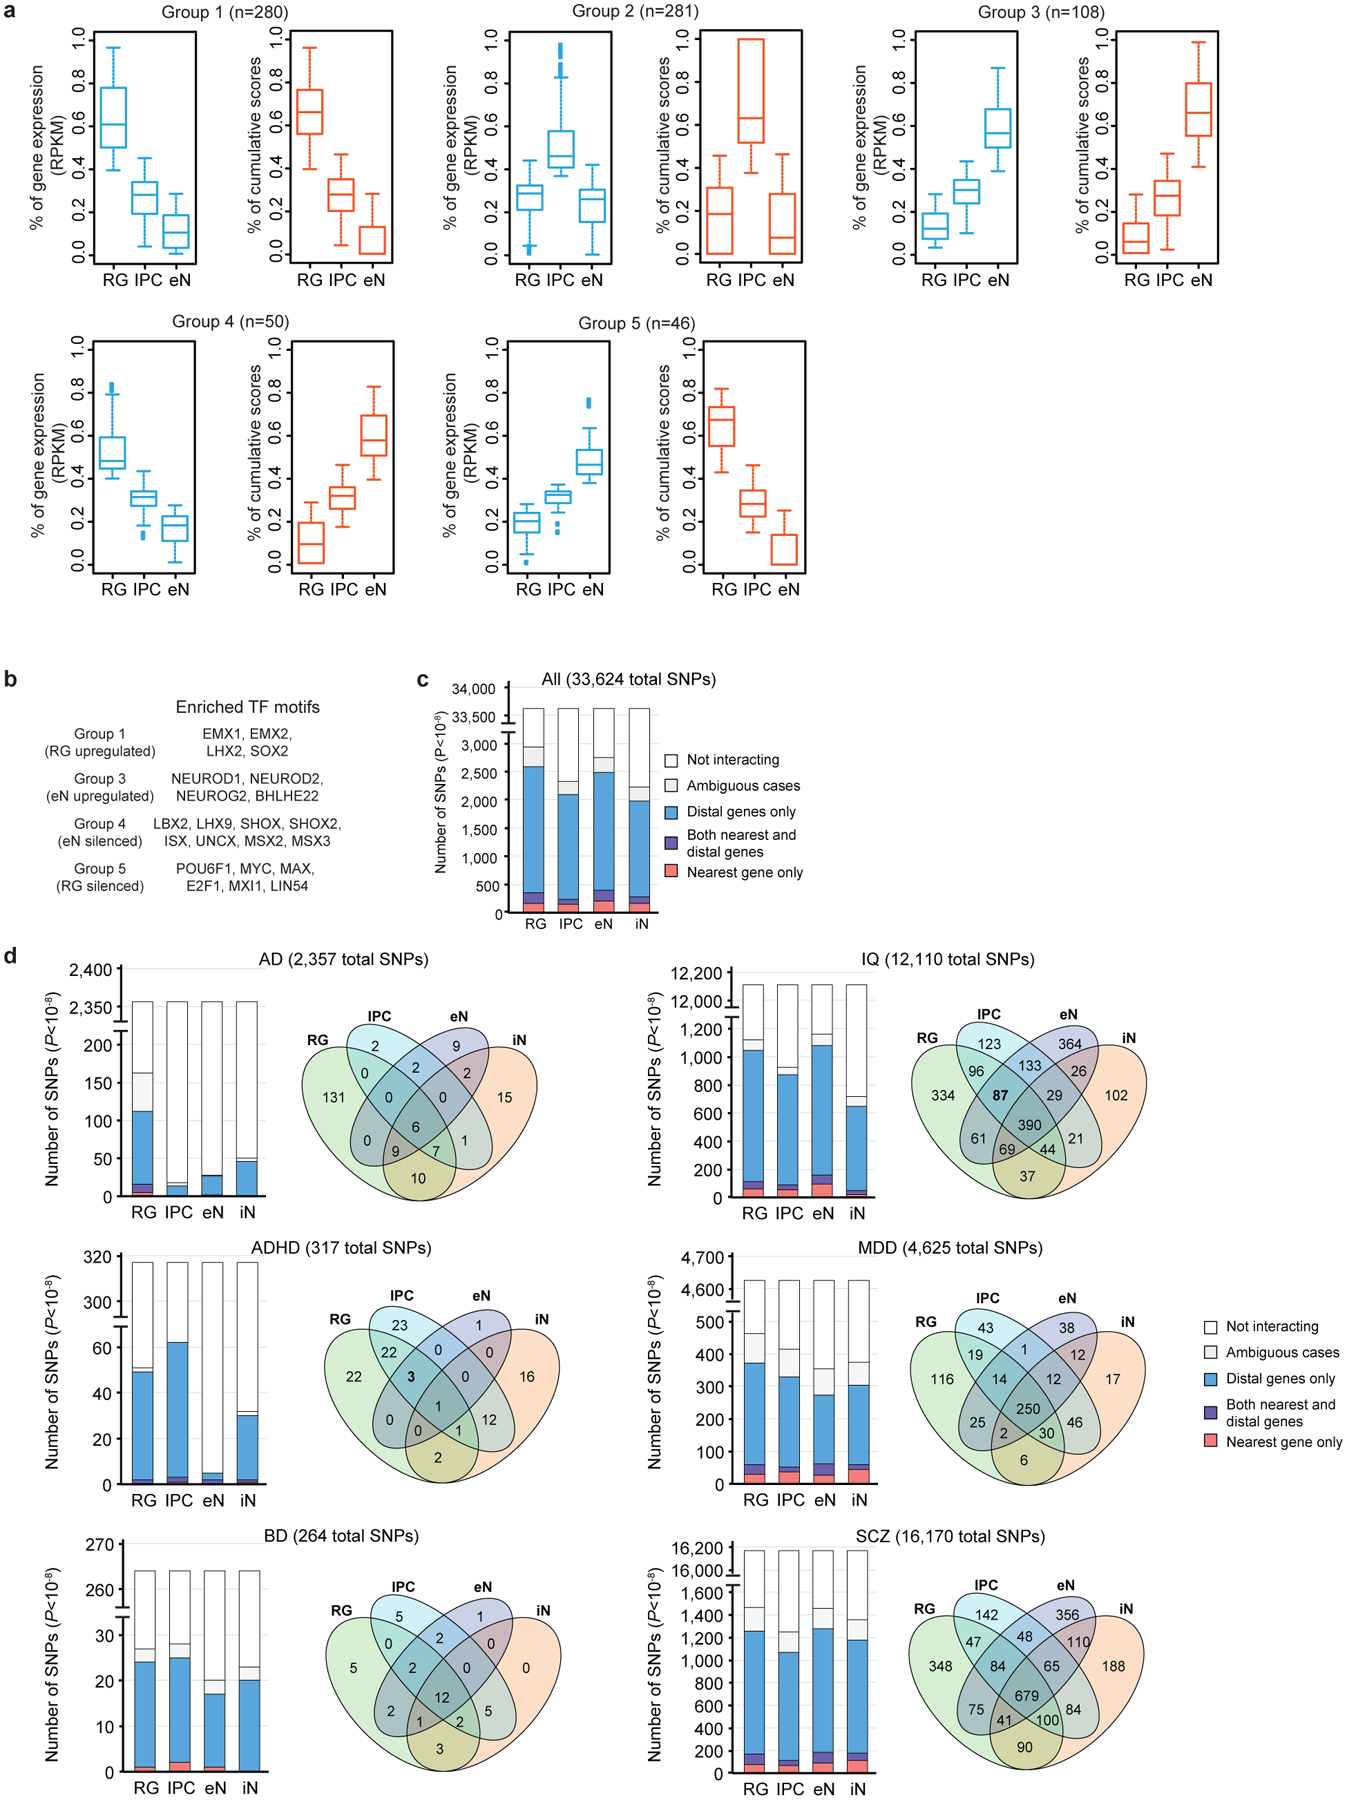
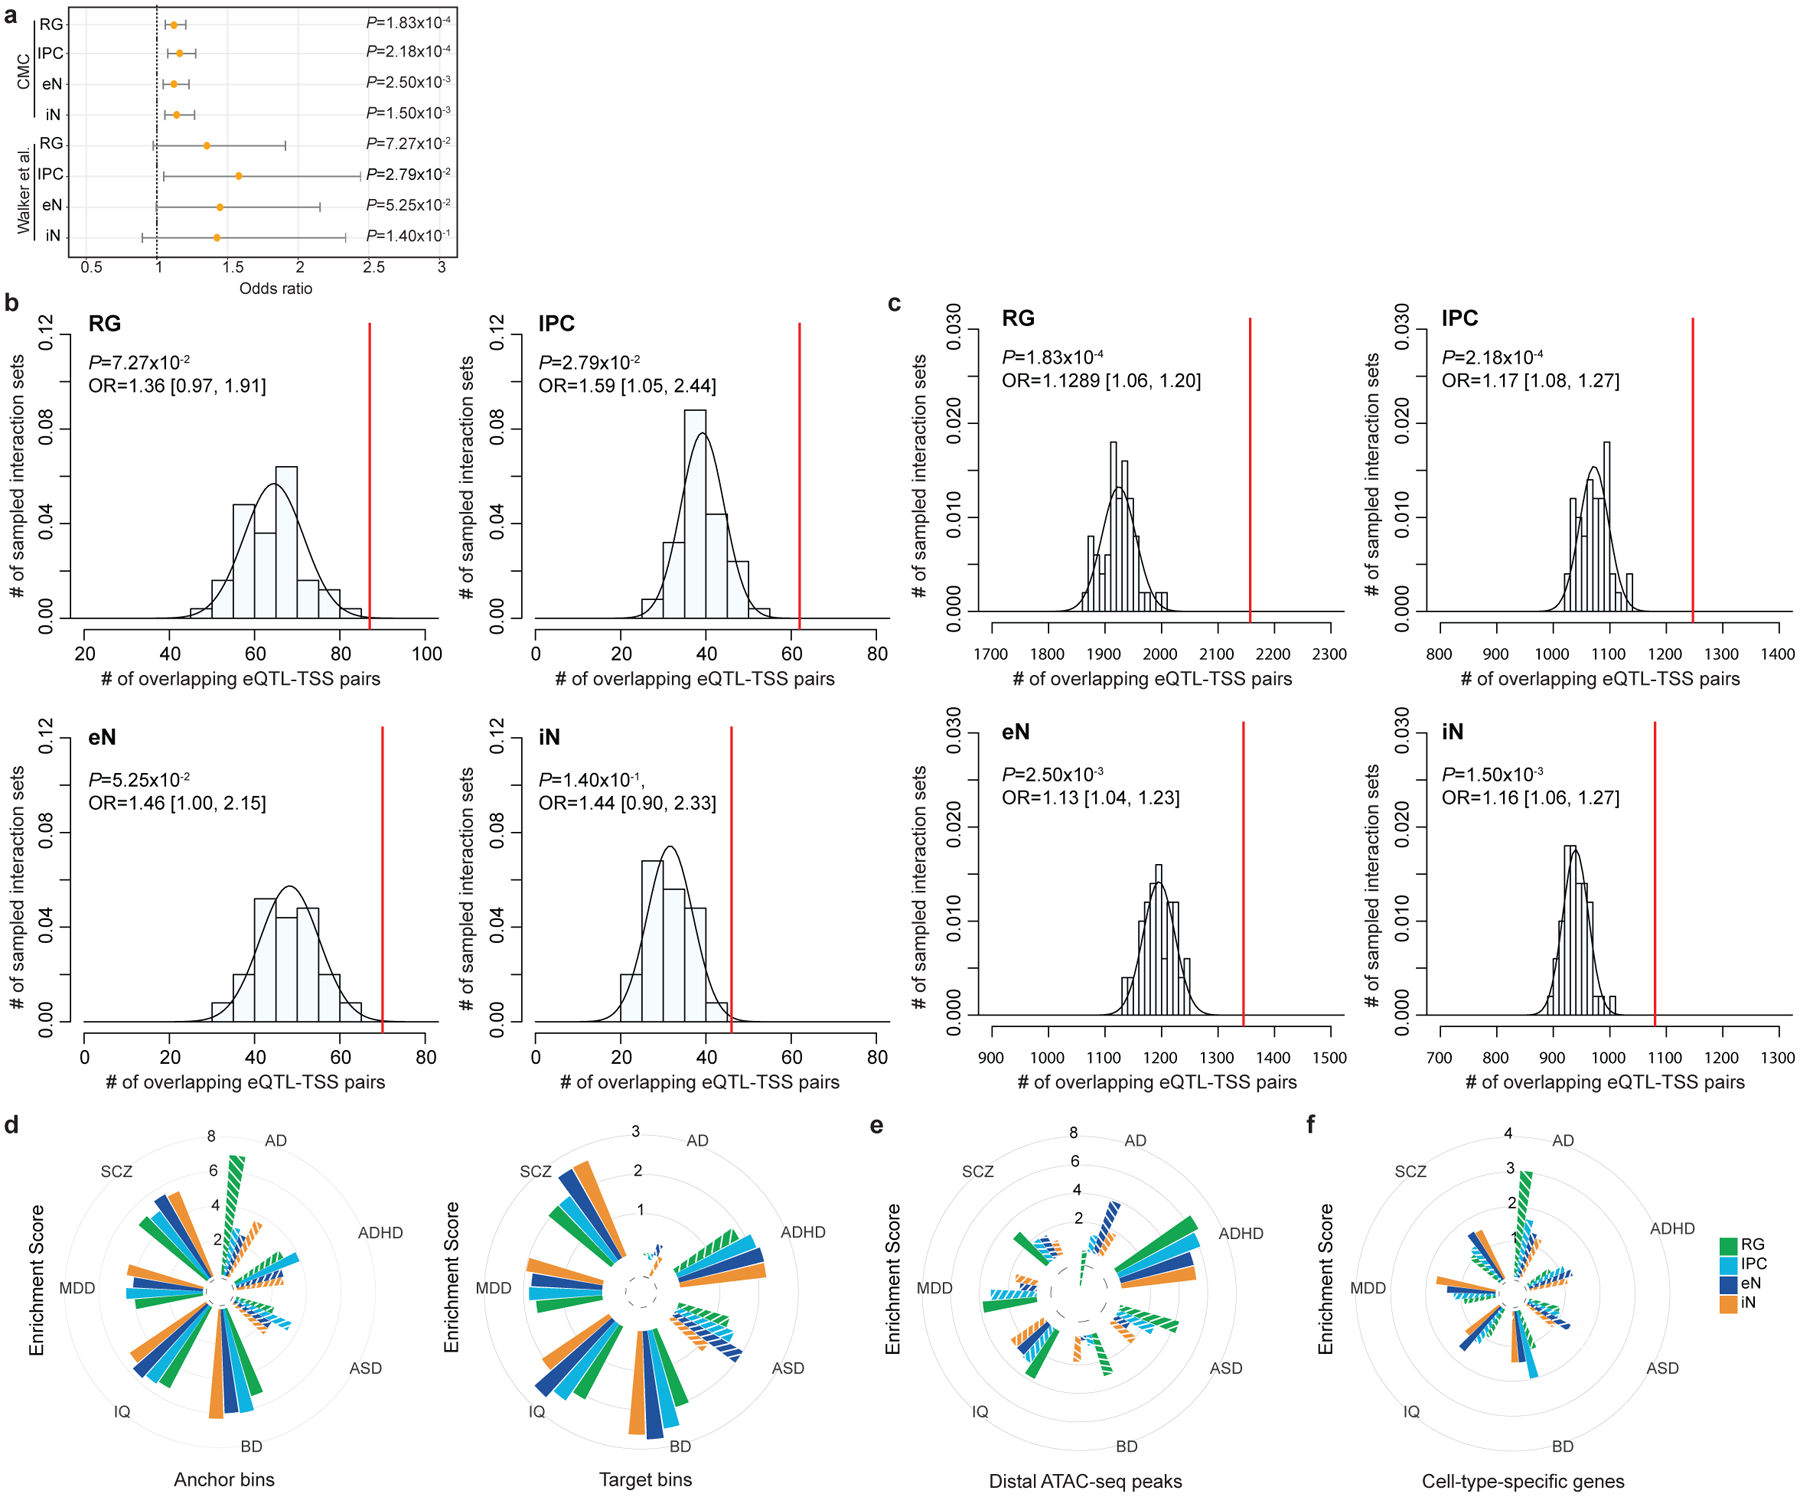
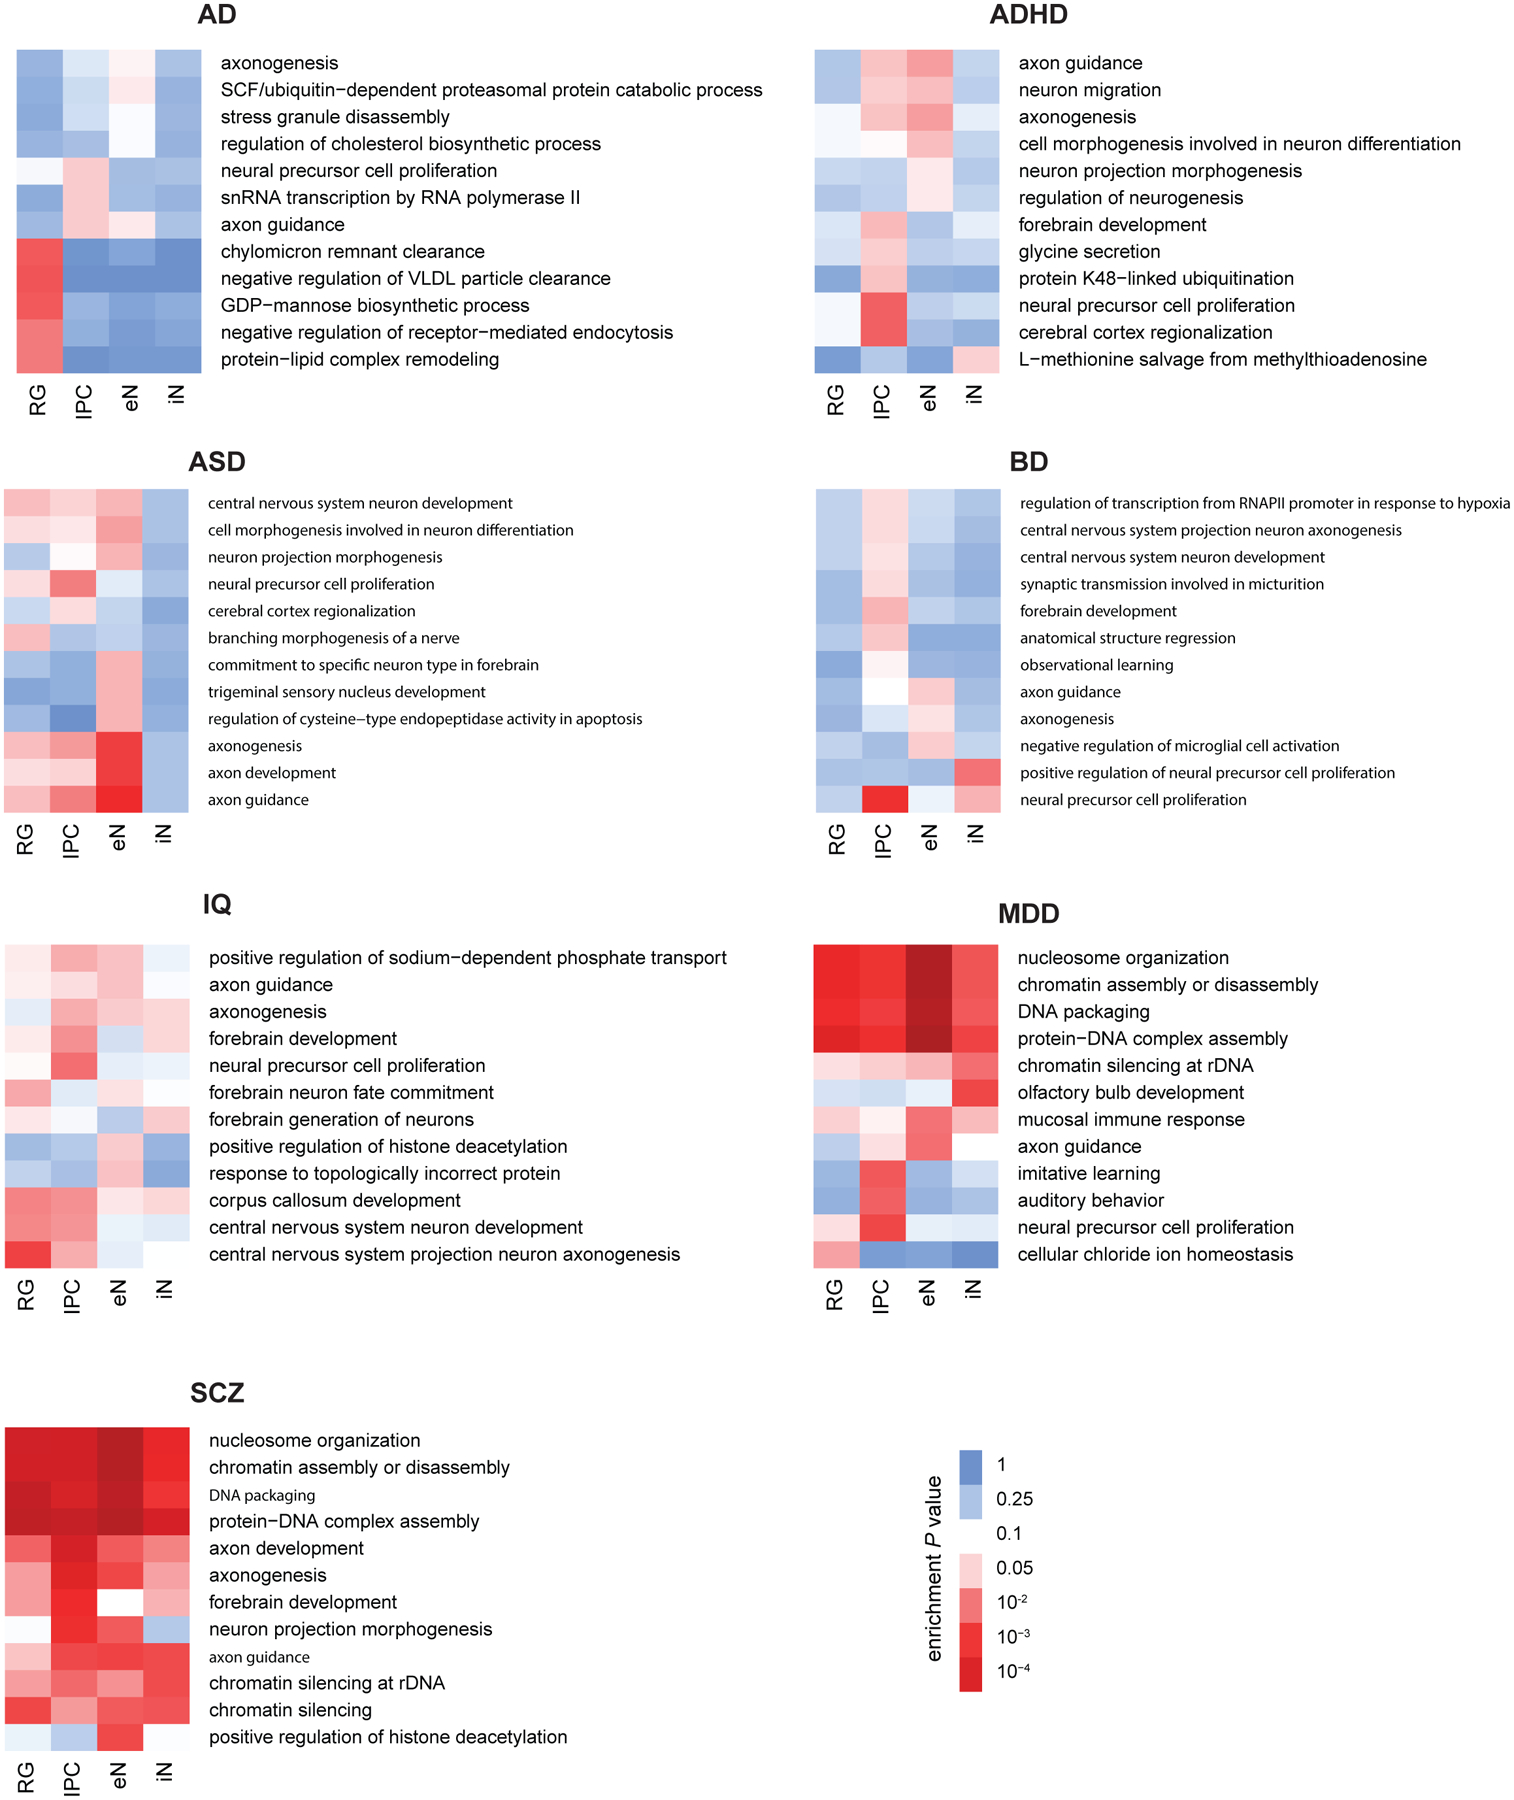
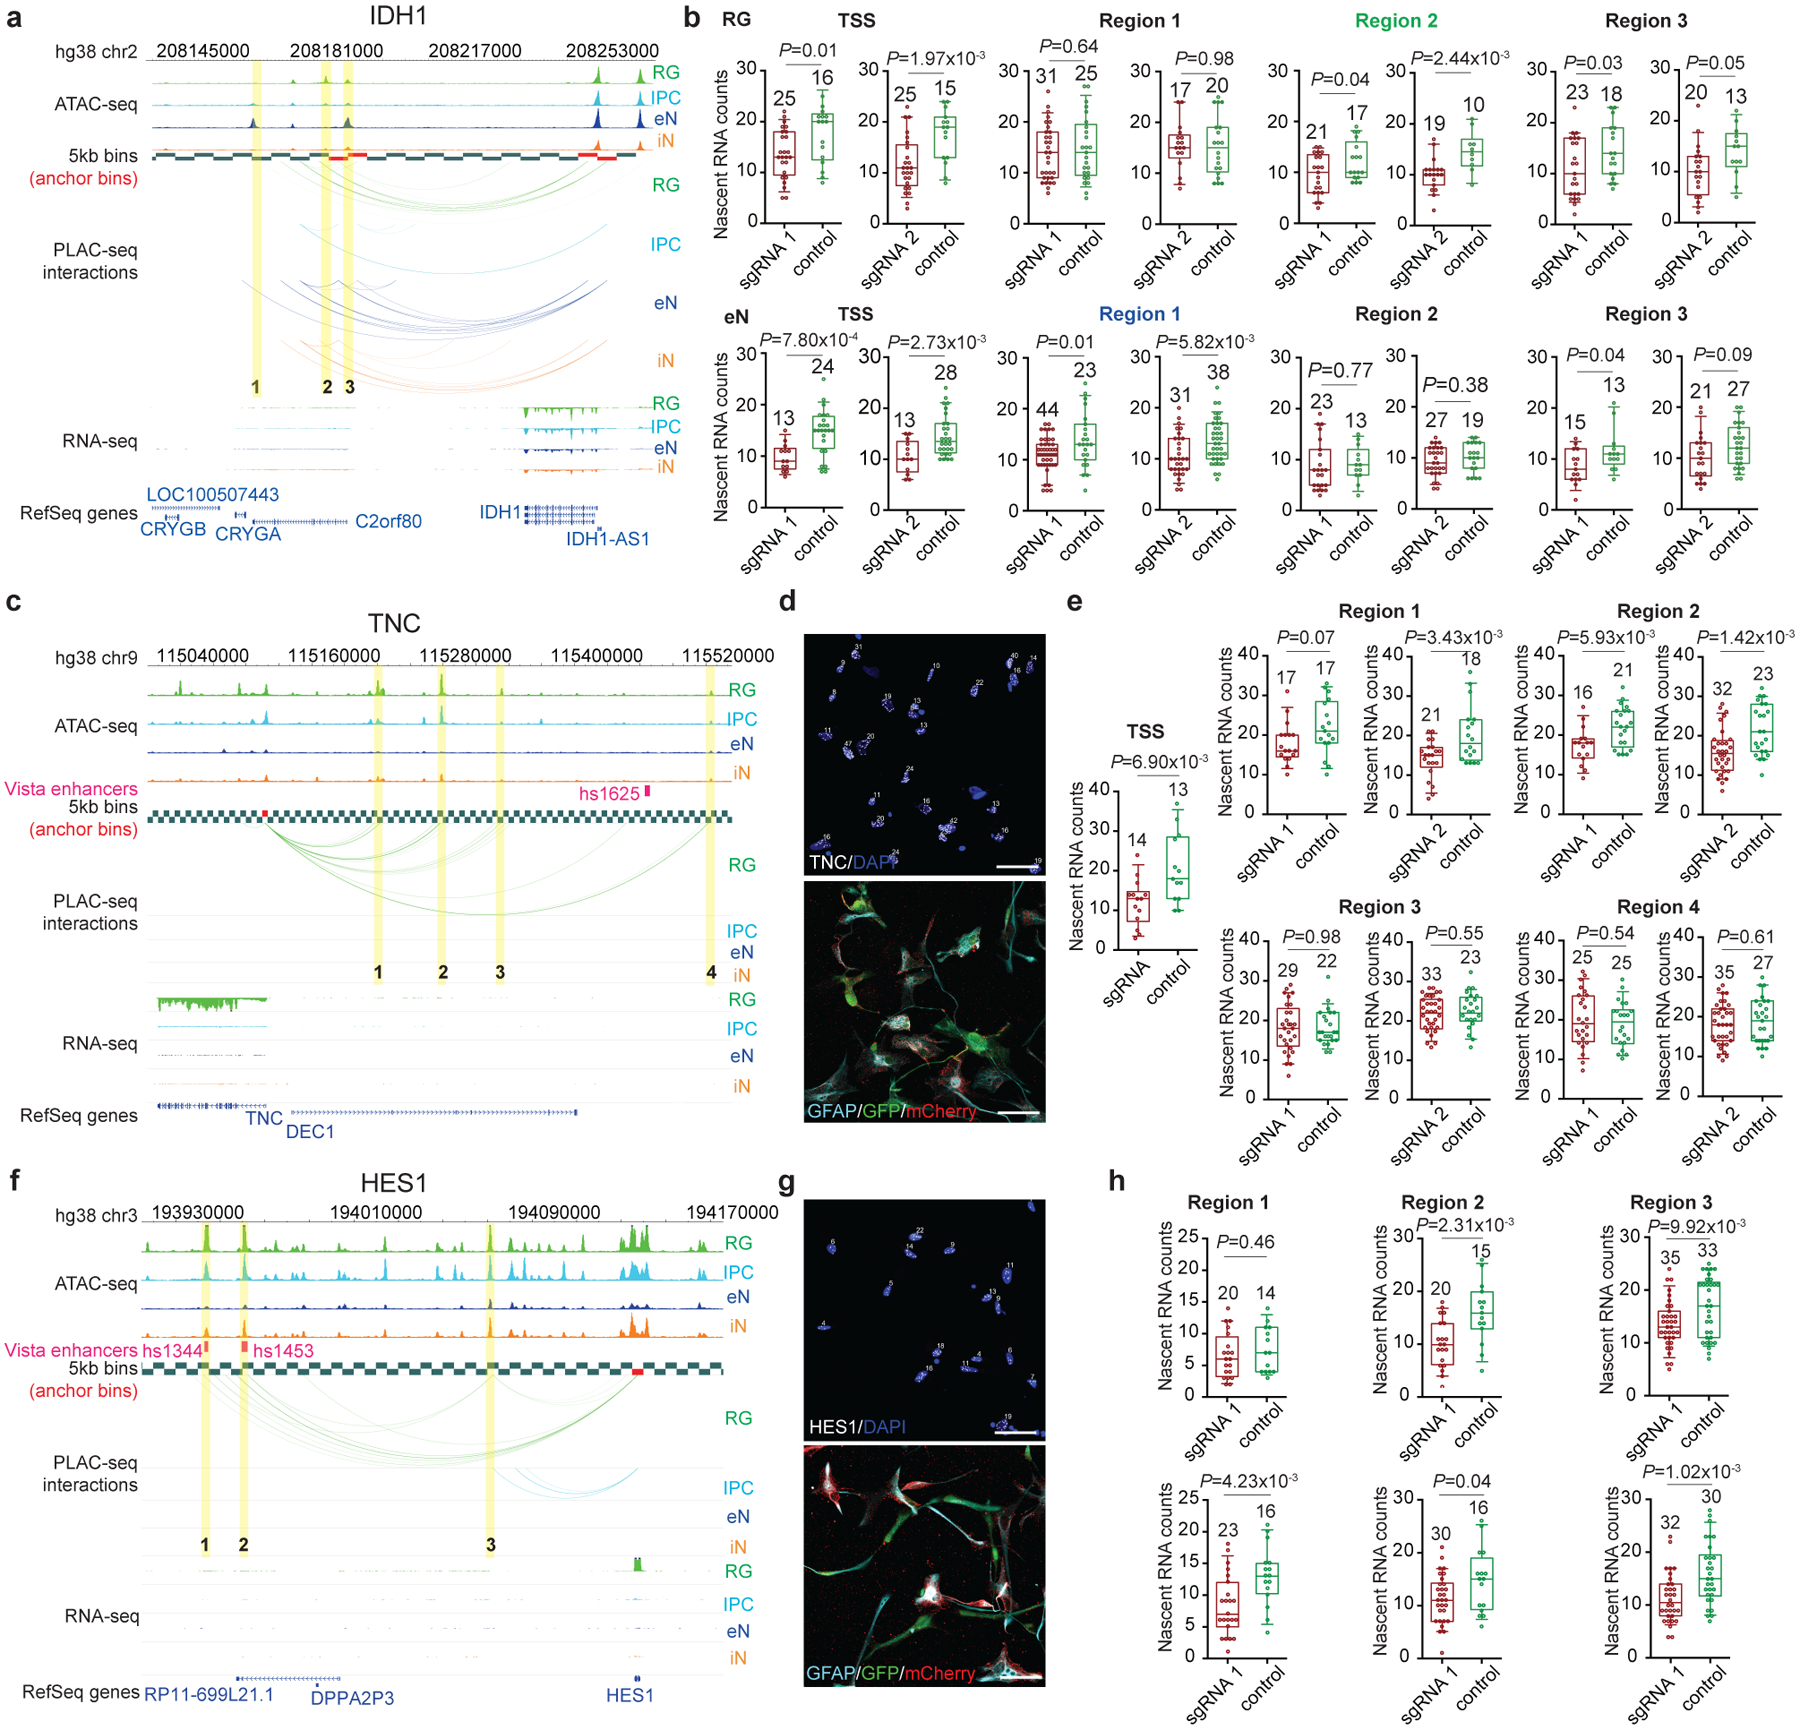
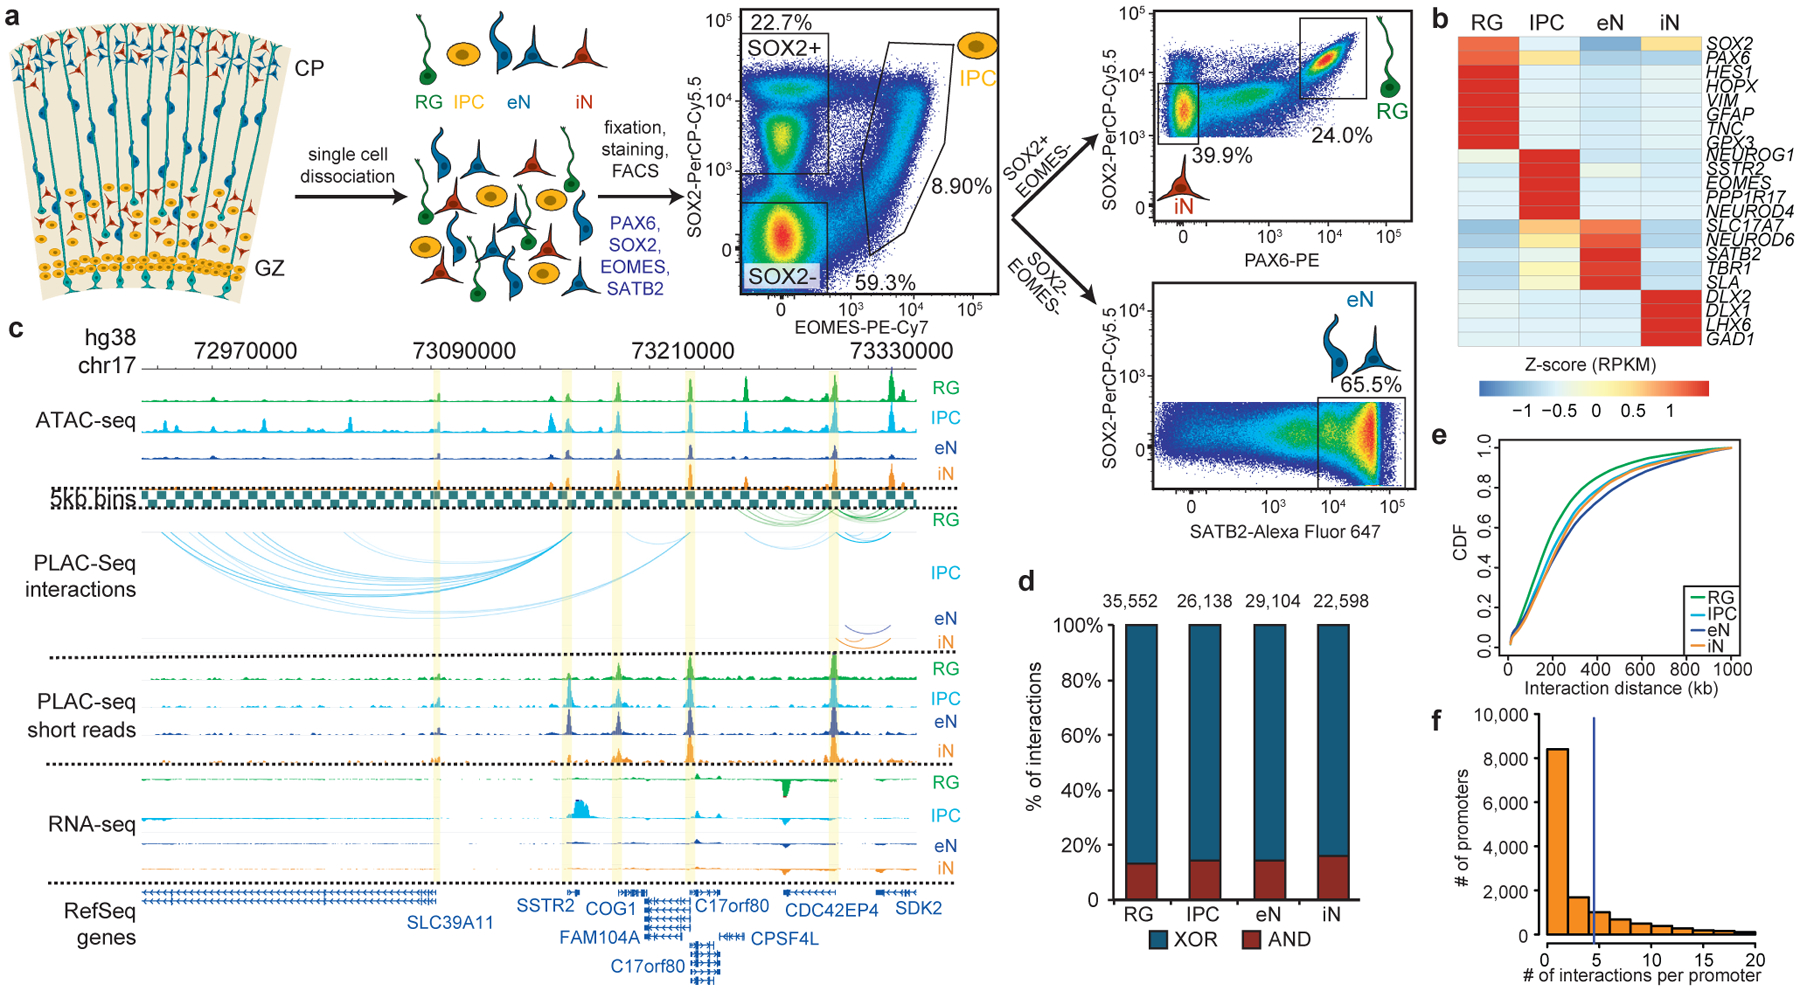
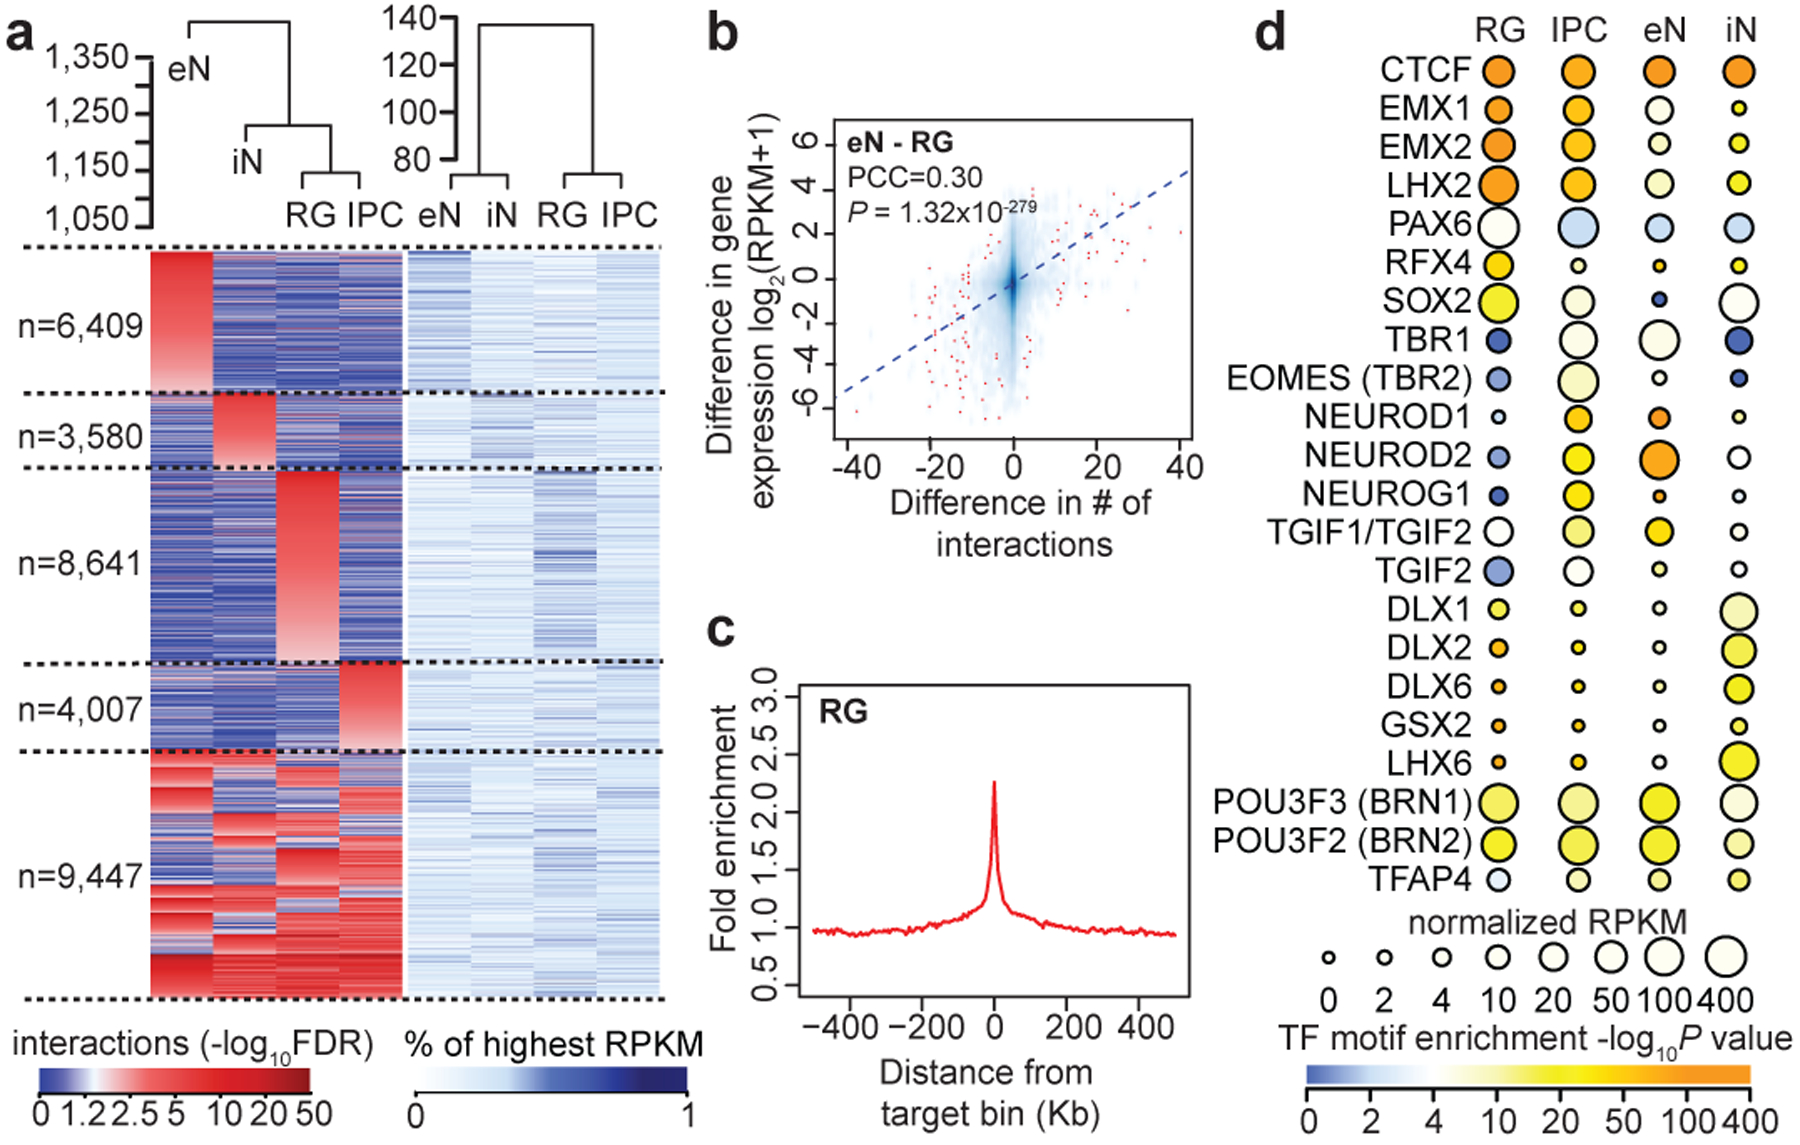
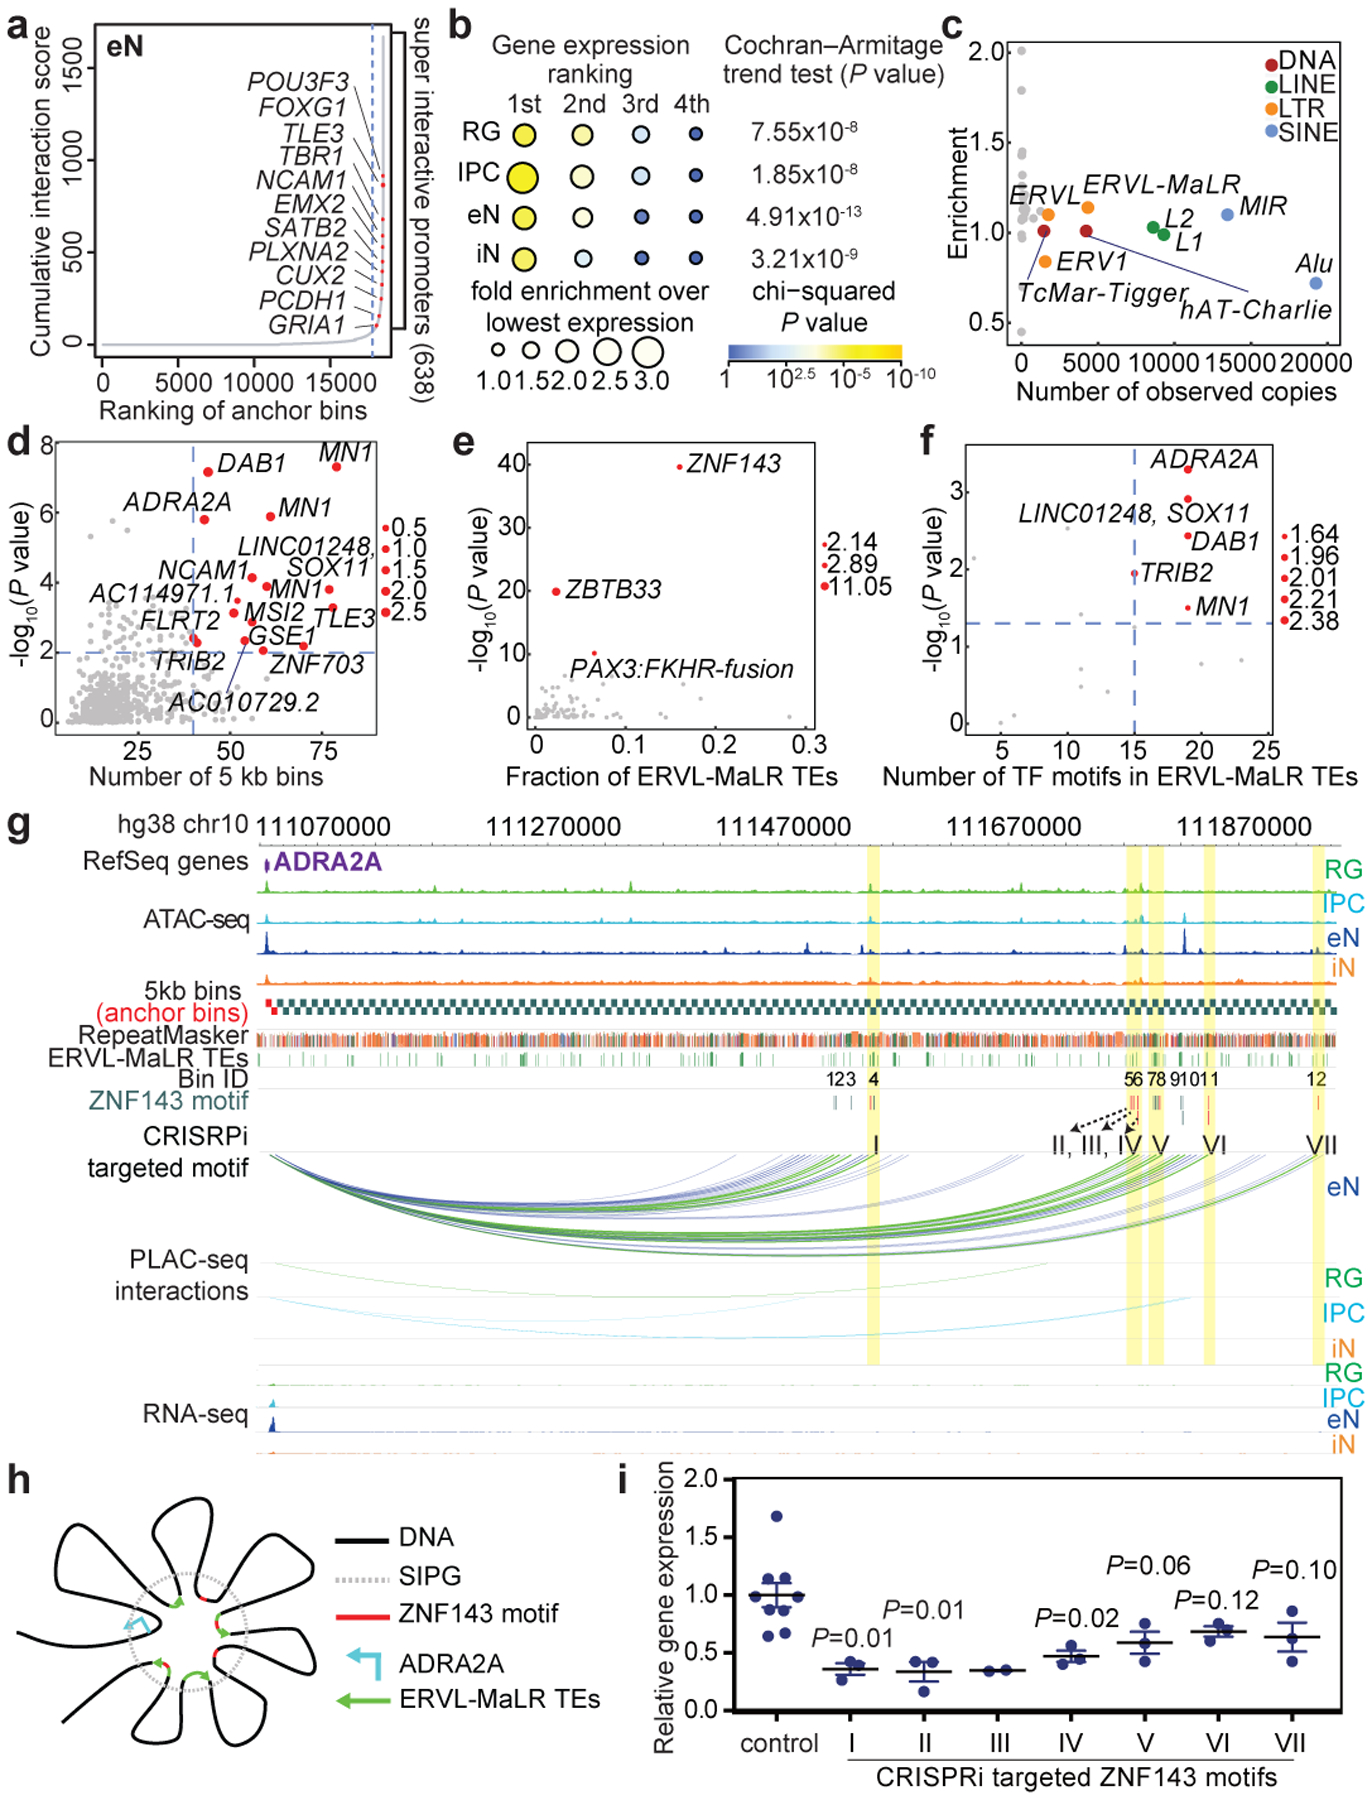
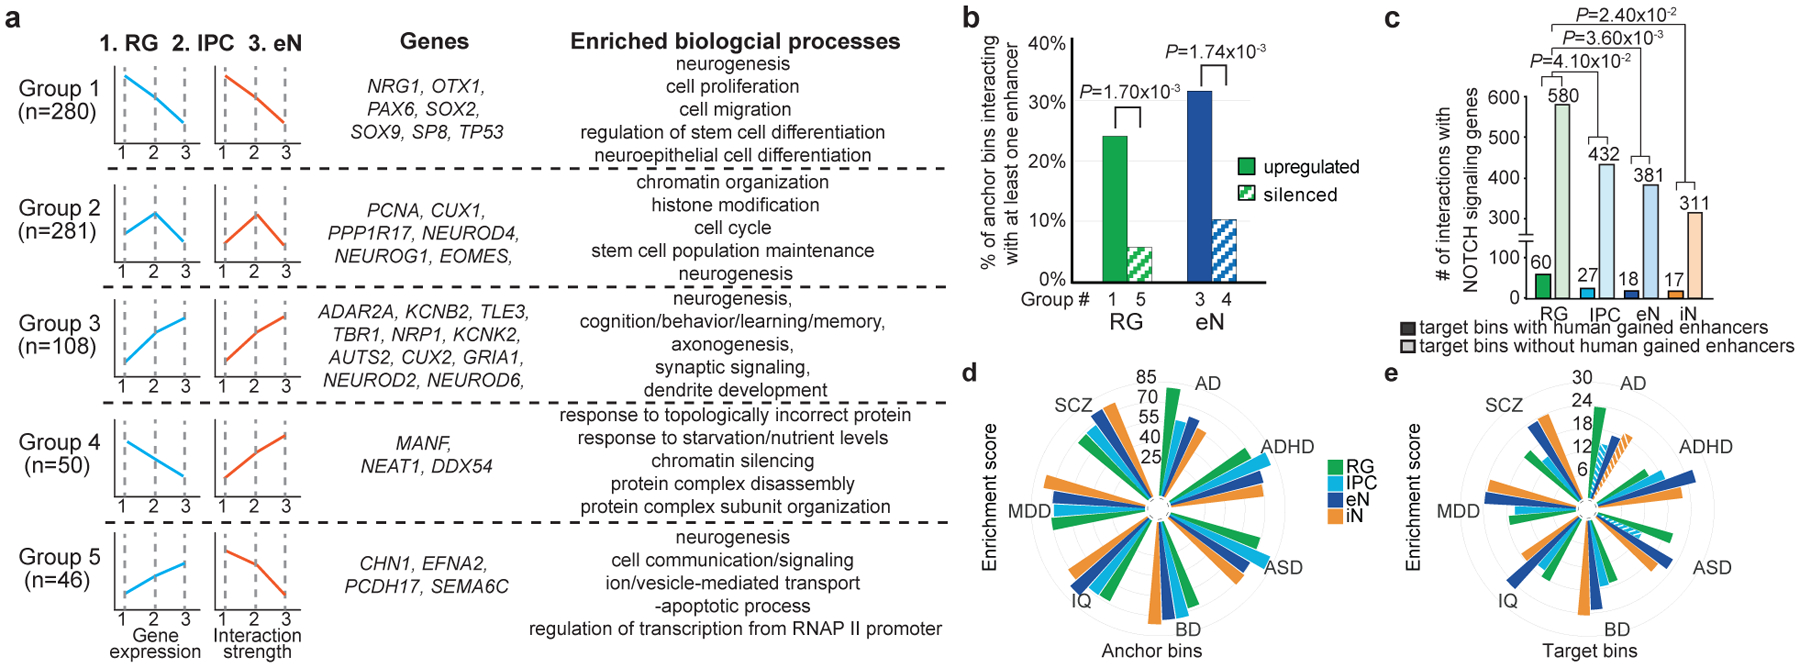
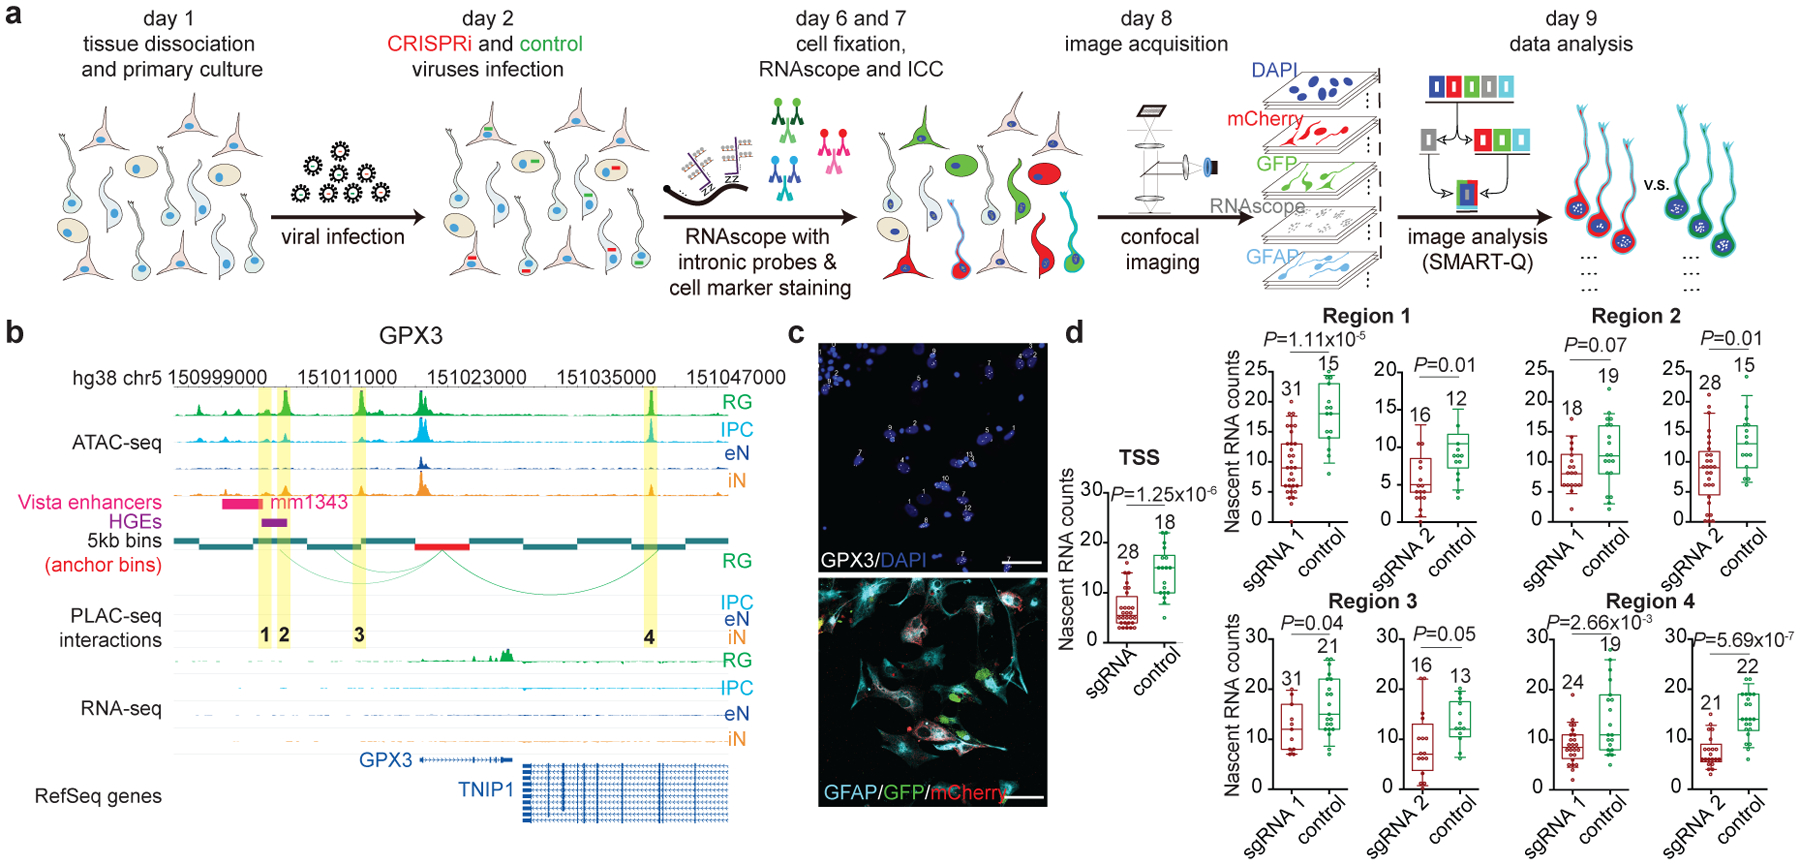
Lineage-specific epigenomic changes during human corticogenesis have been difficult to study owing to challenges with sample availability and tissue heterogeneity. For example, previous studies using single-cell RNA sequencing identified at least 9 major cell types and up to 26 distinct subtypes in the dorsal cortex alone1,2. Here we characterize cell-type-specific cis-regulatory chromatin interactions, open chromatin peaks, and transcriptomes for radial glia, intermediate progenitor cells, excitatory neurons, and interneurons isolated from mid-gestational samples of the human cortex. We show that chromatin interactions underlie several aspects of gene regulation, with transposable elements and disease-associated variants enriched at distal interacting regions in a cell-type-specific manner. In addition, promoters with increased levels of chromatin interactivity-termed super-interactive promoters-are enriched for lineage-specific genes, suggesting that interactions at these loci contribute to the fine-tuning of transcription. Finally, we develop CRISPRview, a technique that integrates immunostaining, CRISPR interference, RNAscope, and image analysis to validate cell-type-specific cis-regulatory elements in heterogeneous populations of primary cells. Our findings provide insights into cell-type-specific gene expression patterns in the developing human cortex and advance our understanding of gene regulation and lineage specification during this crucial developmental window.


Conflict of interest statement

Competing interests statement

The authors declare no competing financial interests.

Figures

Extended Data Figure 1.
Extended Data Figure 1.. Representative contour plots depicting FACS gating strategy.
(a) Cells were separated from debris of various sizes based on the forward scatter area (FSC-A) and side scatter area (SSC-A). Specifically, they were passed through two singlet gates using the width and height metrics of the (b) side scatter (SSC-H versus SSC-W) and (c) forward scatter (FSC-H versus FSC-W). (d) SOX2+, and SOX2-, and intermediate progenitor (IPC) populations were isolated by gating on EOMES-PE-Cy7 and SOX2-PerCP-Cy5.5 staining. (e) Radial glia (RG) and interneurons (iNs) were isolated based on high PAX6/high SOX2 and medium SOX2/low PAX6 staining, respectively. (f) Excitatory neurons (eNs) were isolated from the SOX2- population by gating on SATB2-Alexa Fluor 647 staining.
Extended Data Figure 2.
Extended Data Figure 2.. Reproducibility between RNA-seq, ATAC-seq, and PLAC-seq replicates.
(a) RNA-seq replicates were hierarchically clustered according to gene expression sample distances using DESeq2. (b) Heatmap showing correlations between gene expression profiles for the sorted cell populations and single-cell RNA sequencing (scRNA-seq) data in the developing human cortex. The sorted cell populations exhibited the highest correlation with their corresponding subtypes while exhibiting reduced correlation with the endothelial, mural, microglial, and choroid plexus lineages. (c) Heatmap showing correlations and hierarchical clustering for read densities at open chromatin peaks across all ATAC-seq replicates. (d) Principle component analysis (PCA) was performed based on normalized contact frequencies across all PLAC-seq replicates (see methods). PCA was performed using interacting 5 kb bins in both 300 and 600 kb windows.
Extended Data Figure 3.
Extended Data Figure 3.. Identification of significant H3K4me3-mediated chromatin interactions.
(a) Illustration of XOR and AND interactions in a representative PLAC-seq contact matrix. The blue tracks represent H3K4me3 peaks at anchor bins. Purple cells represent AND interactions where both of the interacting bins are anchor bins. Orange cells represent XOR interactions where only one of the interacting bins is an anchor bin. Grey cells represent NOT interactions where neither of the interacting bins are anchor bins. (b) Venn diagram displaying cell type-specificity for interactions in each cell type. (c) Proportions of interactions occurring within and across TADs in the GZ and CP for matching cell types.
Extended Data Figure 4.
Extended Data Figure 4.. Chromatin interactions influence cell type-specific transcription.
(a) GO enrichment analysis for genes participating in cell type-specific interactions. The top annotation clusters from DAVID are reported along with their group enrichment scores for each cell type (see methods). (b) Scatterplots showing the correlation between the difference in the number of interactions for each promoter and the difference in the expression of the corresponding genes across all cell types (Pearson product-moment correlation coefficient, two-tailed, n = 13,996 anchor bins with promoters). The trendline from linear regression is shown. (c) Fold enrichment of open chromatin peaks over distance-matched background regions in 1 Mb windows around distal interacting regions for IPCs, eNs, and iNs.
Extended Data Figure 5.
Extended Data Figure 5.. Super interactive promoters are enriched for lineage-specific genes.
(a) Scatterplots showing the correlation between interaction counts and gene expression at promoters for each cell type (Pearson product-moment correlation coefficient, two-tailed, n = 13,996 anchor bins with promoters). (b) CDF plots of the numbers of interactions for shared versus cell type-specific genes for each cell type (two-sample t-test, two-tailed). (c) Anchor bins were ranked according to their cumulative interaction scores in RG, IPCs, and iNs. Super interactive promoters (SIPs) are located past the point in each curve where the slope is equal to 1. (d) Venn diagram displaying cell type-specificity for SIPs in each cell type. (e-f) Enrichment of super-enhancers and DMVs at SIPs versus non-SIPs (left) and distal interacting regions for SIPs versus non-SIPs (right) (Fisher’s exact test, two-tailed). Super-enhancers were based on data in the fetal brain and adult cortex, while DMVs were based on data in 40 and 60 day cerebral organoids with closely matched gene expression profiles to mid-fetal cortex samples. (g) Forrest plot showing that SIPs identified in hematopoietic cells are analogously enriched for cell type-specific over shared genes. Odds ratios and 95% confidence intervals are shown. We identified 554, 709, 460, 712, and 401 SIPs in neutrophils, naive CD4+ T cells, monocytes, megakaryocytes, and erythroblasts, respectively.
Extended Data Figure 6.
Extended Data Figure 6.. Transposable elements in SIP formation.
(a-c) Enrichment of TEs at the class (a), family (b), and subfamily (c) levels in SIPGs for each cell type. Only TE families occupying more than 1% of the genome are shown in (b). Only TE subfamilies from the MIR and ERVL-MaLR TE families occupying more than 0.1% of the genome are shown in (c). (d) Both ERVL-MaLR TEs (left, 32% versus 19% of sequences, P < 2.2*10−16, binomial test, two-tailed) and THE1C TEs (right, 73% versus 19% of sequences, P < 2.2*10−16, binomial test, two-tailed) are enriched over background sequences for ZNF143 motifs in eNs. (e) ZNF143 motifs are enriched at SIPGs in eNs (left, P = 5.39×10−82, two-sample t-test, two-tailed, n = 8,894 distal interacting regions). Means are indicated and error bars represent the SEM. Distributions comparing the number of ZNF143 motifs per bin for actual versus shuffled SIPGs are shown (right, P < 2.2*10−16, Kolmogorov-Smirnov test, two-tailed, n = 638 SIPGs). (f) ERVL-MaLR TEs in SIPGs are enriched over background sequences for ZNF143 motifs in eNs (31% versus 17% of sequences, P = 4.3×10−98, binomial test, two-tailed). (g) Box plots showing elevated ADRA2A gene expression in eNs. The median, upper and lower quartiles, minimum, and maximum are indicated. (h) Illustration of the 12 distal interacting regions containing ERVL-MaLR TE-localized ZNF143 motifs in the ADRA2A SIPG. ZNF143 motifs are colored by strand. The bin numbers correspond to Fig. 3j. (i) Conservation of ERVL-MaLR TEs in the ADRA2A SIPG. Blue bars indicate consensus sequences, yellow bars indicate ERVL-MaLR TEs, and red bars indicate ZNF143 motifs. (j) Alignment of THE1C TEs in the human genome to their consensus sequence. The THE1C subfamily contains two ZNF143 motifs, one at positions 47–61 (P1), and another at positions 96–110 (P2).
Extended Data Figure 7.
Extended Data Figure 7.. Developmental trajectories and mapping complex disorder- and trait-associated variants to their target genes.
(a) Box plots showing the distributions of gene expression and cumulative interaction scores for the groups identified in Fig. 4a. The median, upper and lower quartiles, minimum, and maximum are indicated. (b) Groups 4 and 5 are enriched for interactions with TFs containing domains associated with transcriptional repression. (c-d) Counts of the numbers of GWAS SNPs (P < 10−8) interacting with their nearest gene only, with both their nearest and more distal genes, and with more distal genes only across all diseases (c) and specific disorders and traits (d).
Extended Data Figure 8.
Extended Data Figure 8.. Partitioning SNP heritability for complex disorders and traits using alternative epigenomic annotations.
(a) Forrest plot showing the enrichment of fetal and adult brain eQTL-TSS pairs in our interactions compared to n = 50 sets of distance-matched control interactions (Fisher’s exact test, two-tailed). Odds ratios and 95% confidence intervals are shown. The increased significance of adult brain eQTLs can be attributed to the larger sample size of the CommonMind Consortium (CMC) study (n = 1,332,863), while larger odds ratios were observed for the more closely matched fetal brain eQTLs (n = 6,446). (b-c) Histograms displaying the numbers of adult and fetal brain eQTL-TSS pairs recapitulated by n = 50 sets of distance-matched control interactions in each cell type. The numbers of Eqtl-TSS pairs recapitulated by our interactions are indicated by red lines (Fisher’s exact test, two-tailed). (d) LDSC enrichment scores for each disease and cell type, conditioned on the baseline model from Gazal et al. 2017 and stratified by PLAC-seq anchor and target bins. Non-significant enrichment scores are shown as striped bars. (e-f) LDSC enrichment scores for each disease and cell type, conditioned on the baseline model from Gazal et al. 2017 and using either distal open chromatin peaks (e) or cell type-specific genes (f). Non-significant enrichment scores are shown as striped bars.
Extended Data Figure 9.
Extended Data Figure 9.. Enriched biological processes for genes interacting with non-coding variants for each disease and cell type.
GO enrichment analysis for genes interacting with non-coding variants for each disease and cell type using H-MAGMA and gProfileR (Fisher’s exact test, two-tailed, BH method). The full results can be found in Supplementary Table 12.
Extended Data Figure 10.
Extended Data Figure 10.. Characterization of RG- and eN-specific loci using CRISPRview.
(a-b) Validation of distal interacting regions at the IDH1 locus in RG and eNs. Silencing region 1, which interacts with the IDH1 promoter only in eNs, results in the significant downregulation of IDH1 expression in eNs but not in RG. Silencing region 2, which interacts with the IDH1 promoter only in RG, results in the significant downregulation of IDH1 expression in RG but not in eNs. Silencing region 3, which interacts with the IDH1 promoter in both RG and eNs, results in the significant downregulation of IDH1 expression in both cell types. Interactions between the promoter of IDH1 and distal interacting regions containing open chromatin peaks that were targeted for silencing are highlighted. Box plots show results for experimental (red) and control (green) sgRNA-treated cells for each region (two-sample t-test, two-tailed). The median, upper and lower quartiles, and 10% to 90% range are indicated. Open circles represent single cells. Sample sizes are indicated above each box plot. (c-h) Validation of distal interacting regions at the TNC and HES1 loci in RG. Interactions between the promoters of TNC and HES1 and distal interacting regions containing open chromatin peaks that were targeted for silencing are highlighted. Representative images show staining for intronic RNAscope probes (white), DAPI (blue), GFAP (light blue), GFP (green), and mCherry (red). The scale bar is 50 μm.
Figure 1.
Figure 1.. Experimental design and features of 3D epigenomes during human corticogenesis.
(a) Schematic of the sorting strategy. Microdissected GZ and CP samples were dissociated into single cells prior to being fixed, stained with antibodies for PAX6, SOX2, EOMES, and SATB2, and sorted using FACS. (b) Heatmap displaying the expression of key marker genes for each cell type. (c) WashU Epigenome Browser snapshot displaying a region (chr17: 72,970,000–73,330,000) with interactions linked to SSTR2 expression in IPCs. (d) Bar graph of interaction counts for each cell type, with the proportions of anchor to anchor (red) and anchor to non-anchor (blue) interactions highlighted. (e) Cumulative distribution function (CDF) plots of interaction distances for each cell type. (f) Histogram displaying the numbers of interactions for interacting promoters across all cell types.
Figure 2.
Figure 2.. H3K4me3-mediated chromatin interactions influence cell type-specific transcription.
(a) Heatmaps showing interaction strengths (left) and gene expression (right) for anchor to non-anchor interactions grouped according to their cell type specificity. Interaction strengths are based on the −log10FDR from the MAPS pipeline. (b) Scatterplot showing the correlation between the difference in the number of interactions for each promoter and the difference in the expression of the corresponding genes for RG and eNs (Pearson product-moment correlation coefficient, two-tailed, P = 1.32*10−279, n = 13,996 anchor bins with promoters). The trendline from linear regression is shown. (c) Fold enrichment of open chromatin peaks over distance-matched background regions in 1 Mb windows around distal interacting regions for RG. (d) TF motif enrichment analysis for open chromatin peaks at cell type-specific distal interacting regions in each cell type. We analyzed 4,203, 1,412, 3,088, and 949 regions in RG, IPCs, eNs, and iNs, respectively. Colors represent enrichment scores based on the p-value from HOMER, while sizes represent the gene expression of the corresponding TFs.
Figure 3.
Figure 3.. Super interactive promoters are enriched for lineage-specific genes.
(a) Anchor bins were ranked according to their cumulative interaction scores in eNs. Super interactive promoters (SIPs) are located past the point in each curve where the slope is equal to 1. (b) The number of SIPs was divided by the total number of anchor bins (both SIPs and non-SIPs) associated with genes with the 1st, 2nd, 3rd, and 4th highest expression among all four cell types (n = 13,996 anchor bins with promoters). Fold enrichment was calculated relative to the group with the lowest expression among all four cell types. (c) Scatterplot showing the enrichment and numbers of observed copies for TE families in SIPGs for eNs. TE families occupying more than 1% of the genome are colored. (d) Scatterplot showing the enrichment and numbers of distal interacting regions for ERVL-MaLR TEs in SIPGs for eNs (n = 638 SIPGs). The 16 SIPGs with significant enrichment (hypergeometric test, one-tailed, P < 0.01) and 40 or more distal interacting regions are highlighted. (e) Scatterplot showing the enrichment of TF motifs in ERVL-MaLR TEs for the 16 SIPGs highlighted in (d). Enrichment P values are from HOMER. (f) Scatterplot showing the enrichment of ZNF143 motifs in ERVL-MaLR TEs for the 16 SIPGs highlighted in (d) (Poisson distribution, see methods). (g) Interactions between the ADRA2A promoter and 12 distal interacting regions containing ERVL-MaLR TE-localized ZNF143 motifs. (h) Proposed mechanism for the contribution of TEs to SIP formation. (i) ADRA2A expression was significantly downregulated for 3 of 7 regions relative to control sgRNAs (two-sample t-test, two-tailed, P < 0.05, n = 3 for all regions except region III, which has n = 2). Means are indicated and error bars represent the SEM.
Figure 4.
Figure 4.. Features of cortical development and partitioning SNP heritability for complex disorders and traits.
(a) Genes categorized based on their gene expression and chromatin interactivity from RG to eNs. Groups 1–5 represent RG-upregulated, IPC-upregulated, eN-upregulated, eN-silenced, and RG-silenced genes, respectively. Representative genes and biological processes are shown for each group. (b) Groups 1 (75 of 312 bins) and 3 (40 of 127 bins) are enriched for interactions with enhancers relative to groups 4 (6 of 58 bins) and 5 (3 of 52 bins) (chi-squared test, two-tailed). Only bins with at least one interaction were considered. (c) Bar graph of interaction counts from Notch signaling genes to regions with and without HGEs in each cell type (chi-squared test, two-tailed). We observed 2,541, 1,854, 1,869, and 1,610 interactions with HGEs in RG, IPCs, eNs, and iNs, respectively. (d–e) LDSC enrichment scores for each disease and cell type, stratified by PLAC-seq anchor and target bins. Non-significant enrichment scores are shown as striped bars.
Figure 5.
Figure 5.. Validation of cell type-specific distal regulatory elements using CRISPRview.
(a) Schematic of the CRISPRview workflow. Image analysis was performed using the SMART-Q pipeline. (b) Interactions between the GPX3 promoter and distal interacting regions containing open chromatin peaks that were targeted for silencing are highlighted. Notably, region 1 overlaps both an HGE and Vista enhancer element (mm1343), supporting its function as a putative enhancer. (c) Representative images show staining for intronic RNAscope probes (white), DAPI (blue), GFAP (light blue), GFP (green), and mCherry (red). The scale bar is 50 μm. (d) Box plots show results for experimental (red) and control (green) sgRNA-treated cells for each region (two-sample t-test, two-tailed). The median, upper and lower quartiles, and 10% to 90% range are indicated. Open circles represent single cells. Sample sizes are indicated above each box plot.

References

    1. Nowakowski TJ et al. Spatiotemporal gene expression trajectories reveal developmental hierarchies of the human cortex. Science 358, 1318–1323, doi:10.1126/science.aap8809 (2017). - DOI - PMC - PubMed
    1. Zhong S et al. A single-cell RNA-seq survey of the developmental landscape of the human prefrontal cortex. Nature 555, 524–528, doi:10.1038/nature25980 (2018). - DOI - PubMed
    1. Hansen DV, Lui JH, Parker PR & Kriegstein AR Neurogenic radial glia in the outer subventricular zone of human neocortex. Nature 464, 554–561, doi:10.1038/nature08845 (2010). - DOI - PubMed
    1. Pontious A, Kowalczyk T, Englund C & Hevner RF Role of intermediate progenitor cells in cerebral cortex development. Dev Neurosci 30, 24–32, doi:10.1159/000109848 (2008). - DOI - PubMed
    1. Anderson S, Mione M, Yun K & Rubenstein JL Differential origins of neocortical projection and local circuit neurons: role of Dlx genes in neocortical interneuronogenesis. Cereb Cortex 9, 646–654, doi:10.1093/cercor/9.6.646 (1999). - DOI - PubMed

Publication types

MeSH terms