
Inherited myeloproliferative neoplasm risk affects haematopoietic stem cells

Erik L Bao et al. Nature. 2020 Oct.

Abstract

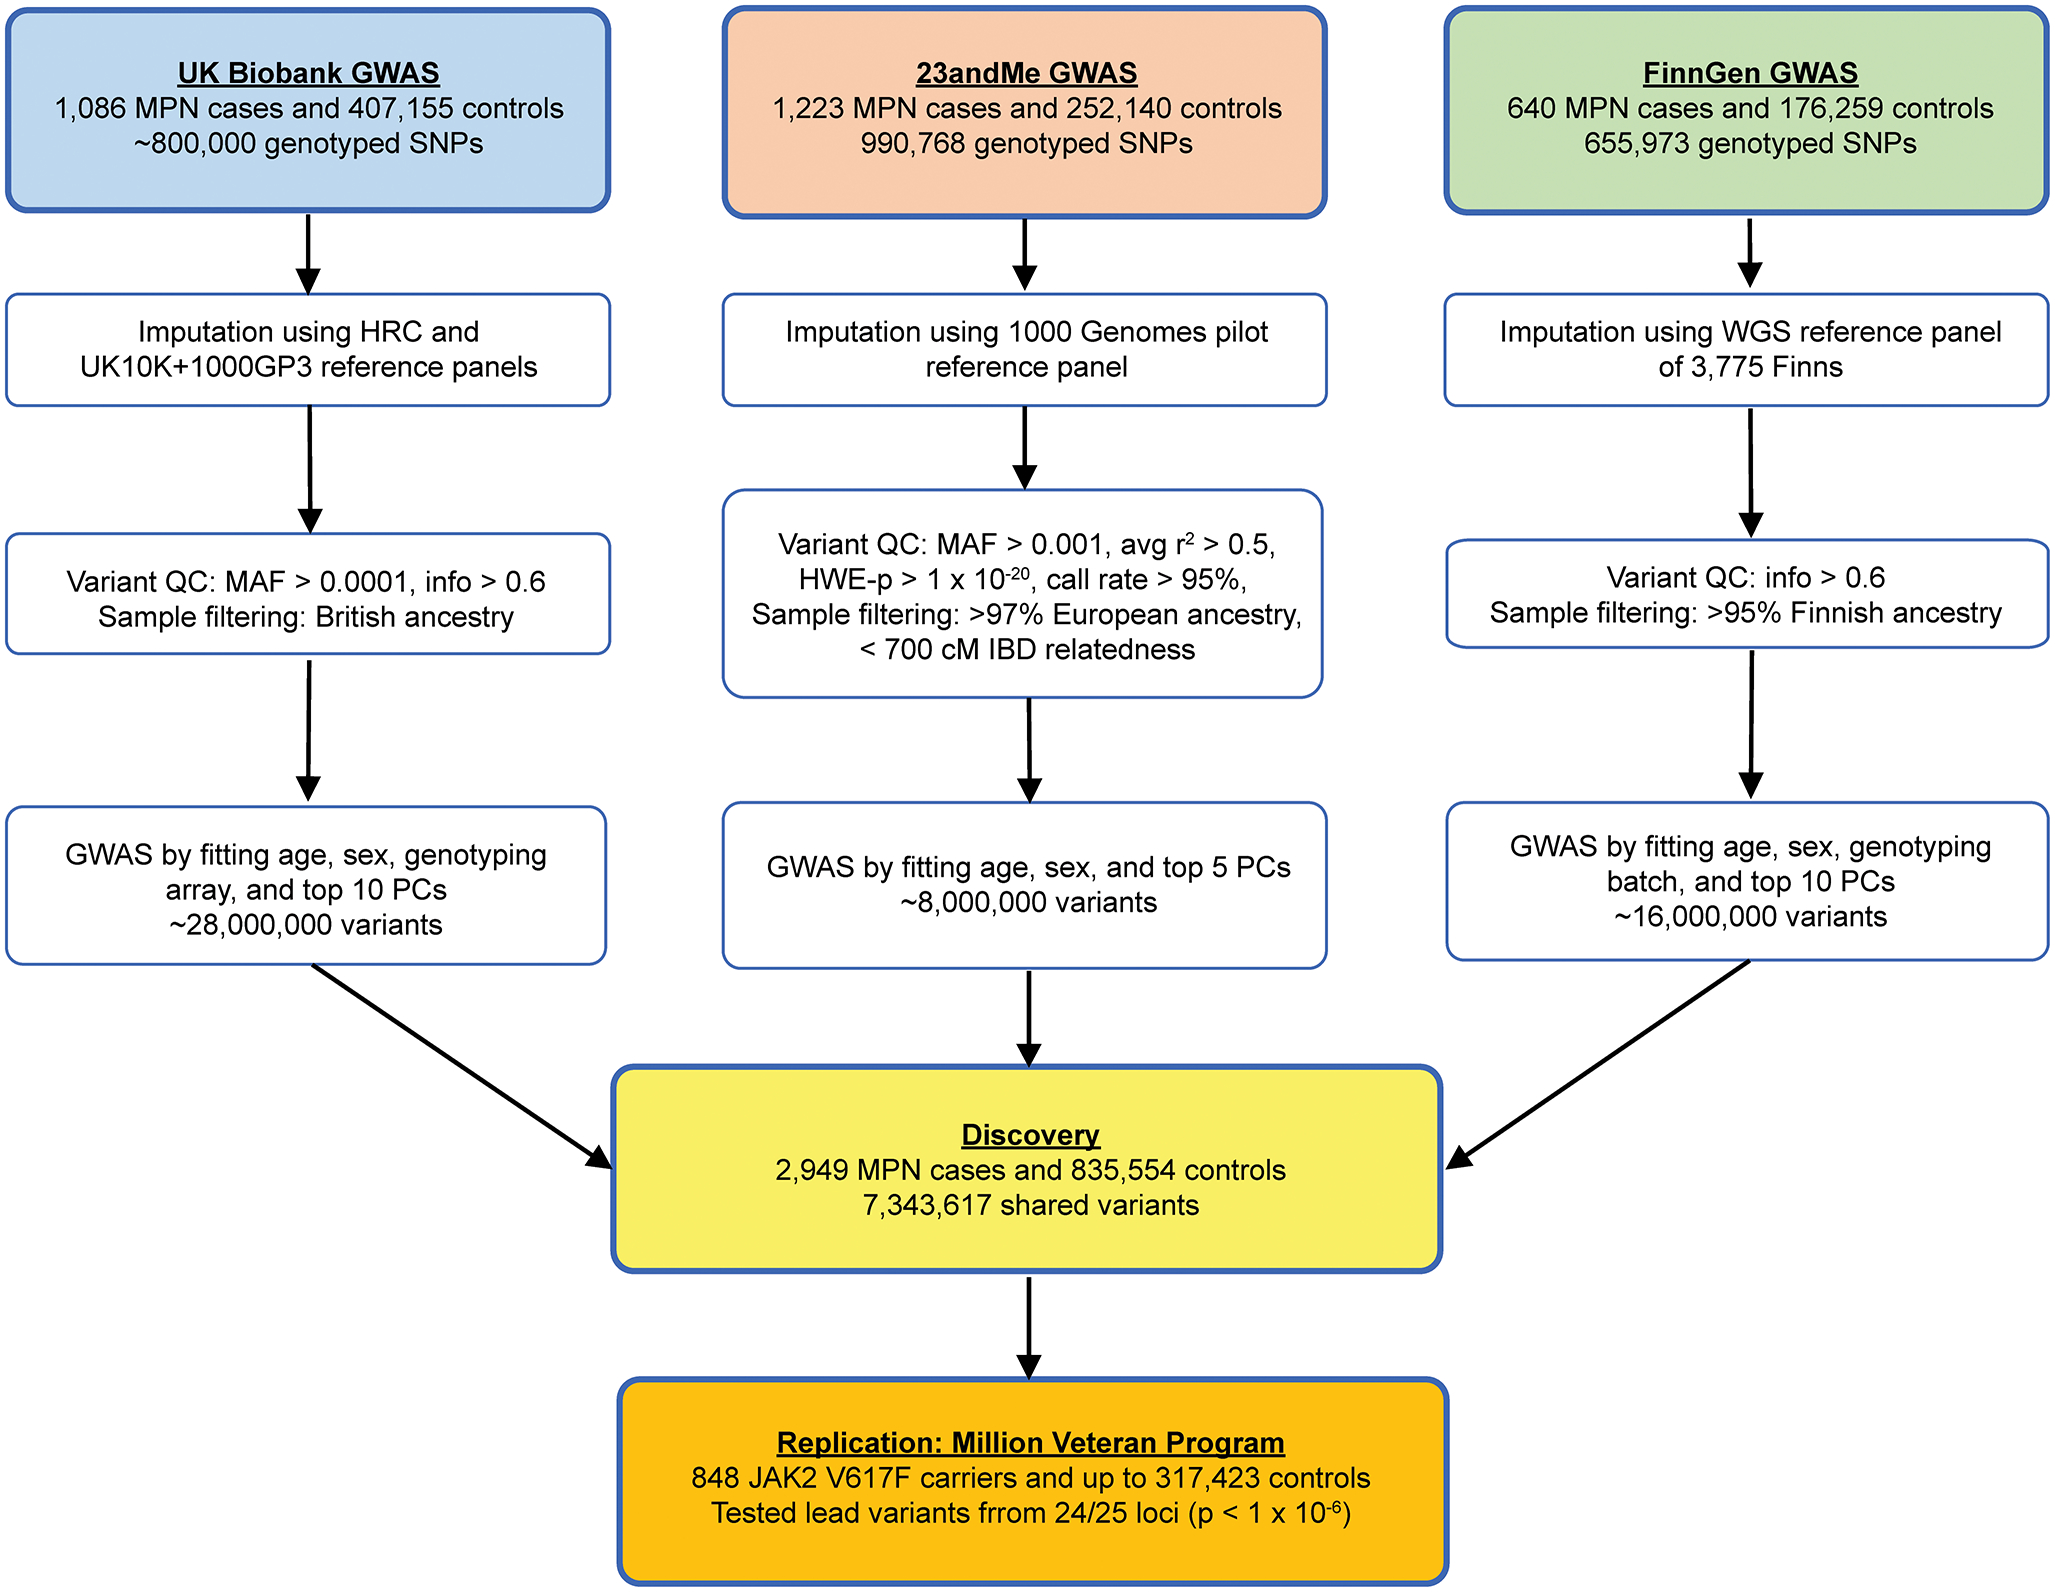
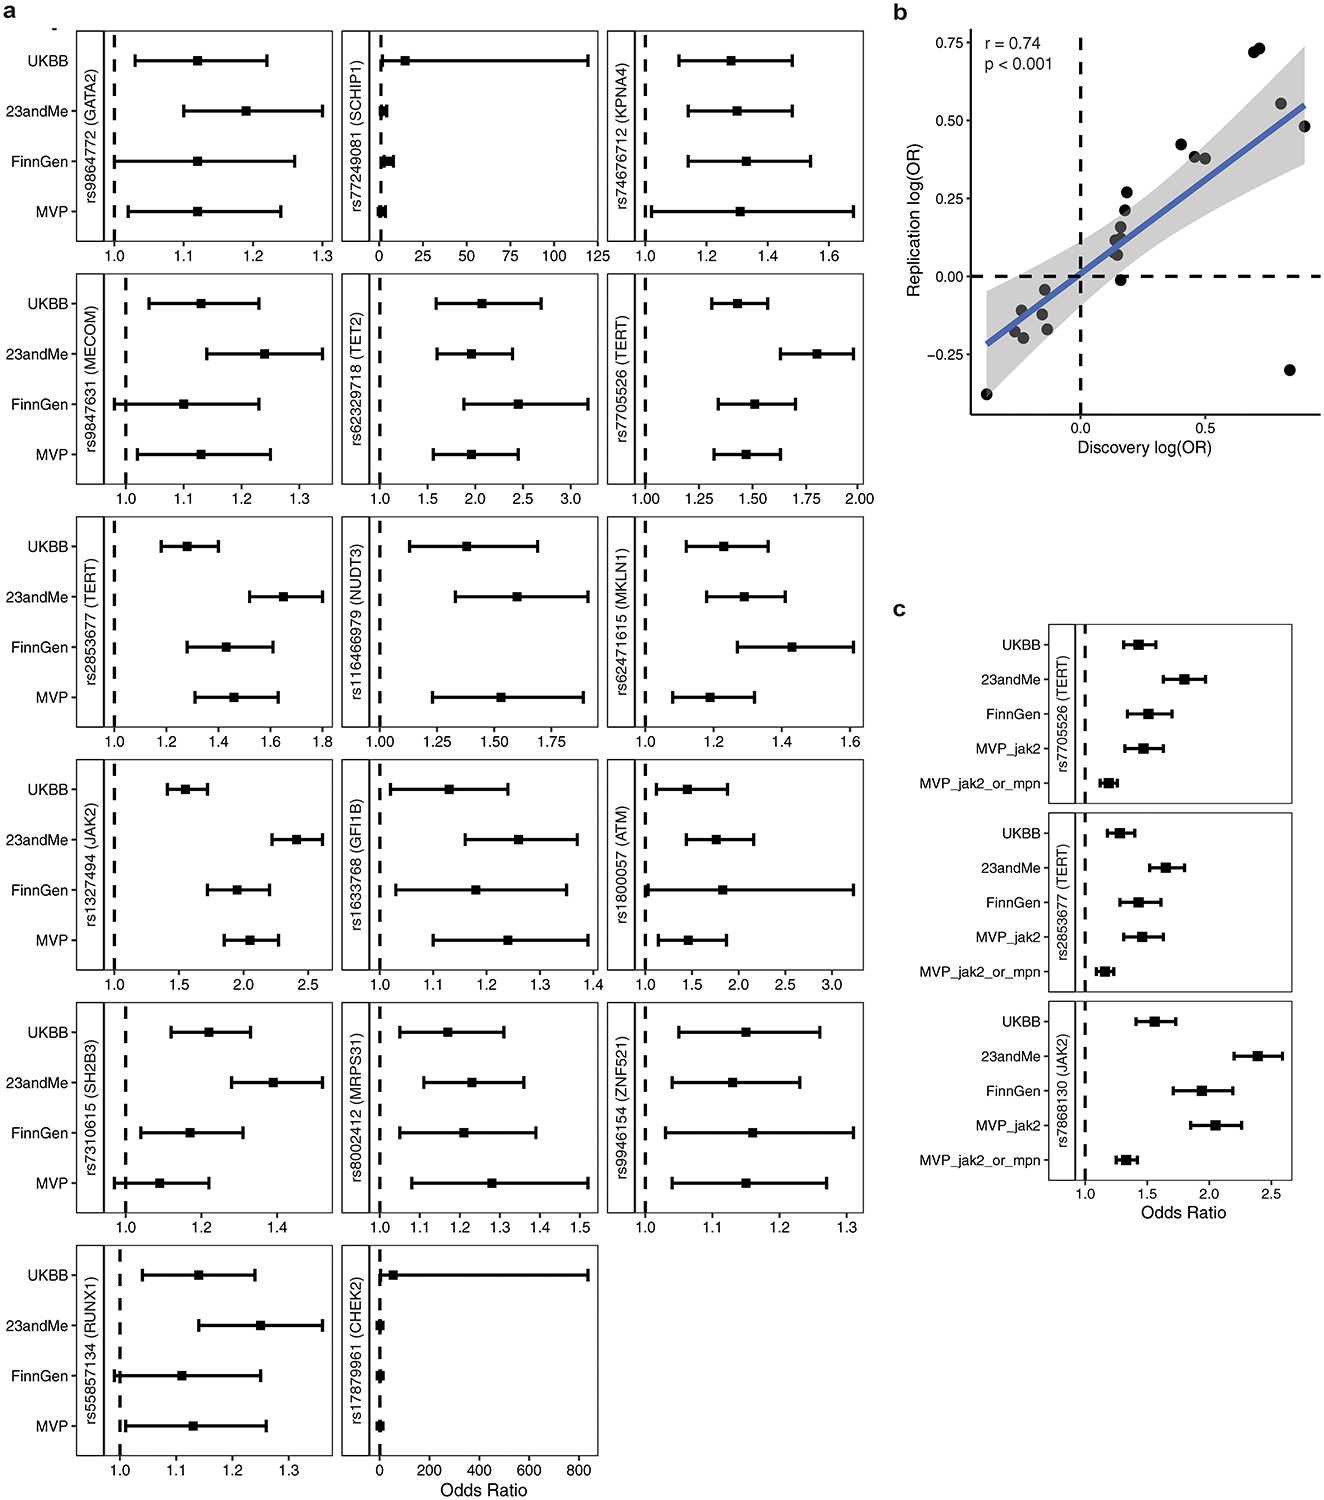
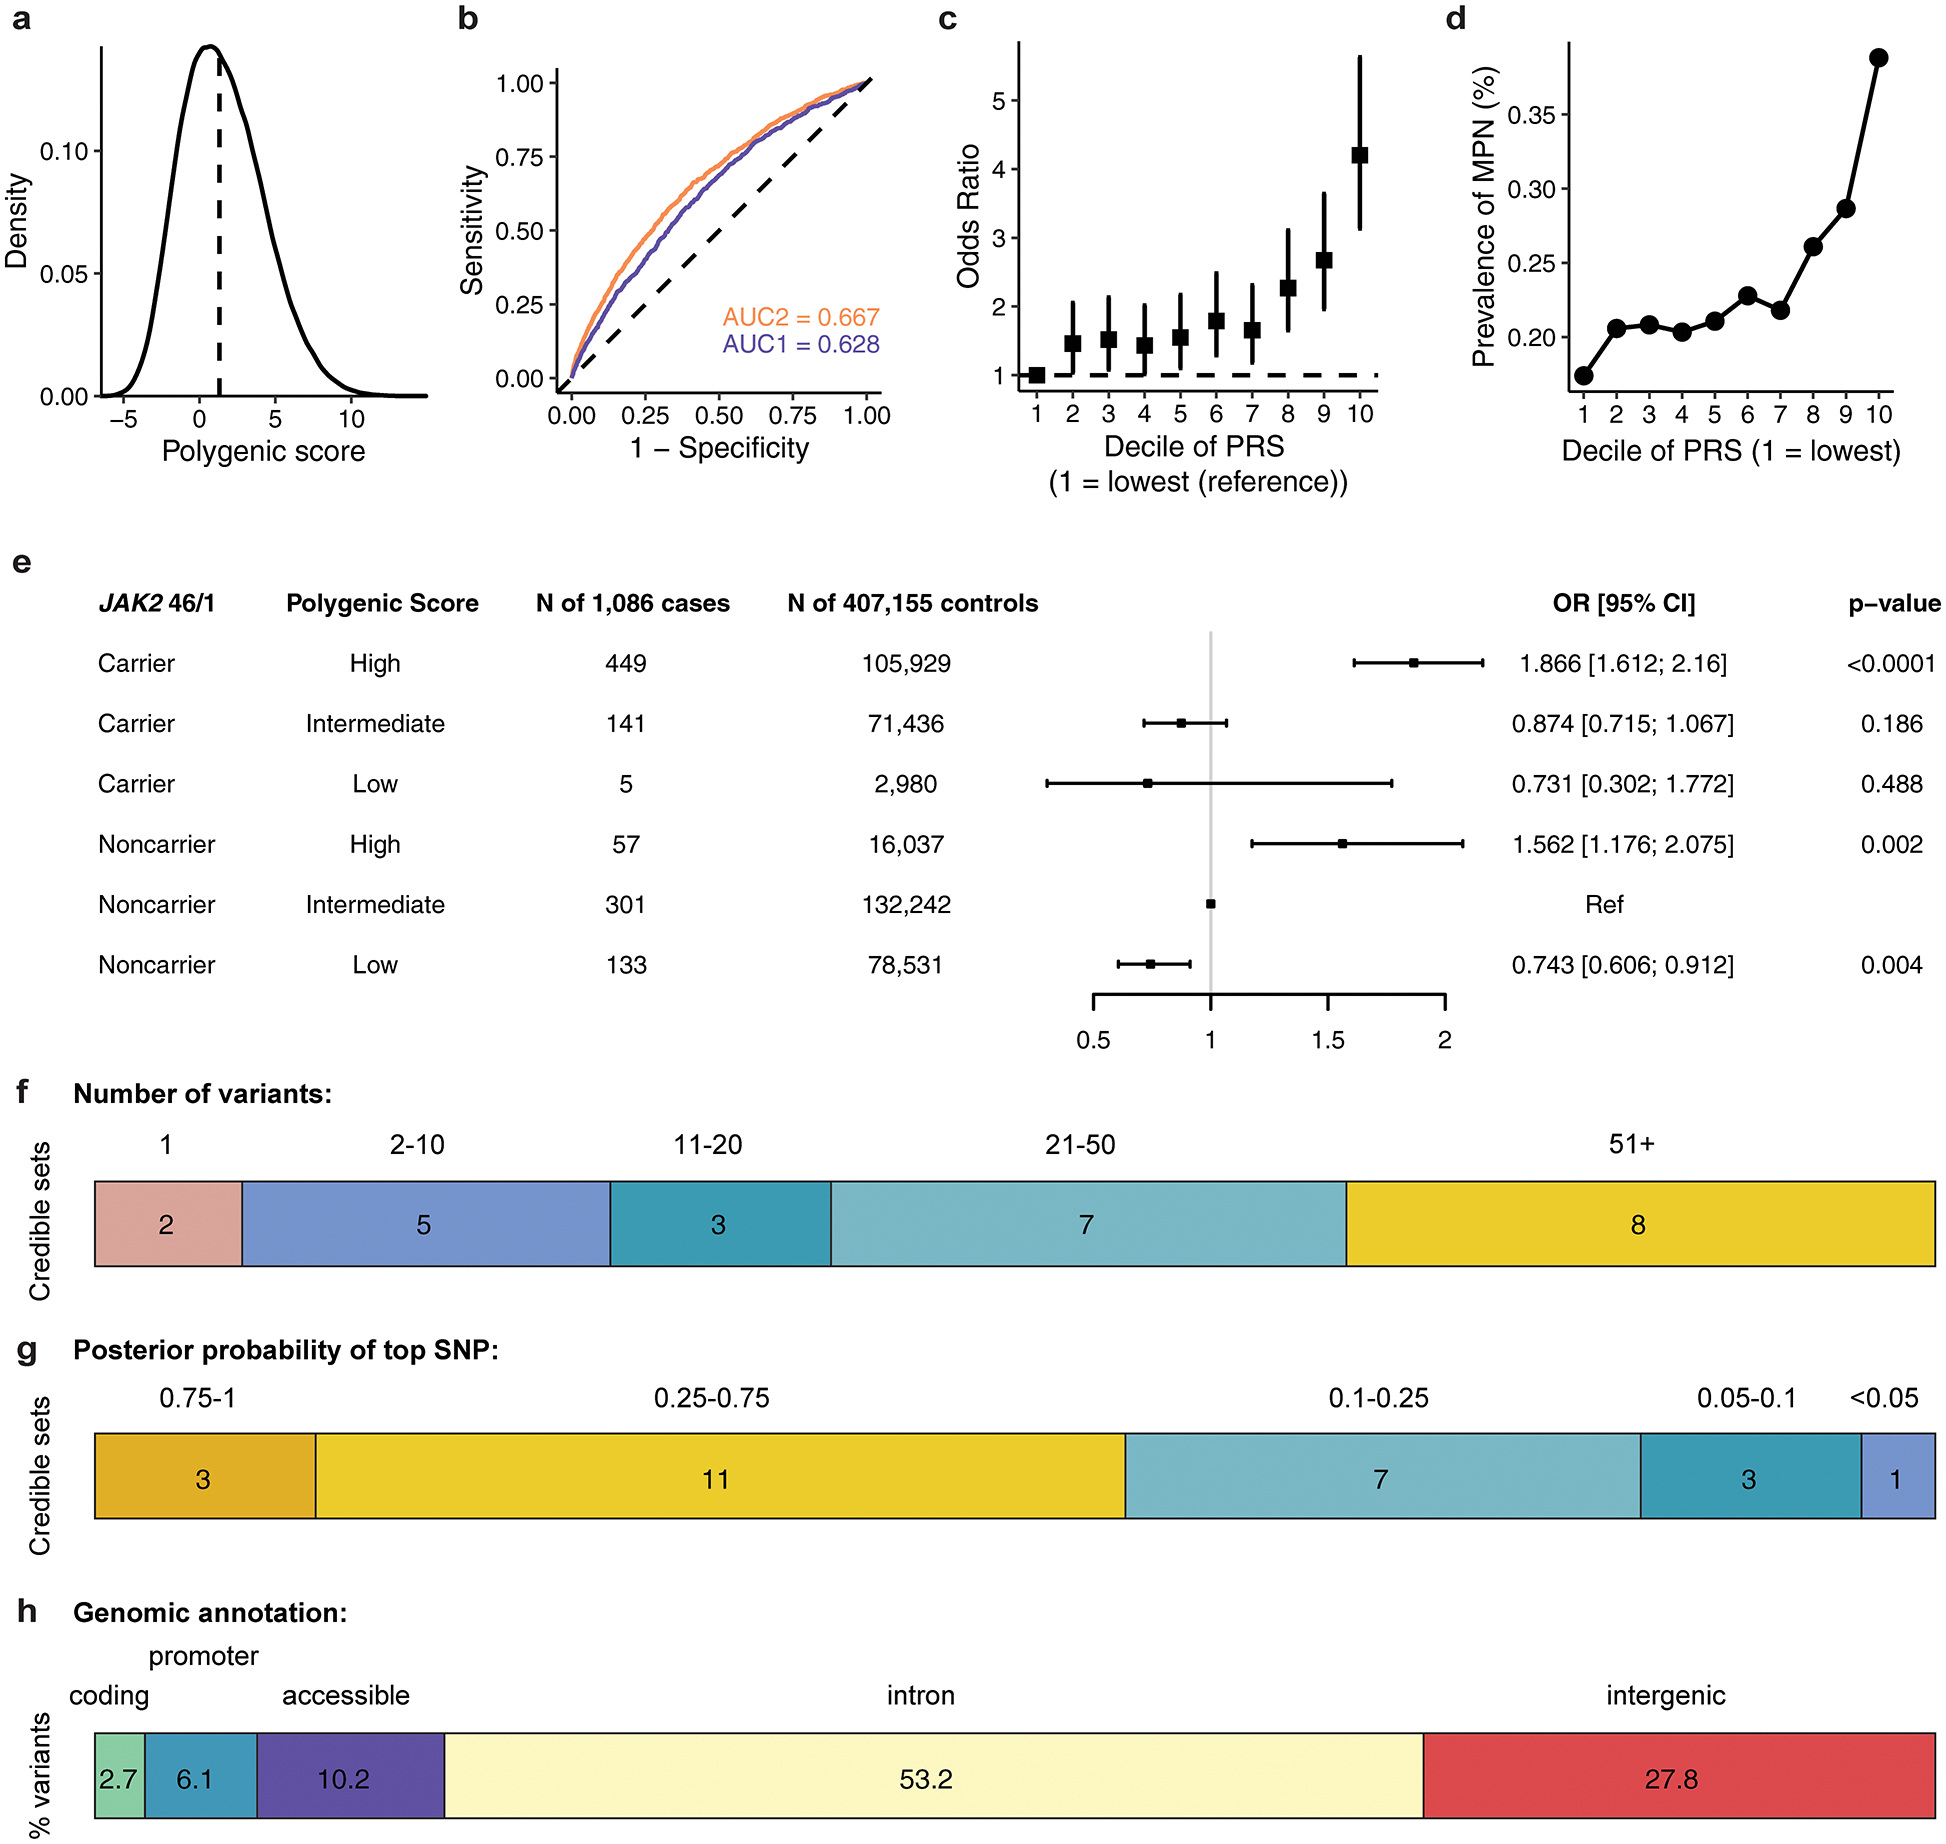
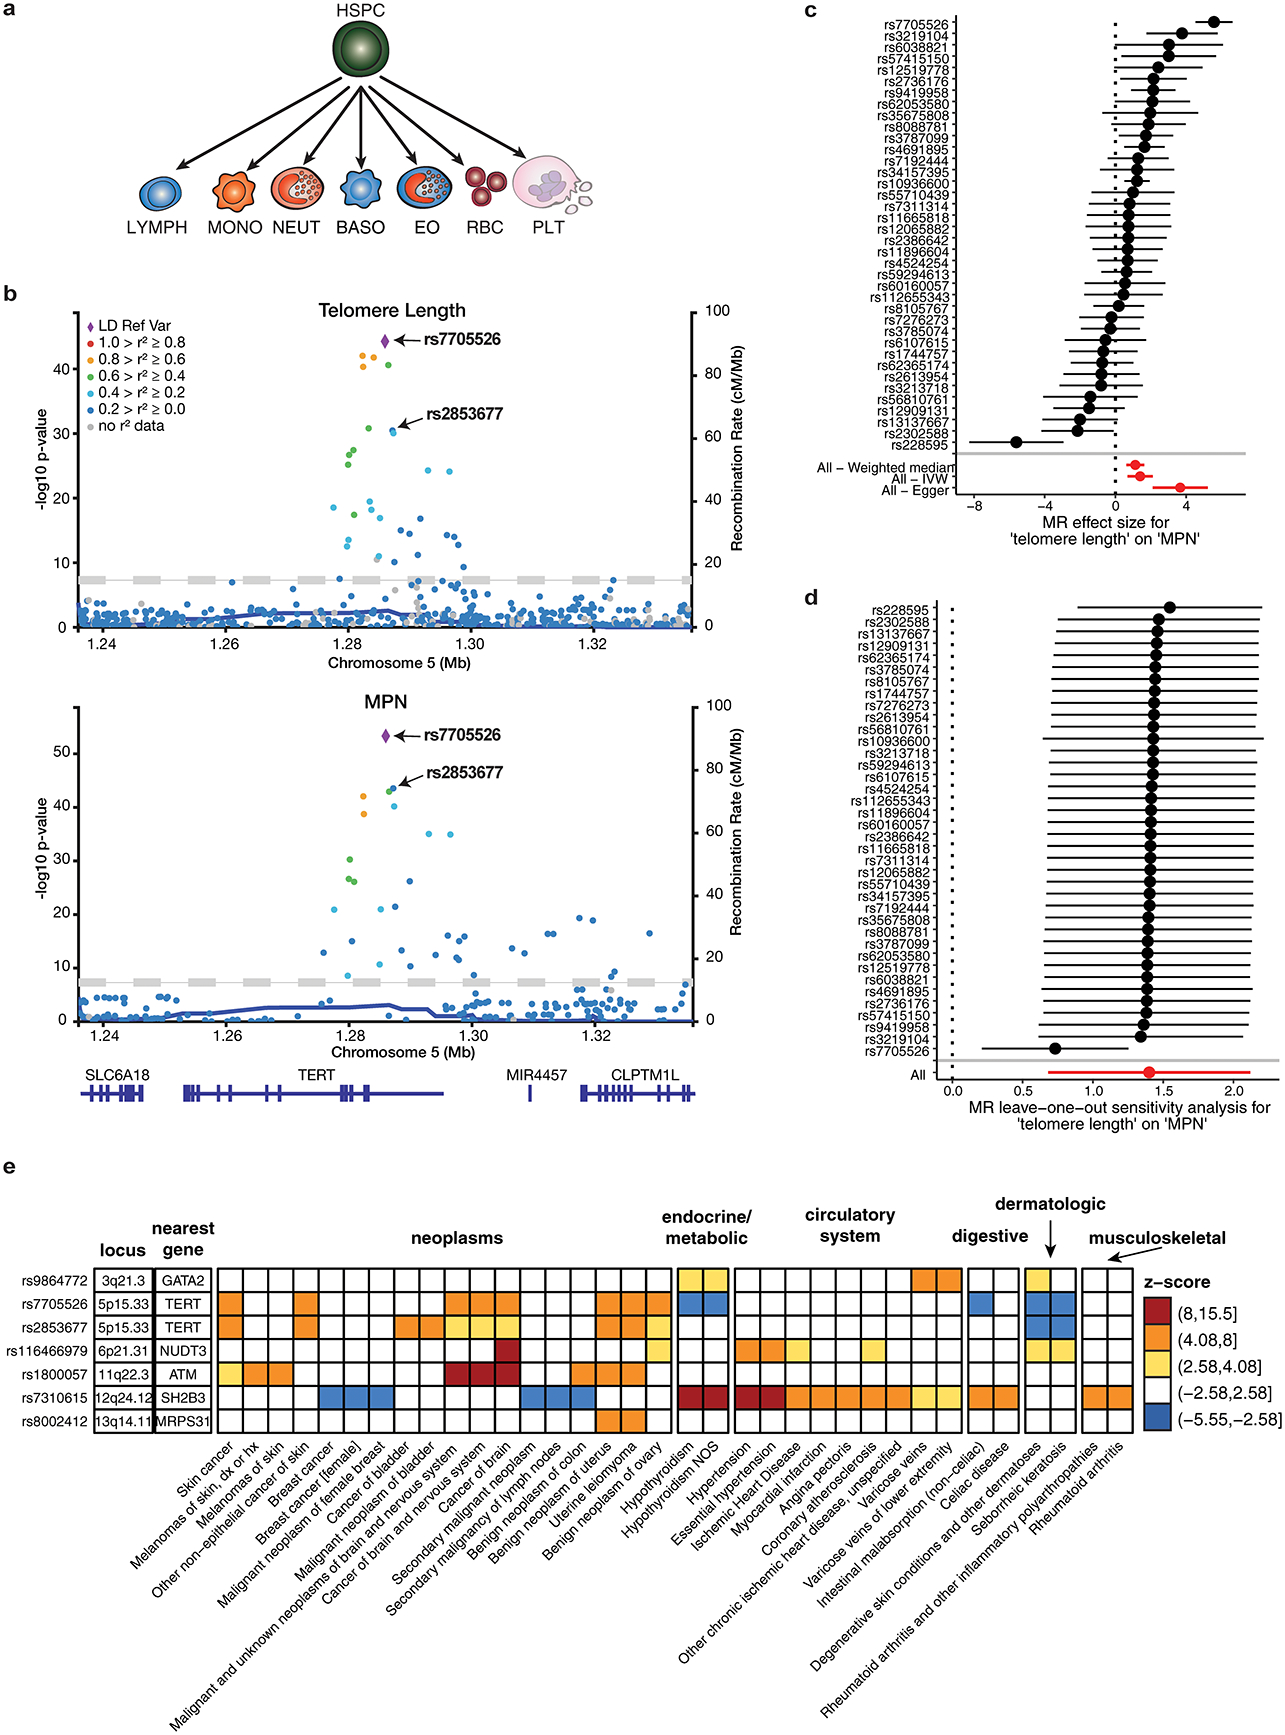
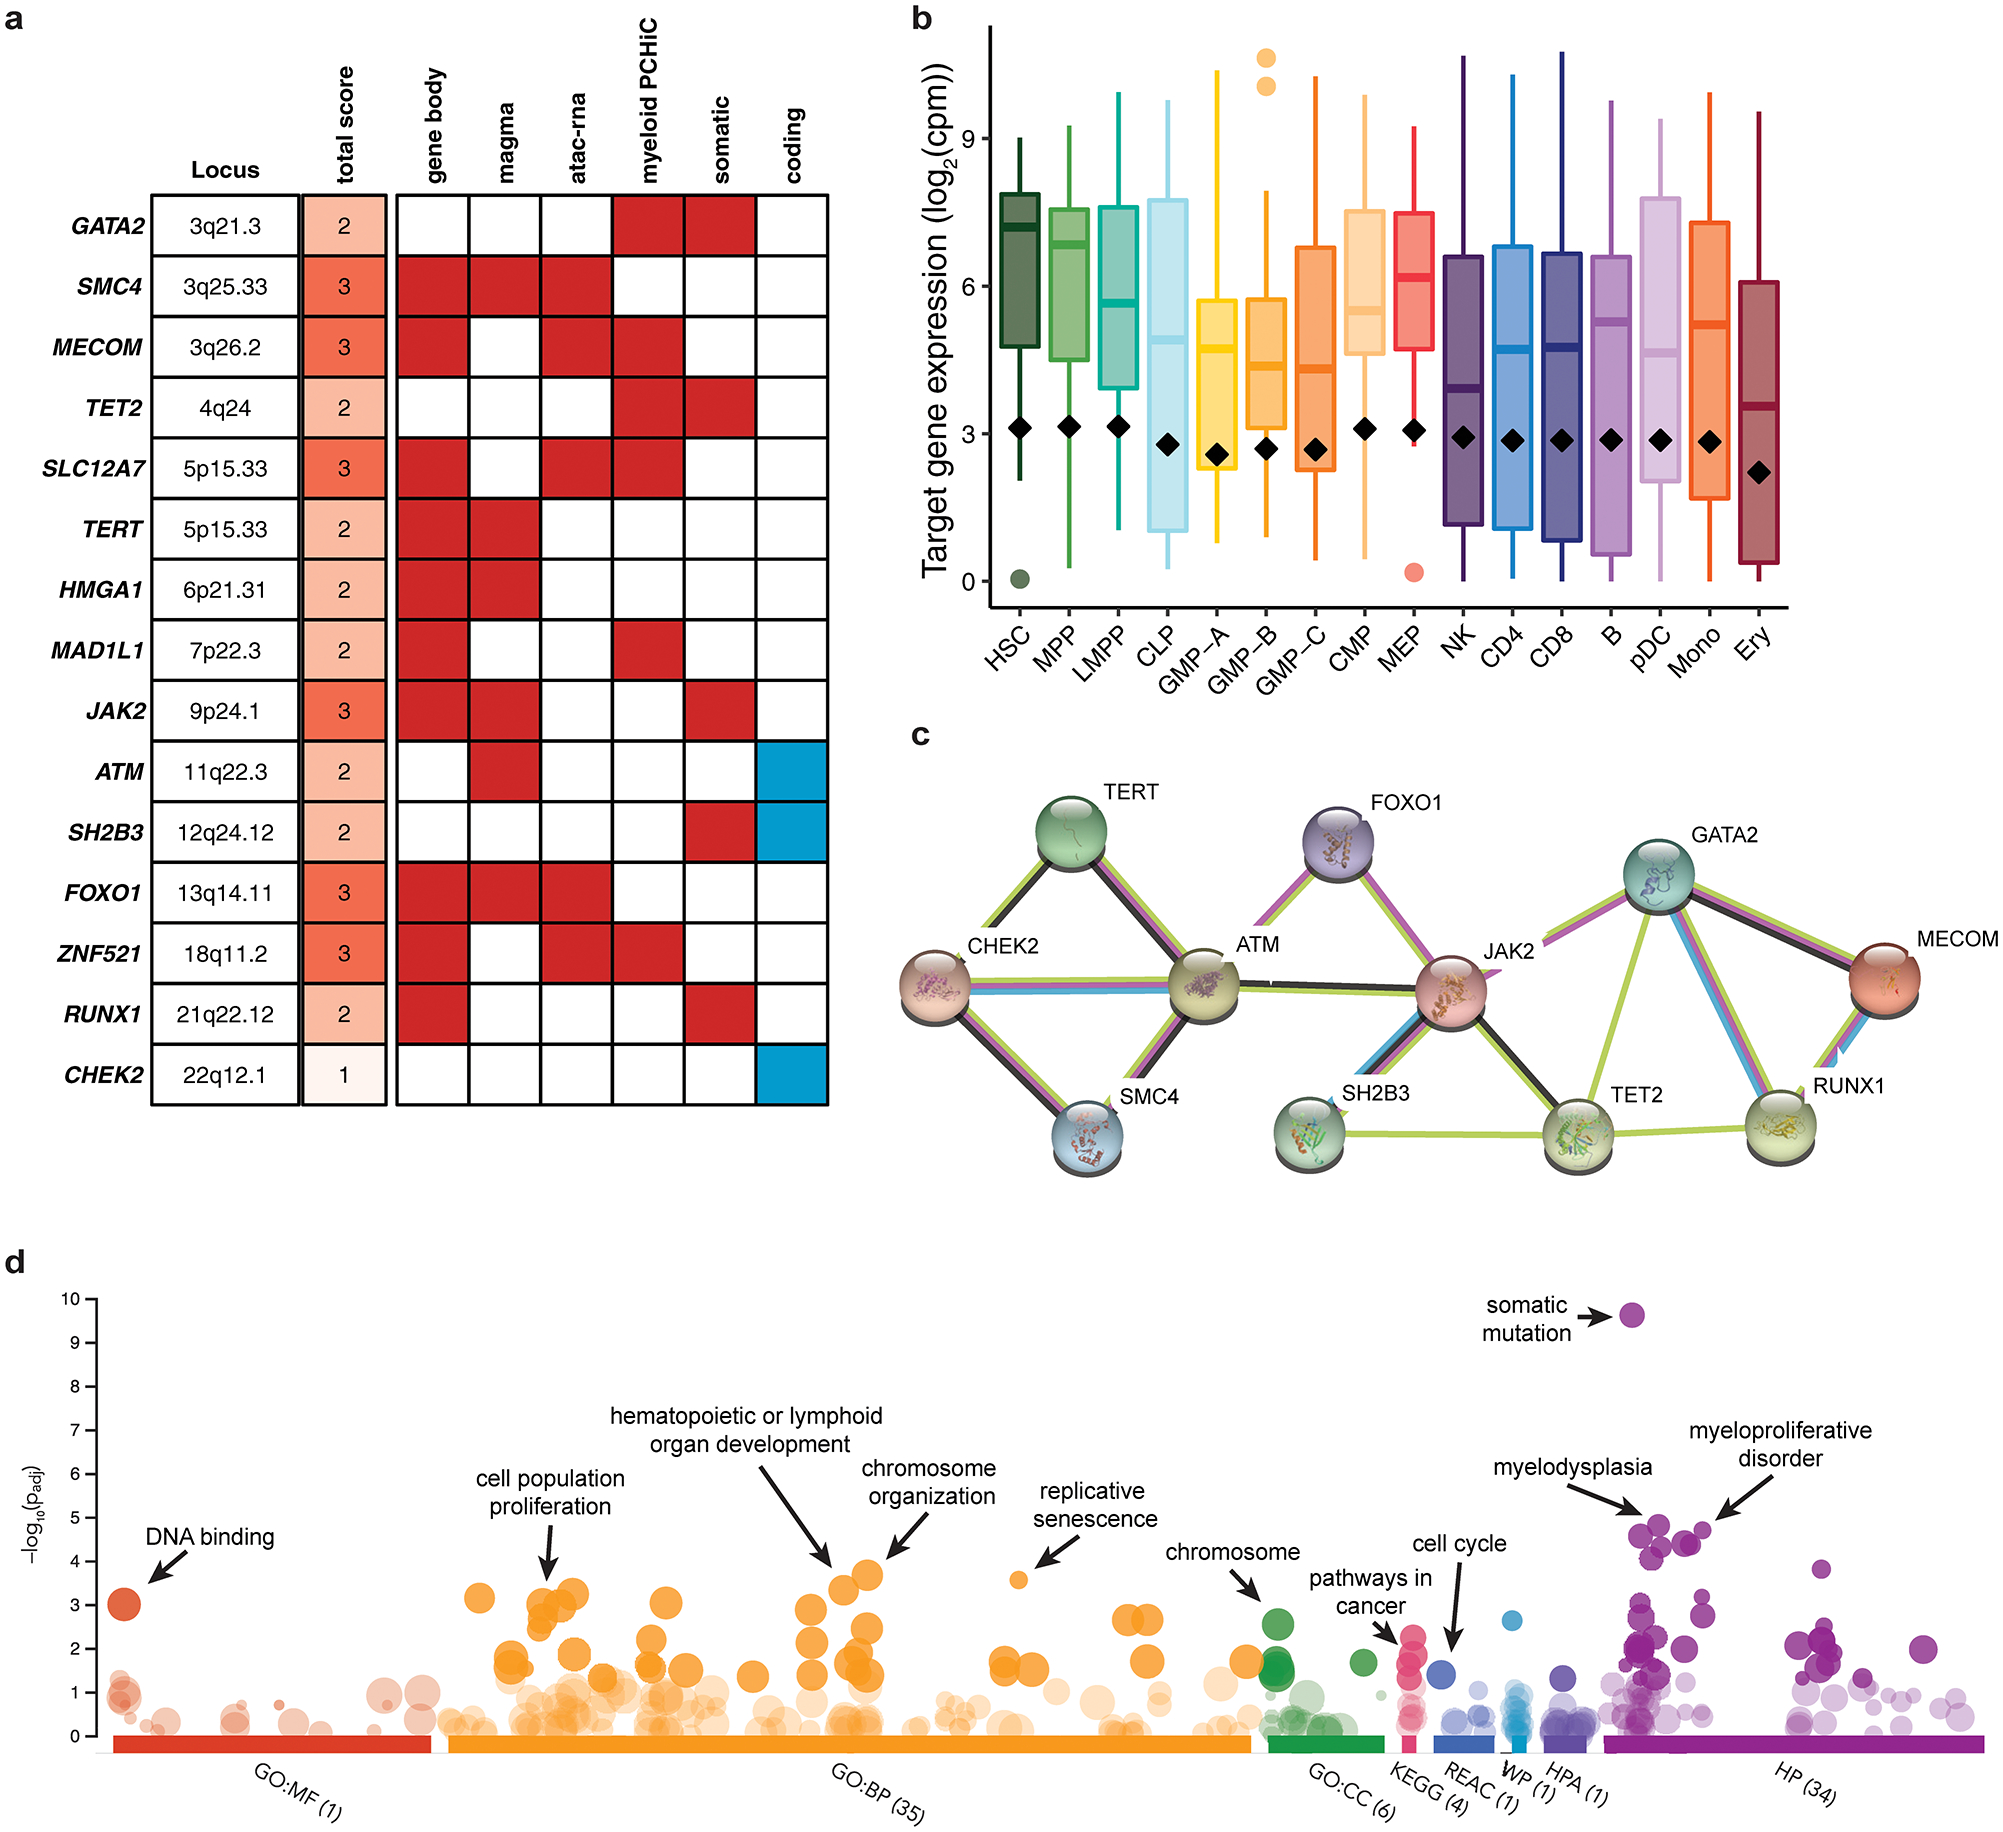
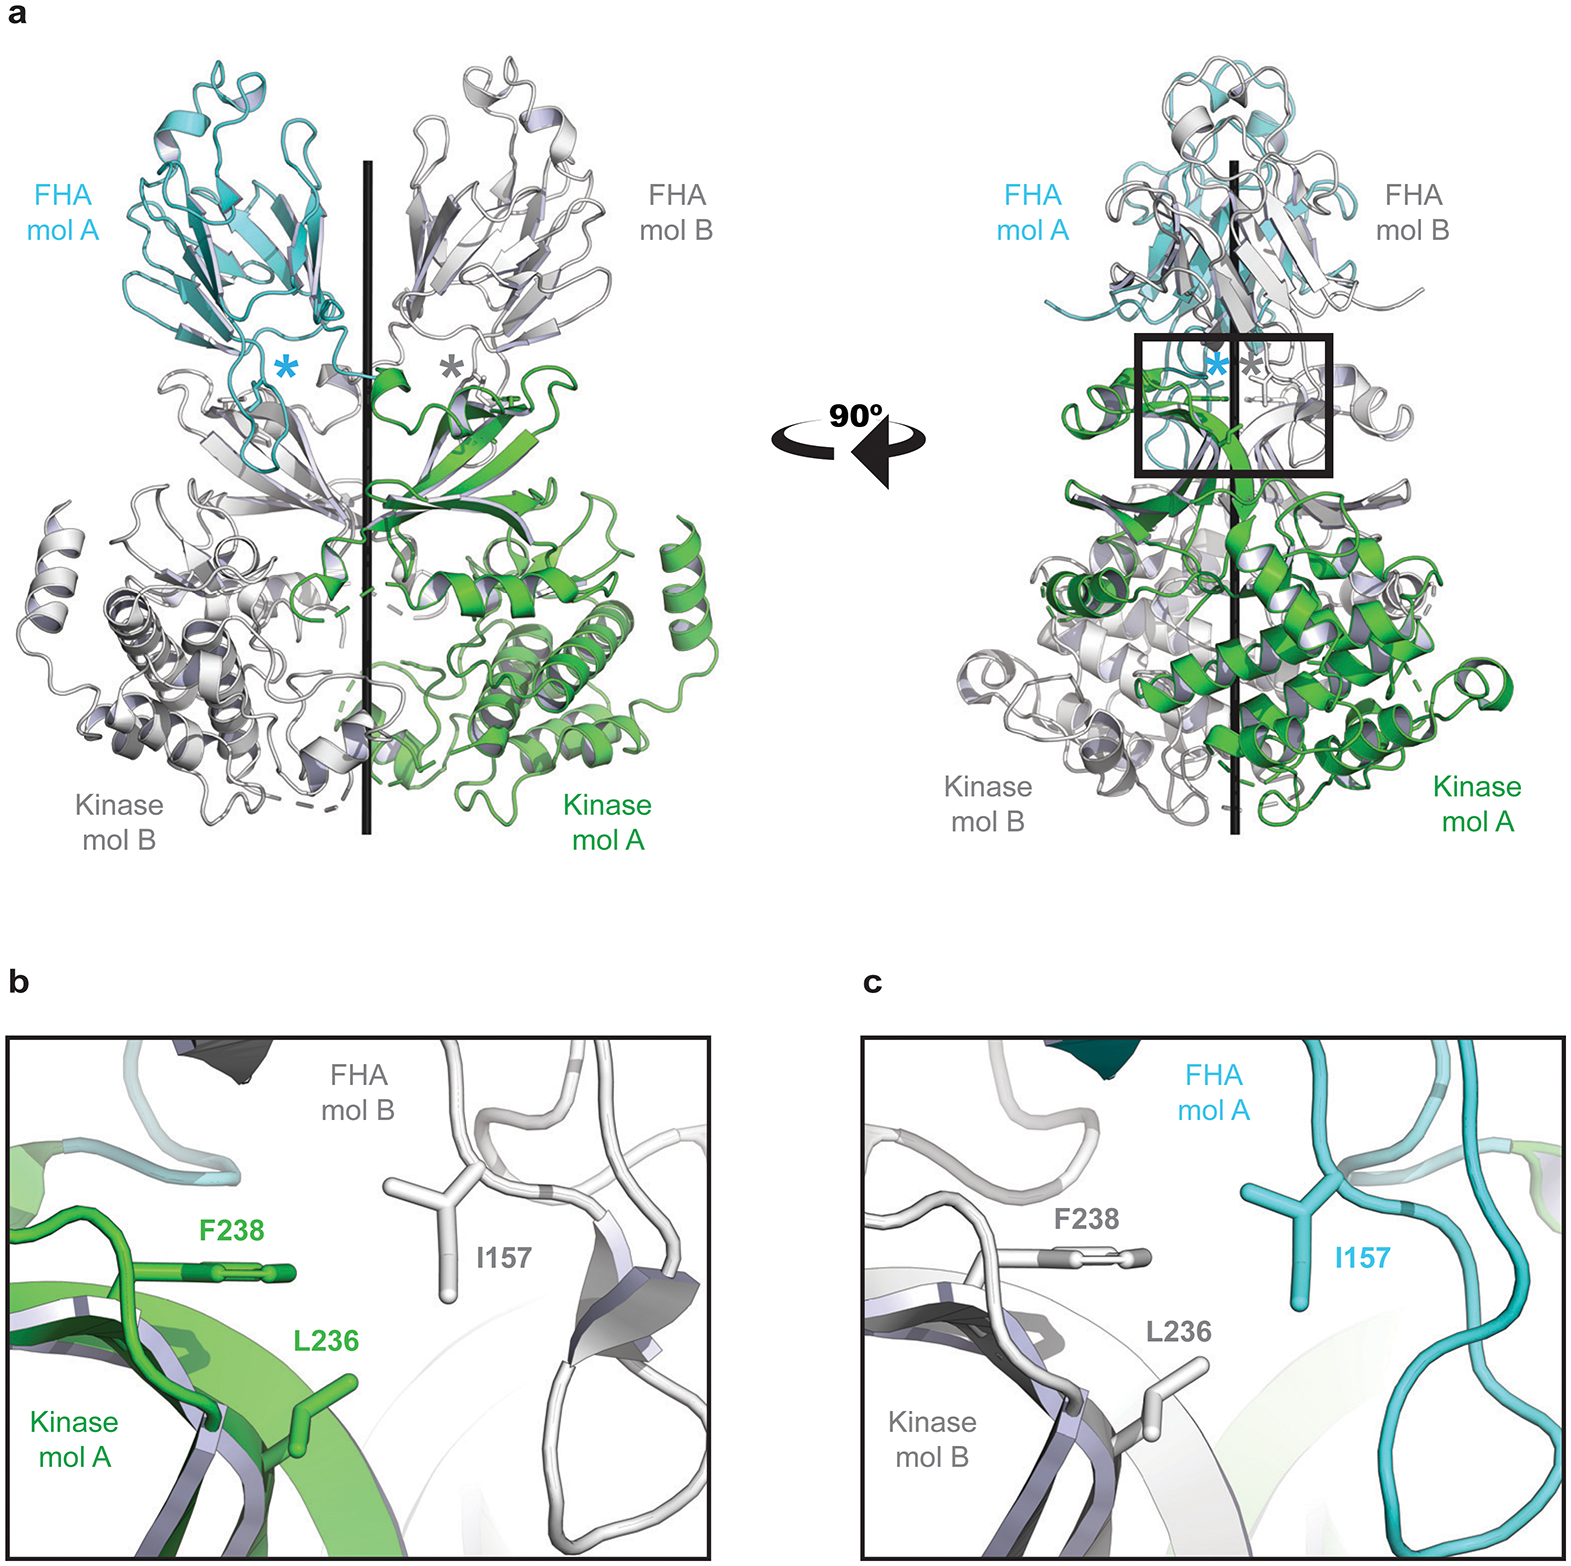
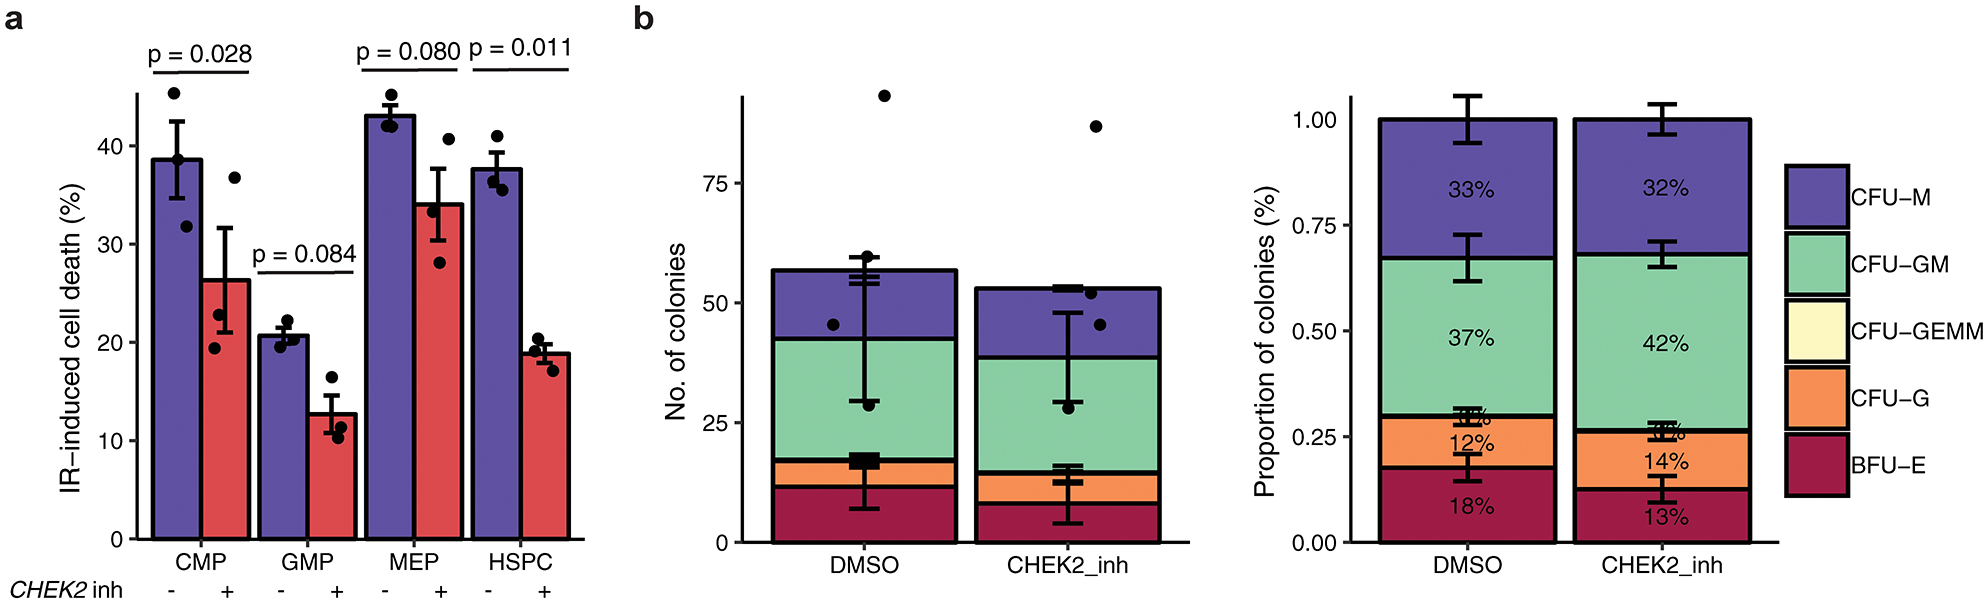
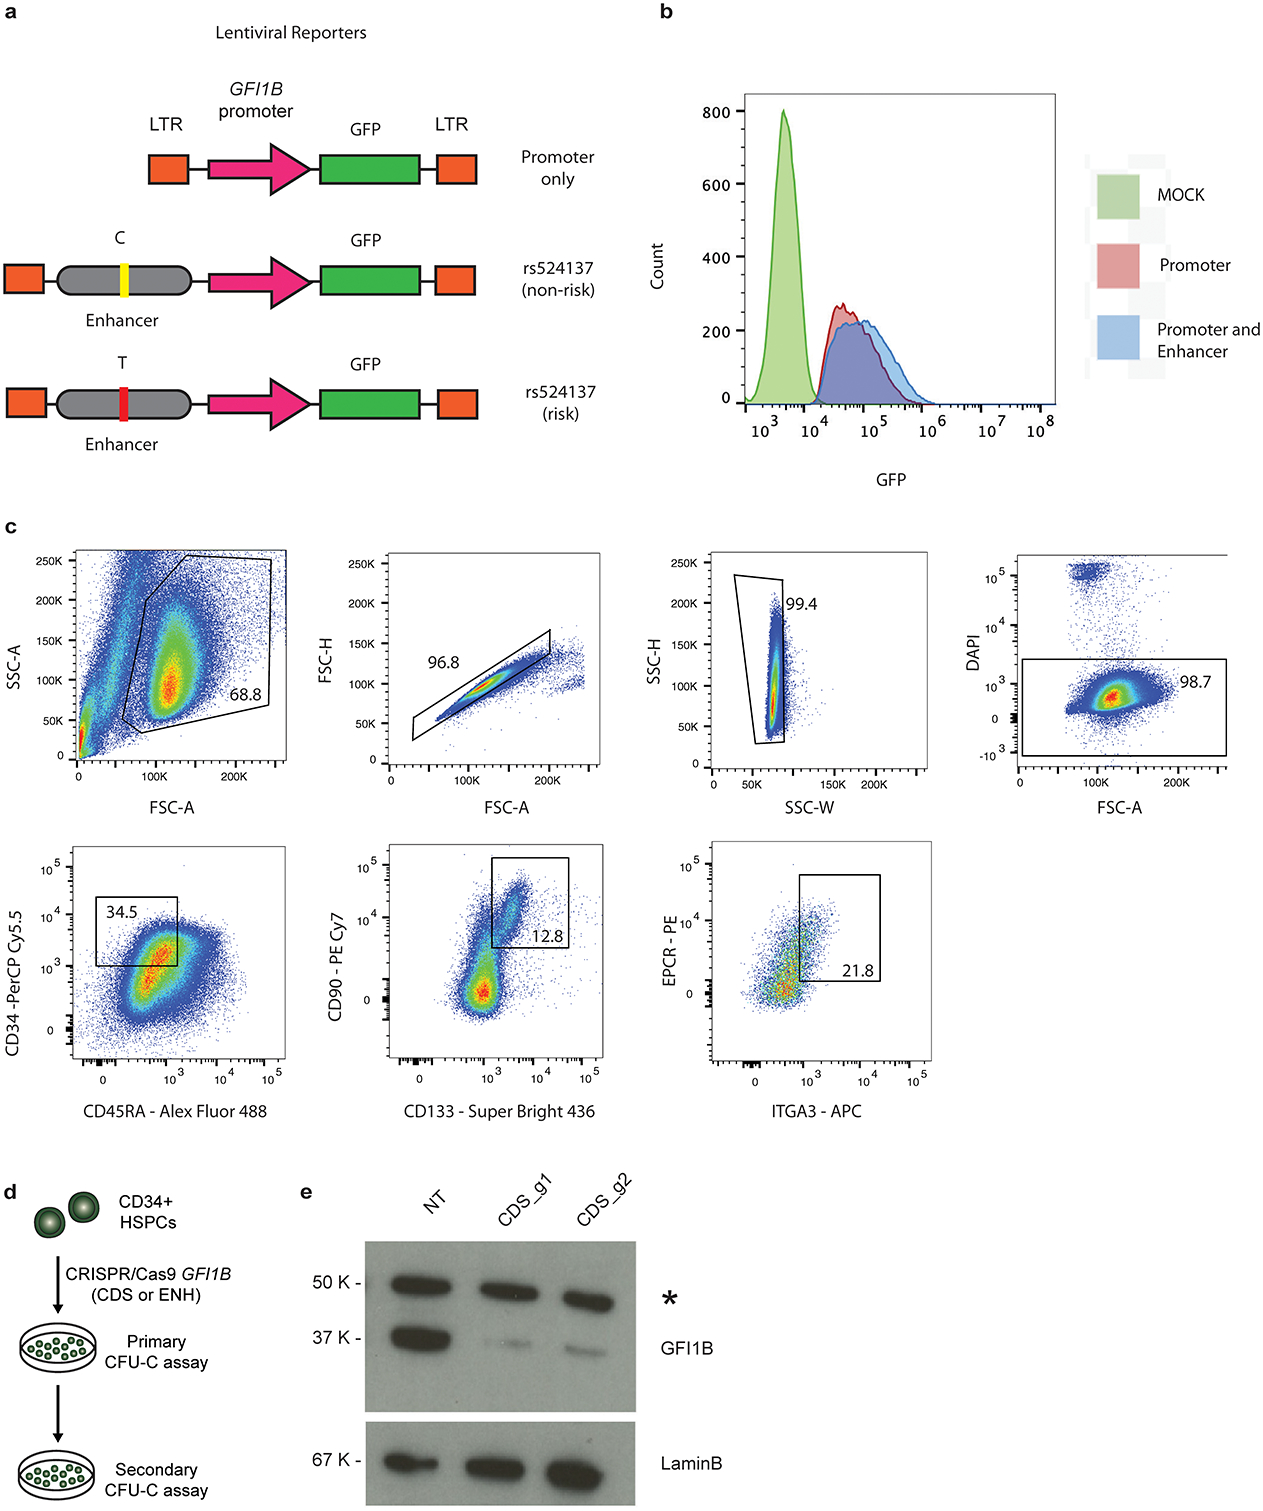
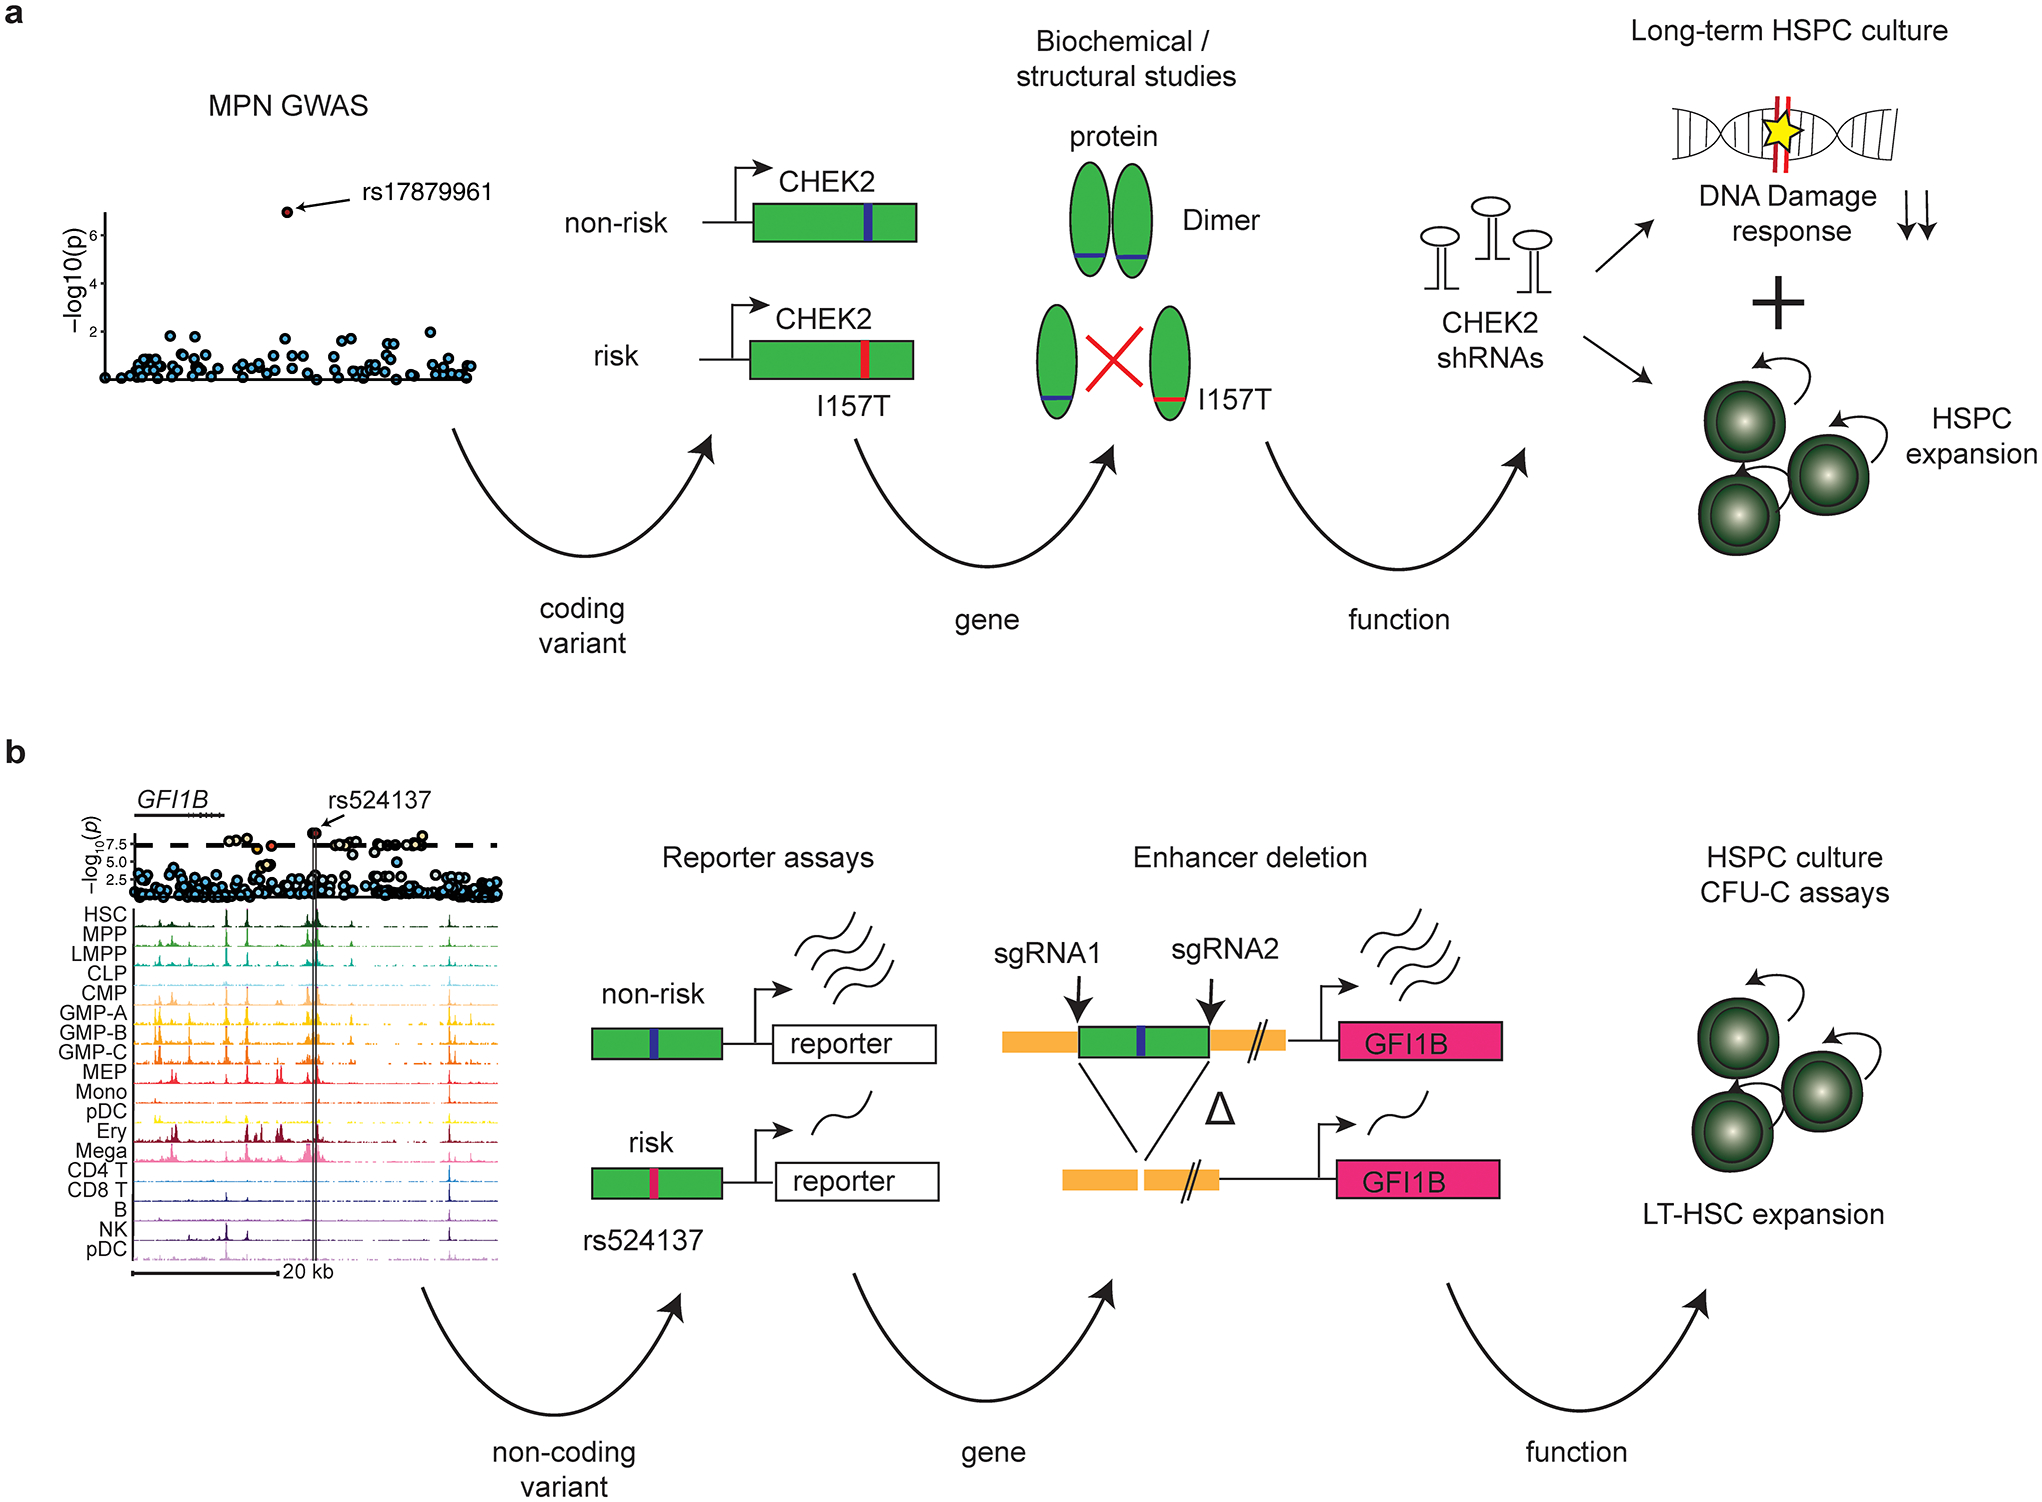
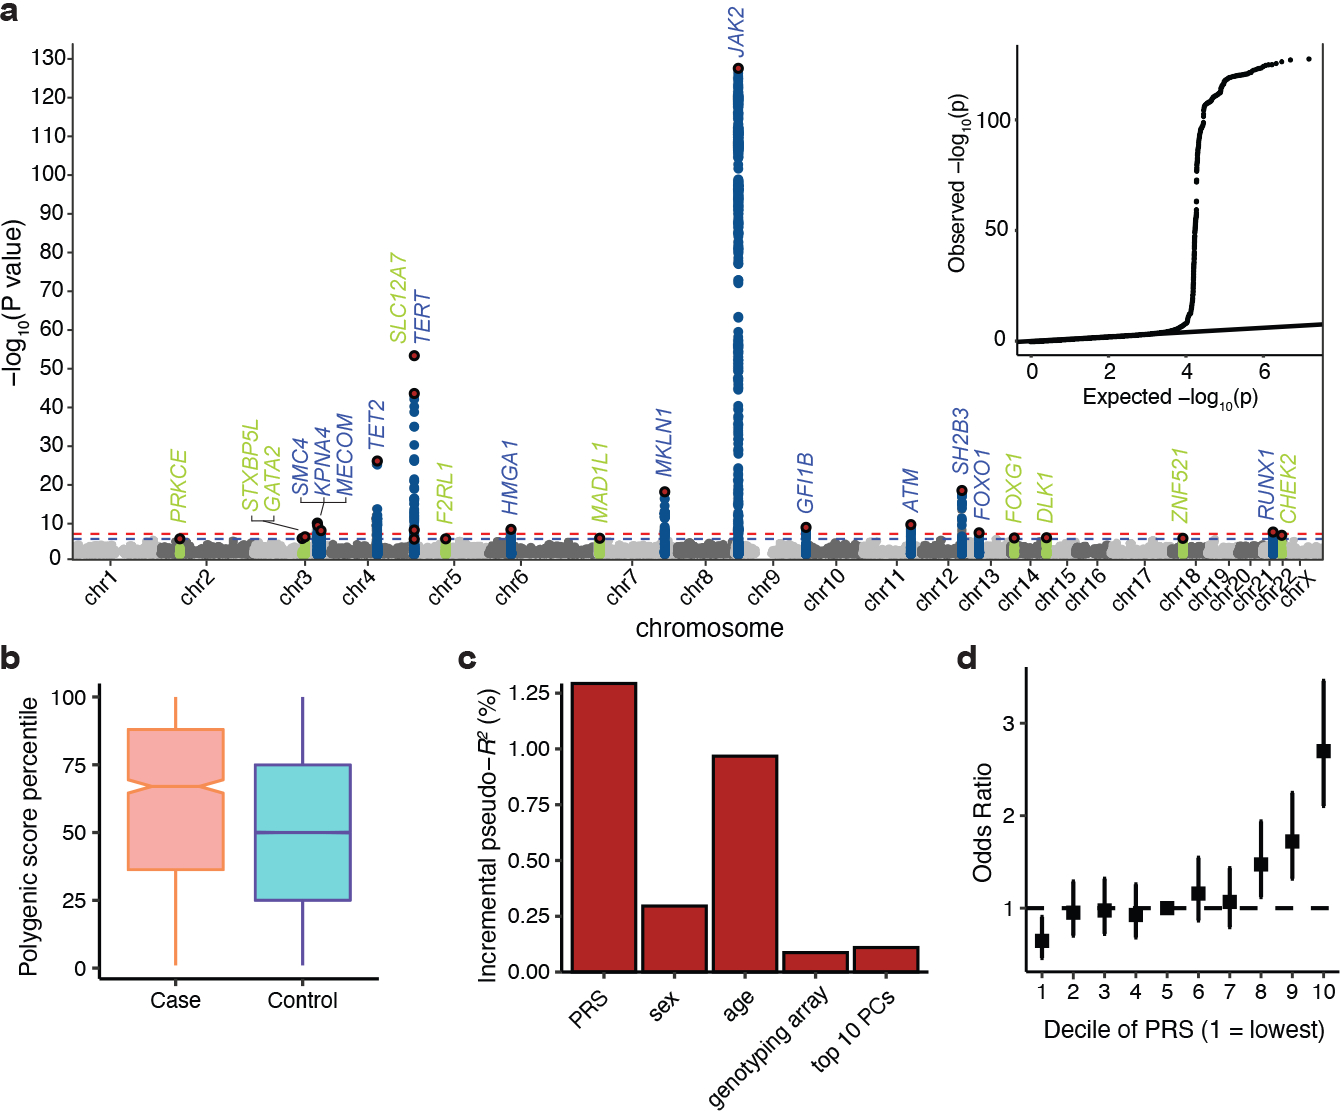
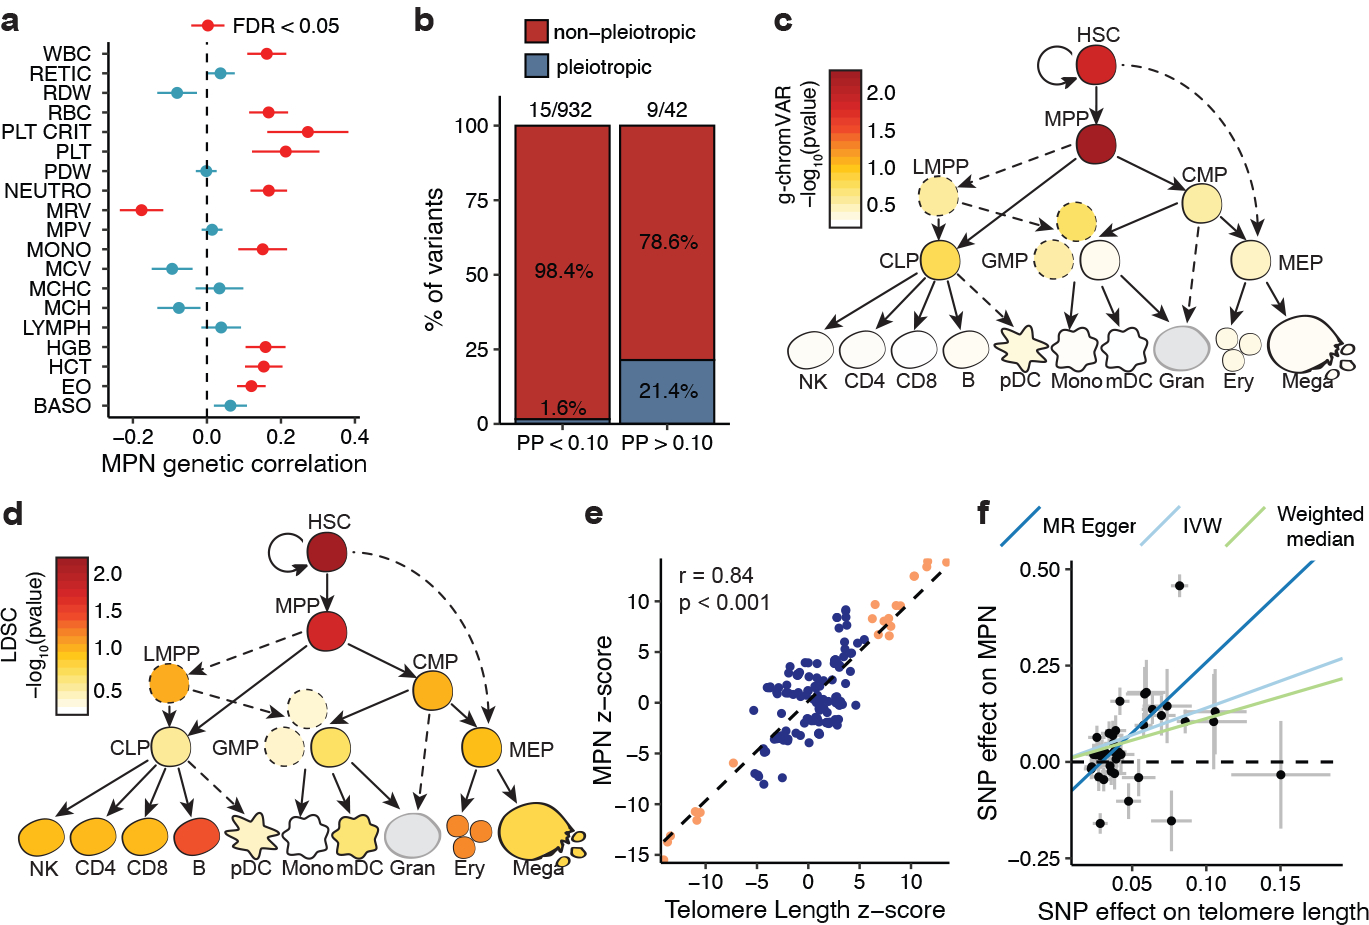
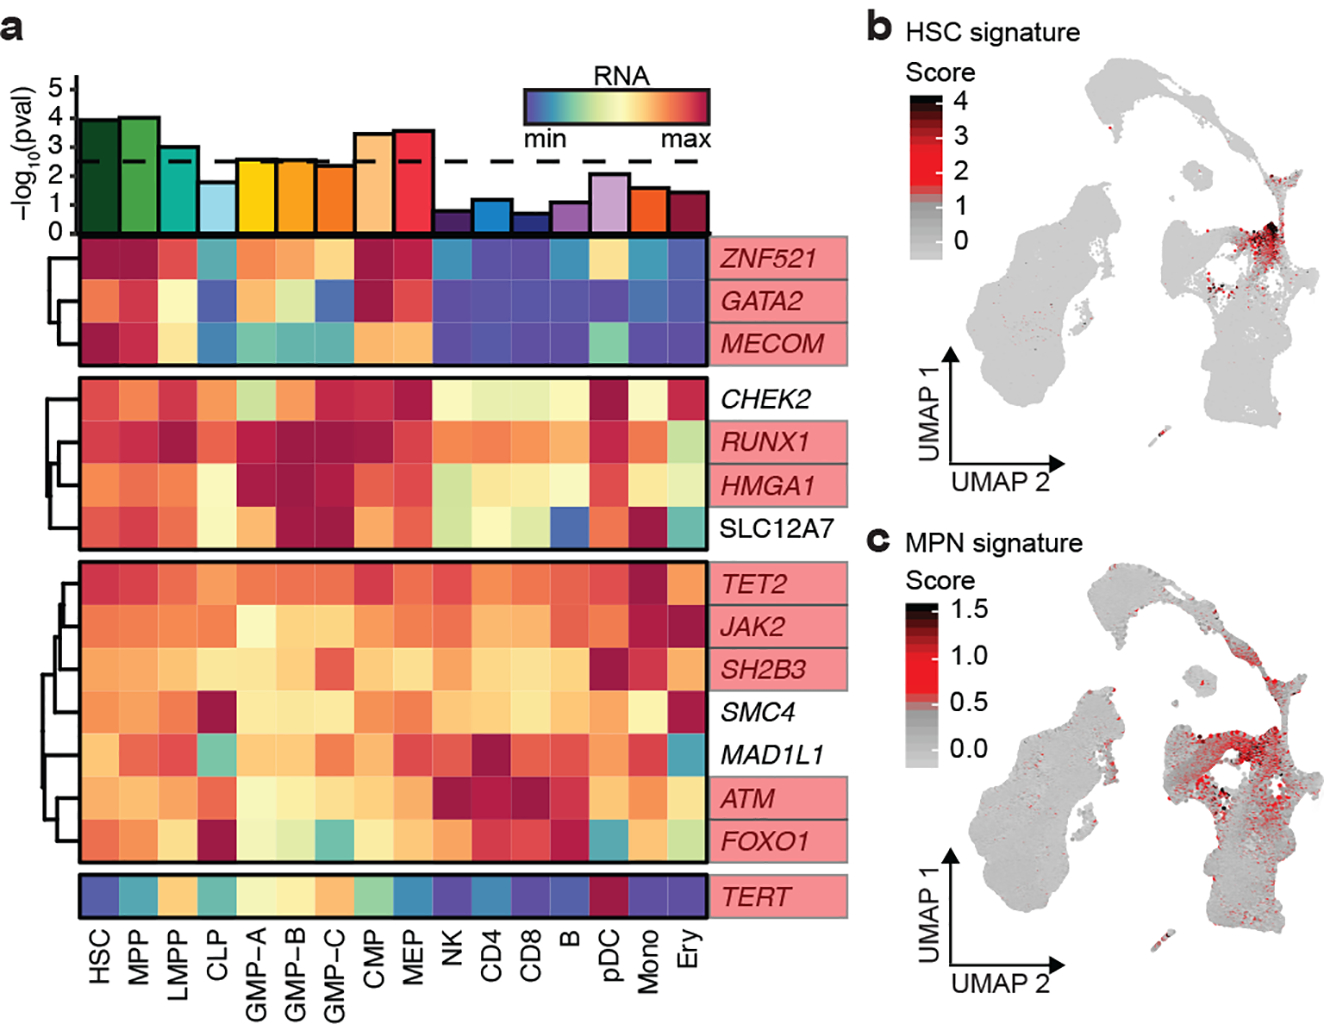
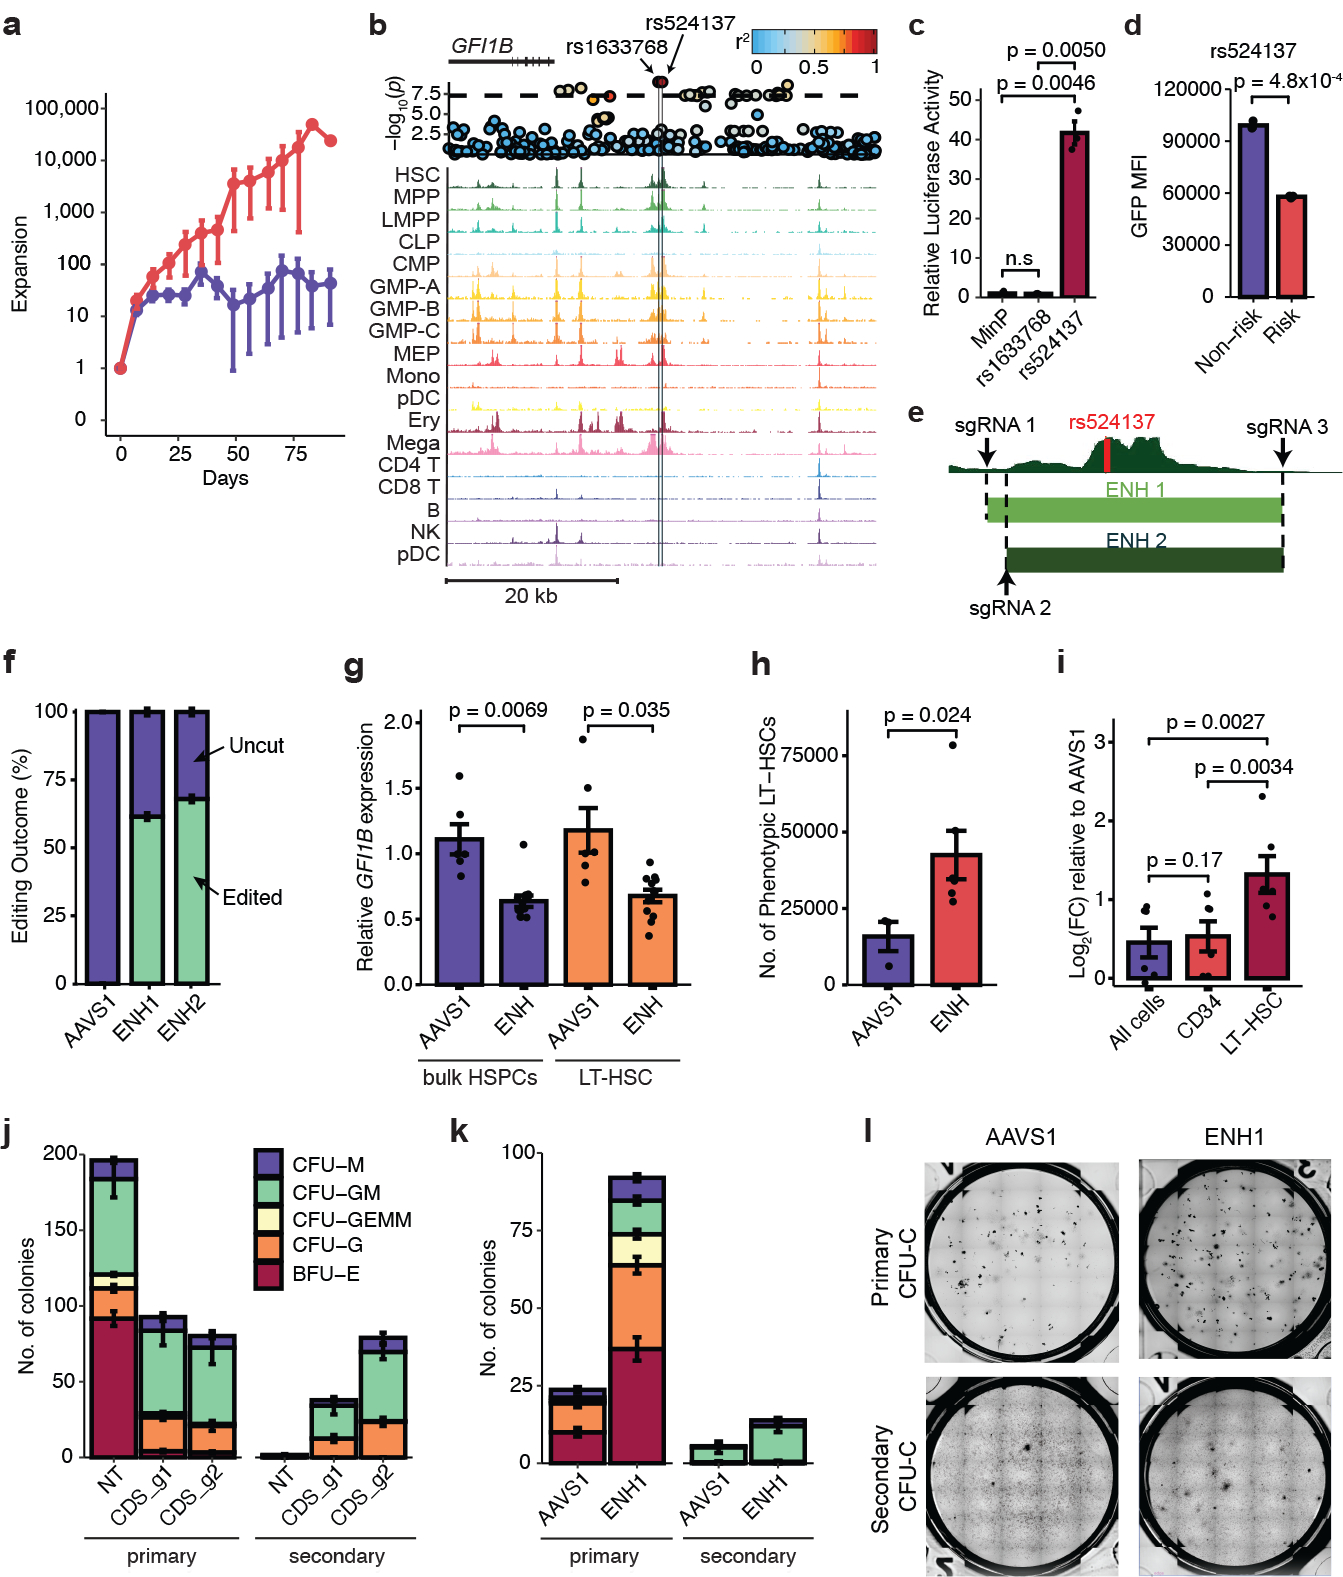
Myeloproliferative neoplasms (MPNs) are blood cancers that are characterized by the excessive production of mature myeloid cells and arise from the acquisition of somatic driver mutations in haematopoietic stem cells (HSCs). Epidemiological studies indicate a substantial heritable component of MPNs that is among the highest known for cancers1. However, only a limited number of genetic risk loci have been identified, and the underlying biological mechanisms that lead to the acquisition of MPNs remain unclear. Here, by conducting a large-scale genome-wide association study (3,797 cases and 1,152,977 controls), we identify 17 MPN risk loci (P < 5.0 × 10⁻⁸), 7 of which have not been previously reported. We find that there is a shared genetic architecture between MPN risk and several haematopoietic traits from distinct lineages; that there is an enrichment for MPN risk variants within accessible chromatin of HSCs; and that increased MPN risk is associated with longer telomere length in leukocytes and other clonal haematopoietic states-collectively suggesting that MPN risk is associated with the function and self-renewal of HSCs. We use gene mapping to identify modulators of HSC biology linked to MPN risk, and show through targeted variant-to-function assays that CHEK2 and GFI1B have roles in altering the function of HSCs to confer disease risk. Overall, our results reveal a previously unappreciated mechanism for inherited MPN risk through the modulation of HSC function.


Figures

Extended Data Figure 1.
Flowchart of genetic association analyses. Flowchart of the quality control steps and analysis methods for the three discovery-phase genome-wide association studies (GWAS) in the UK Biobank, 23andMe, and FinnGen, followed by replication in the Million Veteran Program.
Extended Data Figure 2.
MPN GWAS cohort-specific effect sizes. a, Forest plot displaying cohort-specific odds ratios for lead variants of the 17 loci reaching genome-wide significance after replication. Sample sizes are: UKBB, n = 1,086 cases and 407,155 controls; 23andMe, n = 1,223 cases and 252,140 controls; FinnGen, n = 640 cases and 176,259 controls; MVP, n = 848 cases and 317,423 controls. Data represent odds ratios and 95% confidence intervals. b, Overall correlation of effect sizes between MVP cohort and combined discovery cohort (UKBB + 23andMe + FinnGen) for all 24 variants reaching suggestive significance (p < 1×10⁻⁶) which underwent replication (p = 3.76 × 10⁻⁵, two-tailed Pearson correlation). c, Forest plot displaying cohort-specific odds ratios for lead variants of the three most significant loci in the meta-analysis: the JAK2 46/1 haplotype and two independent signals at the TERT locus. MVP_jak2 = JAK2 V617F phenotype in MVP, MVP_jak2_or_mpn = JAK2 V617F or ICD-based MPN definition in MVP. Data are odds ratios and 95% confidence intervals. Sample sizes are: UKBB, n = 1,086 cases and 407,155 controls; 23andMe, n = 1,223 cases and 252,140 controls; FinnGen, n = 640 cases and 176,259 controls; MVP_jak2, n = 848 cases and 317,423 controls; MVP_jak2_or_mpn, n = 2,203 cases and 218,607 controls.
Extended Data Figure 3.
Assessing the distribution and prevalence of MPN polygenic risk score in UK Biobank. a, Density distribution of the MPN polygenic risk score (PRS) within the UK Biobank. b, Receiver operating characteristic curves for MPN predictions (n = 1,086 cases and 407,155 controls), using information from age, sex, genotyping array, and ancestry-informed principal components (AUC2, blue) alone, or with the addition of PRS (AUC1, orange). c, Odds ratio (mean and 95% confidence interval) for MPN acquisition according to deciles of the PRS (n = 1,086 cases and 407,155 controls), with decile 1 (10% of individuals with lowest PRS) as the reference group. d, Prevalence of MPN within each decile of the PRS in the UK Biobank population (n = 1,086 MPN cases, 407,155 controls). e, MPN cases and controls in the UK Biobank were stratified into three groups according to their PRS – low, intermediate, or high defined as the lowest quintile, the middle three quintiles, and the highest quintile of the PRS distribution respectively. For carriers and noncarriers of the JAK2 46/1 haplotype, the odds ratio for MPN was calculated in a logistic regression model with PRS group, age, sex, and the top ten principal components of ancestry as covariates. Non-carriers with intermediate PRS served as the reference group. Data are odds ratios and 95% confidence intervals. f, Fine-mapped 95% credible sets for all 25 MPN risk loci reaching suggestive significance, stratified by the number of variants comprising each credible set. g, The fine-mapped posterior probability of causality for the highest fine-mapped variant in each locus credible set. h, Variants within the 95% credible sets and posterior probability (PP) > 0.001 across all regions, grouped by genomic annotation.
Extended Data Figure 4.
Shared genetic associations between MPN risk and other phenotypes. a, Schematic depicting the trajectory of undifferentiated hematopoietic stem and progenitor cells (HSPCs) into various committed cell types: lymphocytes (LYMPH), monocytes (MONO), neutrophils (NEUT), basophils (BASO), eosinophils (EO), red blood cells (RBC), and platelets (PLT). b, Regional association plots at the TERT locus (+/− 50kb from lead variant), showing the associations of variants with leukocyte telomere length and MPN. The colors of the points depict pairwise linkage disequilibrium (r2) to sentinel variant rs7705526. The two conditionally independent lead variants for both traits, rs7705526 and rs2853677, are labeled. c, Individual SNPs associated with telomere length and their effect sizes on MPN risk (n = 2,949 cases and 835,554 controls), calculated using the fixed effects meta-analysis method. Aggregate mendelian randomization (MR) effects, calculated from three different methods (weighted median, inverse-variance weighted, and Egger regression), are shown at the bottom. Data are MR effect sizes and standard errors. Red color indicates significance. d, MR leave-one-out sensitivity analysis, showing MR effect estimates using the inverse variance weighted approach after excluding each individual SNP from the analysis (n = 2,949 cases and 835,554 controls). Data are MR effect sizes and standard errors. e, Phenome-wide association study (pheWAS) of MPN risk variants. We tested fine-mapped MPN risk variants (PP > 0.10 or lead variant) for associations with 1,130 well-represented case-control phenotypes from the UK Biobank, calculated by two-tailed logistic mixed model association test. Shown in this heatmap are the top MPN-associated variants at each locus with one or more associations reaching Bonferroni-corrected significance (p = 0.05 / 1130 phenotypes = 4.4 × 10⁻⁵, or abs(z-score) = 4.08). Heatmap color indicates association z-score. All variant effects are oriented with respect to the risk-increasing MPN allele. Phenotypes are divided into major clinical categories, as listed in the annotations above the heatmap.
Extended Data Figure 5.
Characterizing MPN target genes. a, Target genes prioritized based on non-coding criteria (red boxes) and coding consequences (blue boxes) and scored based on the number of criteria met. Only the highest scoring gene per locus is reported, and for non-coding loci, only genes with a score of 2 or more are reported. b, Average expression (log2 counts per million) of MPN target genes (n = 15) across 16 primary hematopoietic cell types. Black diamonds indicate the mean expression of all non-zero expressed protein-coding genes in each cell type. Box plots show the median at the center, with the top and bottom of the box indicating the interquartile range. Whiskers extend to either the maximum/minimum value or 1.5x the interquartile range. c, Protein-protein interaction network showing known and predicted associations between the protein products of MPN target genes, generated with STRING database. d, Top-enriched biological annotations for MPN target genes identify key pathways associated with hematopoiesis and oncogenesis.
Extended Data Figure 6.
Structural basis for CHK2 homodimer disruption by Isoleucine 157 mutation. a, The crystal structure of the CHK2 (FHA-Kinase) homodimer (PDB: 3I6U). The FHA domain of molecule A (mol A) is shown in cyan and the kinase domain is colored green. A second CHK2 (mol B) has both domains colored white. The two CHK2 molecules are nearly symmetric – coiling around the central axis (black rod). The location of each Isoleucine 157 residue is marked with an asterisk. b, A zoomed window showing details of the interactions. I157 links the FHA of one CHK2 molecule (white) to the kinase domain of a second (green). The side chain of I157 mediates an FHA-Kinase hydrophobic interface, interacting with Phenylalanine 238 (F238) and Leucine 236 (L236) on the kinase domain. c, The second interface of the CHK2 dimer (180° rotation from panel b) is nearly identical. A Threonine at position 157 would diminish these hydrophobic interfaces and destabilize the CHK2 dimer, as has been previously reported.
Extended Data Figure 7.
CHEK2 is required for apoptosis of cycling HSPCs, but not for lineage commitment. a, Assessment of IR-induced cell death of cycling HSPCs and myeloid progenitors (CMP, common myeloid progenitor; GMP, granulocyte-monocyte progenitor; MEP, megakaryocyte-erythroid progenitor) following sublethal irradiation, after treatment with CHEK2 inhibitor (n = 3) or dimethylsulfoxide control (n = 3) (two-sided paired t-test). n is the number of biologically independent experiments. Data are mean ± s.e.m. b, Numbers (left) and percent (right) of HSPC colonies formed following CHEK2 inhibition (CHEK2 inhibitor II, Sigma 220486) (n = 4) vs. dimethylsulfoxide (DMSO) control (n = 4). n is the number of biologically independent experiments. Data are mean ± s.e.m. CFU-M, colony forming unit-macrophage; CFU-GM, granulocyte macrophage; CFU-GEMM, granulocyte erythrocyte macrophage megakaryocyte; CFU-G, granulocyte; BFU-E, burst forming unit-erythroid.
Extended Data Figure 8.
Supplementary data for variant-to-function studies at GFI1B locus. a, Map of the lentiviral constructs designed to assess enhancer activity at rs524137. b, Histogram displays GFP mean fluorescence intensity (MFI) of hematopoietic K562 cells infected with Promoter only vs Promoter and Enhancer lentiviral constructs. Compared to mock uninfected control cells, cells infected with the construct carrying both GFI1B promoter and enhancer show greater GFP intensity. c, FACS gating for sorting and identifying the primitive CD34+CD45RACD90+CD133+EPCR+ITGA3+ LT-HSC population in day 7 CD34+ HSPCs presented in Fig. 4g, h, i. d, Schematic of colony-replating assays using human HSPCs edited with GFI1B coding (CDS) and enhancer guides (ENH). e, Representative western blot measuring GFI1B protein expression 5 days following CRISPR/Cas9 targeting with non-targeting control (NT), or coding regions of GFI1B (g1, g2). LaminB expression used as loading control. LaminB controls was probed on the same blot as the GFI1B. Similar results were obtained in 3 independent experiments. For gel source data, see Supplementary Fig. 3.
Extended Data Figure 9.
Schematics illustrating the variant-to-function arcs for MPN risk loci at (a) CHEK2 and (b) GFI1B demonstrated in this study.
Figure 1.
Figure 1.. Genetic architecture of inherited MPN risk.
a, Manhattan plot and quantile-quantile (QQ) plot illustrating results of the genome-wide association study (GWAS) meta-analysis for MPNs (n = 2,949 cases and 835,554 controls). X axis is chromosomal position, and y axis is the −log10(P) value of association (two-tailed, logistic regression). Association signals reaching genome-wide significance (P < 5 × 10⁻⁸) and suggestive significance (P < 1 × 10⁻⁶) are shown in blue and green, respectively. Red points represent conditionally independent lead variants within each locus. Labels correspond to target gene if present (Fig. 3a), or otherwise the nearest gene at each association locus (+/− 500 kb). The QQ plot illustrates the deviation of association test statistics (points) from the distribution expected under the null hypothesis (line). b, Polygenic risk score (PRS) percentile among MPN cases (n = 1,086) versus controls (n = 407,155) in the UK Biobank test set. Box plots show the median as the line in the notch, with the top and bottom of the box indicating the interquartile range. Whiskers extend to the maximum or minimum value. Notches indicate the 95% confidence interval of the medians. c, Additional variance in MPN risk (n = 1,086 cases and 407,155 controls) explained by PRS compared to age, sex, genotyping array, and top 10 principal components of genetic relatedness. d, Odds ratio for MPN acquisition (n = 1,086 cases and 407,155 controls) stratified by deciles of the PRS, with the 5th decile as the reference. Data represent odds ratios and 95% confidence intervals.
Figure 2.
Figure 2.. Functional enrichments in MPN risk.
a, Genetic correlations (± standard errors) between MPN risk (n = 2,949 cases and 835,554 controls) and 19 blood traits (n = 408,241), estimated by LDSC. WBC, white blood cell count; RETIC, reticulocyte count; RDW, red cell distribution width; RBC, red blood cell count; PLT CRIT, platelet crit; PLT, platelet count; PDW, platelet distribution width; NEUTRO, neutrophil count; MRV, mean reticulocyte volume; MPV, mean platelet volume; MONO, monocyte count; MCV, mean corpuscular volume; MCHC, mean corpuscular hemoglobin concentration; MCH, mean corpuscular hemoglobin; LYMPH, lymphocyte count; HGB, hemoglobin; HCT, hematocrit; EO, eosinophil count; BASO, basophil count. Red color indicates false discovery rate-adjusted p < 0.05. b, Proportion of MPN risk variants with fine-mapped posterior probability (PP) > 0.10 vs. PP < 0.10 that exhibit pleiotropic associations with traits from two or more hematopoietic lineages (basophil, eosinophil, neutrophil, red blood cell, platelet, monocyte, lymphocyte). c-d, g-chromVAR and LD score regression results for the enrichment of MPN risk variants across 18 hematopoietic chromatin accessibility profiles. e, Correlation of GWAS effect sizes (z-scores) of variants in the TERT locus for MPN vs. telomere length (p < 2.2 × 10⁻¹⁶, two-tailed Pearson correlation). The dashed line is the line of best fit. Orange color indicates variants with association P < 5 × 10⁻⁸ in both the MPN and telomere length GWAS. f, Mendelian randomization (MR) plot showing LD-independent telomere length GWAS variants (p < 1 × 10⁻⁵, r2 < 0.001) and their effects on MPN risk (outcome) versus telomere length (exposure). Lines represent slopes of three regression tests: MR-Egger (p = 4.83 × 10⁻⁵), inverse-variance weighted (p = 1.36 × 10⁻⁴), and weighted median (p = 1.15 × 10⁻⁵). Data represent MR effect sizes ± standard error.
Figure 3.
Figure 3.. Target genes for MPN risk.
a, Heatmap of 15 MPN target genes, visualizing RNA expression across 16 hematopoietic populations. Bar plot depicts the enrichment of target gene expression in each cell type (two-tailed rank-sum permutation test). Genes with known involvement in hematopoietic stem cell function are boxed in red. b-c, UMAP projections of 278,978 single cells from human bone marrow, colored according to (b) HSC and (c) MPN target gene signatures.
Figure 4.
Figure 4.. Characterizing the mechanisms of two MPN risk variants.
a, Expansion of Lin-CD34+ derived hematopoietic stem and progenitor cells (HSPCs) after short hairpin RNA knockdown of CHEK2 vs. control (CHEK2, n = 4; control, n = 9). b, rs1633768 and rs524137 fall in a region of hematopoietic accessible chromatin downstream of GFI1B. A locus plot is shown above, plotting -log10(p) of MPN association; color reflects linkage disequilibrium to rs524137. c, Luciferase reporter assay testing regulatory activity of genomic regions containing rs1622768 and rs524137 in hematopoietic cells compared to a minimal promoter (MinP) construct (n = 3). d, Lentiviral reporter assays testing allele-specific activity of rs524137 in hematopoietic cells (n = 3). e, HSC chromatin accessibility around rs524137 and the two CRISPR-Cas9 guide RNA pairs (ENH1 and ENH2) used to delete this region. f, Frequency of uncut and edited alleles after editing of GFI1B enhancer or control AAVS1 site in human CD34+ HSPCs (n = 6). g, GFI1B expression in bulk HSPCs and sorted phenotypic long-term HSCs (LT-HSCs) following GFI1B enhancer deletion (n = 12) compared to AAVS1 editing (n = 6). Due to similar editing outcomes, ENH1 and ENH2 were combined as ENH in this and subsequent experiments. h, Total number of phenotypic LT-HSCs in HSC maintenance culture, 6 days after editing of GFI1B enhancer (n = 6) or AAVS1 (n = 3). i, Relative expansion of cell numbers in various compartments (All cells, CD34+, and LT-HSCs) upon GFI1B enhancer deletion (n = 6) compared to AAVS1 controls (n = 3). j, GFI1B coding disruption (CDS_g1 and CDS_g2, n = 3 each) leads to reduced erythroid primary colony formation compared to non-targeting (NT) control (n = 3), but increases secondary colony formation. CFU-M, colony forming unit-macrophage; CFU-GM, granulocyte macrophage; CFU-GEMM, granulocyte erythrocyte macrophage megakaryocyte; CFU-G, granulocyte; BFU-E, burst forming unit-erythroid. k, GFI1B enhancer deletion increases secondary colony formation without affecting erythroid colony formation (n = 3). l, Representative images of primary (top) and secondary (bottom) CFU-C colonies. Data from a, c-d, f-k are means ± s.e.m. n denotes the number of biologically independent replicates. Statistical methods used were two-tailed unpaired t-test (c, d, g, h) and two-tailed paired t-test (i).

References

    1. Sud A et al. Familial risks of acute myeloid leukemia, myelodysplastic syndromes, and myeloproliferative neoplasms. Blood 132, 973 (2018). - PMC - PubMed
    1. Landgren O et al. Increased risks of polycythemia vera, essential thrombocythemia, and myelofibrosis among 24,577 first-degree relatives of 11,039 patients with myeloproliferative neoplasms in Sweden. Blood 112, 2199–2204, doi:10.1182/blood-2008-03-143602 (2008). - DOI - PMC - PubMed
    1. Brewer HR, Jones ME, Schoemaker MJ, Ashworth A & Swerdlow AJ Family history and risk of breast cancer: an analysis accounting for family structure. Breast cancer research and treatment 165, 193–200, doi:10.1007/s10549-017-4325-2 (2017). - DOI - PMC - PubMed
    1. Albright F et al. Prostate cancer risk prediction based on complete prostate cancer family history. The Prostate 75, 390–398, doi:10.1002/pros.22925 (2014). - DOI - PMC - PubMed
    1. Johns LE & Houlston RS A systematic review and meta-analysis of familial colorectal cancer risk. American Journal Of Gastroenterology 96, 2992, doi:10.1111/j.1572-0241.2001.04677.x (2001). - DOI - PubMed

Publication types