Genes regulating membrane-associated E-cadherin and proliferation in adenomatous polyposis coli mutant colon cancer cells: High content siRNA screen
- PMID: 33057364
- PMCID: PMC7561197
- DOI: 10.1371/journal.pone.0240746
Genes regulating membrane-associated E-cadherin and proliferation in adenomatous polyposis coli mutant colon cancer cells: High content siRNA screen
Abstract
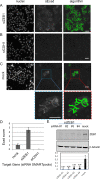
Truncating mutations in the tumour suppressor gene APC occur frequently in colorectal cancers and result in the deregulation of Wnt signalling as well as changes in cell-cell adhesion. Using quantitative imaging based on the detection of membrane-associated E-cadherin, we undertook a protein coding genome-wide siRNA screen to identify genes that regulate cell surface E-cadherin in the APC-defective colorectal cancer cell line SW480. We identified a diverse set of regulators of E-cadherin that offer new insights into the regulation of cell-cell adhesion, junction formation and genes that regulate proliferation or survival of SW480 cells. Among the genes whose depletion promotes membrane-associated E-cadherin, we identified ZEB1, the microRNA200 family, and proteins such as a ubiquitin ligase UBE2E3, CDK8, sorting nexin 27 (SNX27) and the matrix metalloproteinases, MMP14 and MMP19. The screen also identified 167 proteins required for maintaining E-cadherin at cell-cell adherens junctions, including known junctional proteins, CTNND1 and CTNNA1, as well as signalling enzymes, DUSP4 and MARK2, and transcription factors, TEAD3, RUNX2 and TRAM2. A better understanding of the post-translational regulation of E-cadherin provides new opportunities for restoring cell-cell adhesion in APC-defective cells.
Conflict of interest statement
The authors have declared that no competing interests exist.
Figures


Similar articles
-
Restoration of full-length adenomatous polyposis coli (APC) protein in a colon cancer cell line enhances cell adhesion.J Cell Sci. 2004 Jan 26;117(Pt 3):427-39. doi: 10.1242/jcs.00862. Epub 2003 Dec 16. J Cell Sci. 2004. PMID: 14679305
-
Novel colon cancer cell lines leading to better understanding of the diversity of respective primary cancers.Oncogene. 2002 Jul 11;21(30):4646-62. doi: 10.1038/sj.onc.1205577. Oncogene. 2002. PMID: 12096341
-
Zinc stabilizes adenomatous polyposis coli (APC) protein levels and induces cell cycle arrest in colon cancer cells.J Cell Biochem. 2004 Oct 1;93(2):345-57. doi: 10.1002/jcb.20156. J Cell Biochem. 2004. PMID: 15368361
-
Cytoskeleton out of the cupboard: colon cancer and cytoskeletal changes induced by loss of APC.Nat Rev Cancer. 2006 Dec;6(12):967-74. doi: 10.1038/nrc2010. Epub 2006 Nov 9. Nat Rev Cancer. 2006. PMID: 17093505 Review.
-
The role of the E-cadherin/catenin complex in gastrointestinal cancer.Acta Gastroenterol Belg. 1999 Oct-Dec;62(4):393-402. Acta Gastroenterol Belg. 1999. PMID: 10692769 Review.
Cited by
-
The Role of CTNNA1 in Malignancies: An Updated Review.J Cancer. 2023 Jan 1;14(2):219-230. doi: 10.7150/jca.79236. eCollection 2023. J Cancer. 2023. PMID: 36741258 Free PMC article. Review.
-
Role of MARK2 in the nervous system and cancer.Cancer Gene Ther. 2024 Apr;31(4):497-506. doi: 10.1038/s41417-024-00737-z. Epub 2024 Feb 2. Cancer Gene Ther. 2024. PMID: 38302729 Review.
-
Molecular mechanism for strengthening E-cadherin adhesion using a monoclonal antibody.Proc Natl Acad Sci U S A. 2022 Aug 9;119(32):e2204473119. doi: 10.1073/pnas.2204473119. Epub 2022 Aug 3. Proc Natl Acad Sci U S A. 2022. PMID: 35921442 Free PMC article.
-
Engineering the Interactions of Classical Cadherin Cell-Cell Adhesion Proteins.J Immunol. 2023 Aug 1;211(3):343-349. doi: 10.4049/jimmunol.2300098. J Immunol. 2023. PMID: 37459190 Free PMC article. Review.
-
Integrated Multi-Level Investigation of Friend Leukemia Integration 1 Transcription Factor as a Novel Immune-Inflammatory Biomarker in Rheumatoid Arthritis: Bridging Bioinformatics, Clinical Cohorts, and Mechanistic Validation.J Inflamm Res. 2025 Mar 3;18:3105-3123. doi: 10.2147/JIR.S507941. eCollection 2025. J Inflamm Res. 2025. PMID: 40059948 Free PMC article.
References
-
- Brabletz T, Jung A, Reu S, Porzner M, Hlubek F, Kunz-Schughart LA, et al. Variable beta-catenin expression in colorectal cancers indicates tumor progression driven by the tumor environment. Proceedings of the National Academy of Sciences of the United States of America. 2001;98(18):10356–61. 10.1073/pnas.171610498 - DOI - PMC - PubMed
Publication types
MeSH terms
Substances
LinkOut - more resources
Full Text Sources
Medical
Miscellaneous

