

Reduction in social learning and increased policy uncertainty about harmful intent is associated with pre-existing paranoid beliefs: Evidence from modelling a modified serial dictator game
- PMID: 33057428
- PMCID: PMC7591074
- DOI: 10.1371/journal.pcbi.1008372
Reduction in social learning and increased policy uncertainty about harmful intent is associated with pre-existing paranoid beliefs: Evidence from modelling a modified serial dictator game
Abstract
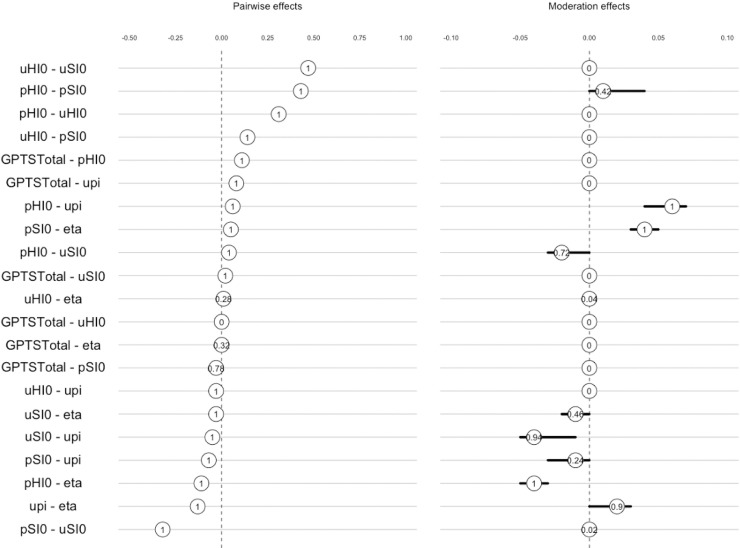
Current computational models suggest that paranoia may be explained by stronger higher-order beliefs about others and increased sensitivity to environments. However, it is unclear whether this applies to social contexts, and whether it is specific to harmful intent attributions, the live expression of paranoia. We sought to fill this gap by fitting a computational model to data (n = 1754) from a modified serial dictator game, to explore whether pre-existing paranoia could be accounted by specific alterations to cognitive parameters characterising harmful intent attributions. We constructed a 'Bayesian brain' model of others' intent, which we fitted to harmful intent and self-interest attributions made over 18 trials, across three different partners. We found that pre-existing paranoia was associated with greater uncertainty about other's actions. It moderated the relationship between learning rates and harmful intent attributions, making harmful intent attributions less reliant on prior interactions. Overall, the magnitude of harmful intent attributions was directly related to their uncertainty, and importantly, the opposite was true for self-interest attributions. Our results explain how pre-existing paranoia may be the result of an increased need to attend to immediate experiences in determining intentional threat, at the expense of what is already known, and more broadly, they suggest that environments that induce greater probabilities of harmful intent attributions may also induce states of uncertainty, potentially as an adaptive mechanism to better detect threatening others. Importantly, we suggest that if paranoia were able to be explained exclusively by core domain-general alterations we would not observe differential parameter estimates underlying harmful-intent and self-interest attributions.
Conflict of interest statement
The authors have declared that no competing interests exist.
Figures
Similar articles
-
The computational relationship between reinforcement learning, social inference, and paranoia.PLoS Comput Biol. 2022 Jul 25;18(7):e1010326. doi: 10.1371/journal.pcbi.1010326. eCollection 2022 Jul. PLoS Comput Biol. 2022. PMID: 35877675 Free PMC article.
-
Paranoia and the social representation of others: a large-scale game theory approach.Sci Rep. 2017 Jul 3;7(1):4544. doi: 10.1038/s41598-017-04805-3. Sci Rep. 2017. PMID: 28674445 Free PMC article.
-
Paranoia, sensitization and social inference: findings from two large-scale, multi-round behavioural experiments.R Soc Open Sci. 2020 Mar 11;7(3):191525. doi: 10.1098/rsos.191525. eCollection 2020 Mar. R Soc Open Sci. 2020. PMID: 32269791 Free PMC article.
-
Psychological processes and paranoia: implications for forensic behavioural science.Behav Sci Law. 2006;24(3):277-94. doi: 10.1002/bsl.718. Behav Sci Law. 2006. PMID: 16773623 Review.
-
The paranoid person: a biopsychosocial perspective.Arch Psychiatr Nurs. 1990 Jun;4(3):176-81. doi: 10.1016/0883-9417(90)90006-7. Arch Psychiatr Nurs. 1990. PMID: 2196851 Review.
Cited by
-
D2/D3 dopamine supports the precision of mental state inferences and self-relevance of joint social outcomes.Nat Ment Health. 2024;2(5):562-573. doi: 10.1038/s44220-024-00220-6. Epub 2024 Apr 5. Nat Ment Health. 2024. PMID: 38746690 Free PMC article.
-
Everything is connected: Inference and attractors in delusions.Schizophr Res. 2022 Jul;245:5-22. doi: 10.1016/j.schres.2021.07.032. Epub 2021 Aug 9. Schizophr Res. 2022. PMID: 34384664 Free PMC article.
-
Paranoia, self-deception and overconfidence.PLoS Comput Biol. 2021 Oct 7;17(10):e1009453. doi: 10.1371/journal.pcbi.1009453. eCollection 2021 Oct. PLoS Comput Biol. 2021. PMID: 34618805 Free PMC article.
-
Jumping to attributions during social evaluation.Sci Rep. 2024 Jul 4;14(1):15447. doi: 10.1038/s41598-024-65704-y. Sci Rep. 2024. PMID: 38965391 Free PMC article.
-
Impressions about harm are formed rapidly and then refined, modulated by serotonin.Soc Cogn Affect Neurosci. 2024 Oct 23;19(1):nsae078. doi: 10.1093/scan/nsae078. Soc Cogn Affect Neurosci. 2024. PMID: 39460542 Free PMC article. Clinical Trial.
References
-
- Stein F, Lemmer G, Schmitt S, Brosch K, Meller T, Fischer E, et al. Factor analyses of multidimensional symptoms in a large group of patients with major depressive disorder, bipolar disorder, schizoaffective disorder and schizophrenia. Schizophrenia Research. 2020 - PubMed
-
- Voce A, Calabria B, Burns R, Castle D, McKetin R. A systematic review of the symptom profile and course of methamphetamine-associated psychosis: substance use and misuse. Substance use & misuse. 2019;54(4):549–559. - PubMed
Publication types
MeSH terms
Grants and funding
LinkOut - more resources
Full Text Sources
Miscellaneous
