

A model-based evaluation of the efficacy of COVID-19 social distancing, testing and hospital triage policies
- PMID: 33057438
- PMCID: PMC7591016
- DOI: 10.1371/journal.pcbi.1008388
A model-based evaluation of the efficacy of COVID-19 social distancing, testing and hospital triage policies
Abstract
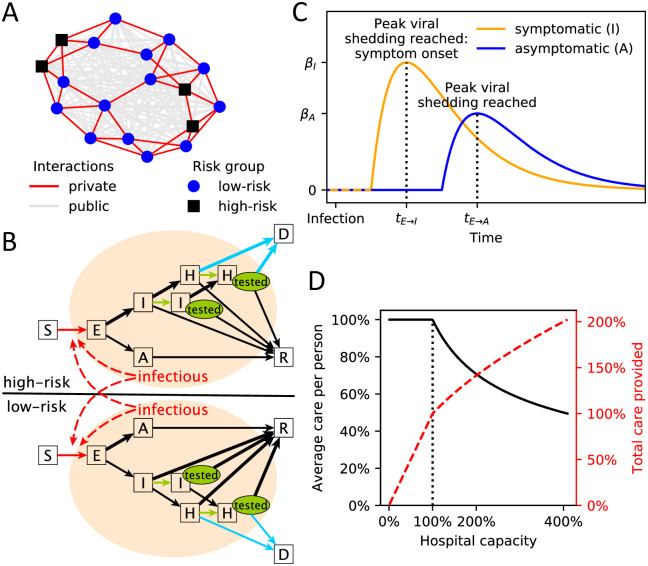
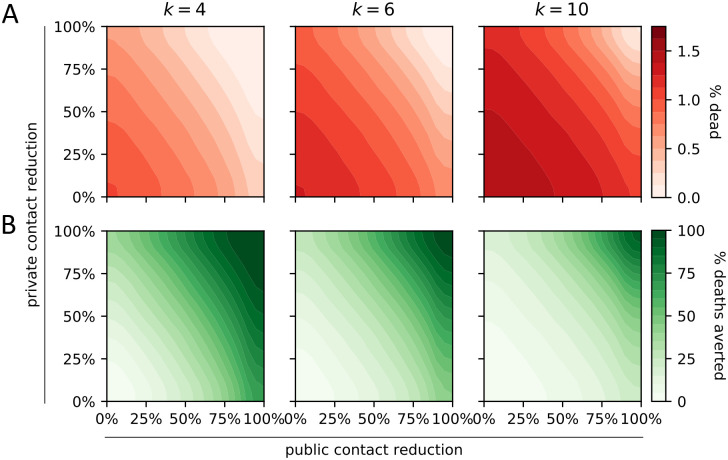
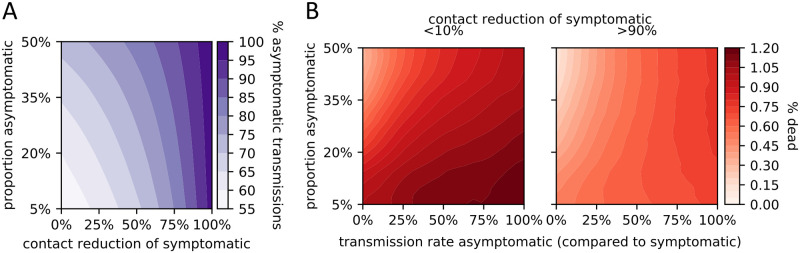
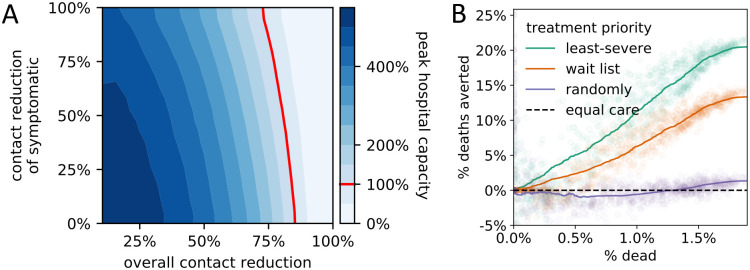
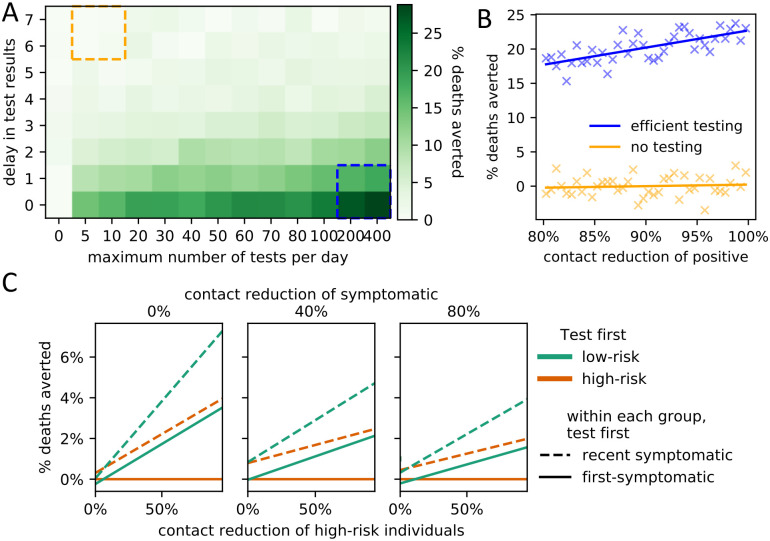
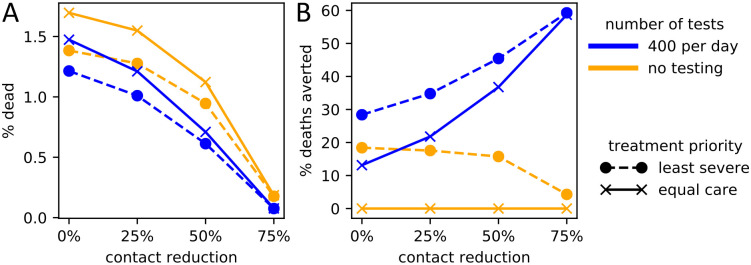
A stochastic compartmental network model of SARS-CoV-2 spread explores the simultaneous effects of policy choices in three domains: social distancing, hospital triaging, and testing. Considering policy domains together provides insight into how different policy decisions interact. The model incorporates important characteristics of COVID-19, the disease caused by SARS-CoV-2, such as heterogeneous risk factors and asymptomatic transmission, and enables a reliable qualitative comparison of policy choices despite the current uncertainty in key virus and disease parameters. Results suggest possible refinements to current policies, including emphasizing the need to reduce random encounters more than personal contacts, and testing low-risk symptomatic individuals before high-risk symptomatic individuals. The strength of social distancing of symptomatic individuals affects the degree to which asymptomatic cases drive the epidemic as well as the level of population-wide contact reduction needed to keep hospitals below capacity. The relative importance of testing and triaging also depends on the overall level of social distancing.
Conflict of interest statement
The authors have declared that no competing interests exist.
Figures
Similar articles
-
Determining the optimal strategy for reopening schools, the impact of test and trace interventions, and the risk of occurrence of a second COVID-19 epidemic wave in the UK: a modelling study.Lancet Child Adolesc Health. 2020 Nov;4(11):817-827. doi: 10.1016/S2352-4642(20)30250-9. Epub 2020 Aug 3. Lancet Child Adolesc Health. 2020. PMID: 32758453 Free PMC article.
-
Social distancing measures to control the COVID-19 pandemic: potential impacts and challenges in Brazil.Cien Saude Colet. 2020 Jun;25(suppl 1):2423-2446. doi: 10.1590/1413-81232020256.1.10502020. Epub 2020 Apr 22. Cien Saude Colet. 2020. PMID: 32520287 Review. English, Portuguese.
-
Impact of self-imposed prevention measures and short-term government-imposed social distancing on mitigating and delaying a COVID-19 epidemic: A modelling study.PLoS Med. 2020 Jul 21;17(7):e1003166. doi: 10.1371/journal.pmed.1003166. eCollection 2020 Jul. PLoS Med. 2020. PMID: 32692736 Free PMC article.
-
Severe Acute Respiratory Syndrome Coronavirus 2 Transmission Potential, Iran, 2020.Emerg Infect Dis. 2020 Aug;26(8):1915-1917. doi: 10.3201/eid2608.200536. Epub 2020 Apr 22. Emerg Infect Dis. 2020. PMID: 32320641 Free PMC article.
-
AGA Institute Rapid Review and Recommendations on the Role of Pre-Procedure SARS-CoV-2 Testing and Endoscopy.Gastroenterology. 2020 Nov;159(5):1935-1948.e5. doi: 10.1053/j.gastro.2020.07.043. Epub 2020 Jul 28. Gastroenterology. 2020. PMID: 32735862 Free PMC article. Review. No abstract available.
Cited by
-
Modeling and Global Sensitivity Analysis of Strategies to Mitigate Covid-19 Transmission on a Structured College Campus.Bull Math Biol. 2023 Jan 13;85(2):13. doi: 10.1007/s11538-022-01107-2. Bull Math Biol. 2023. PMID: 36637563 Free PMC article.
-
Lessons from countries implementing find, test, trace, isolation and support policies in the rapid response of the COVID-19 pandemic: a systematic review.BMJ Open. 2021 Jun 29;11(7):e047832. doi: 10.1136/bmjopen-2020-047832. BMJ Open. 2021. PMID: 34187854 Free PMC article.
-
Learning from the Italian experience during COVID-19 pandemic waves: be prepared and mind some crucial aspects.Acta Biomed. 2021 May 12;92(2):e2021097. doi: 10.23750/abm.v92i2.11159. Acta Biomed. 2021. PMID: 33988143 Free PMC article. Review.
-
Synergistic interventions to control COVID-19: Mass testing and isolation mitigates reliance on distancing.PLoS Comput Biol. 2021 Oct 28;17(10):e1009518. doi: 10.1371/journal.pcbi.1009518. eCollection 2021 Oct. PLoS Comput Biol. 2021. PMID: 34710096 Free PMC article.
-
On timeline of enhancing testing-capacity of COVID-19: A case study via an optimal replacement model.J Process Control. 2021 Sep;105:204-213. doi: 10.1016/j.jprocont.2021.08.002. Epub 2021 Aug 12. J Process Control. 2021. PMID: 34539099 Free PMC article.
References
-
- Zucker HA. Ventilator Allocation Guidelines. New York State Department of Health; 2015.
-
- Ferguson N, Laydon D, Nedjati Gilani G, Imai N, Ainslie K, Baguelin M, et al. Report 9: Impact of non-pharmaceutical interventions (NPIs) to reduce COVID19 mortality and healthcare demand. Report 9. 2020; 10.25561/77482. - DOI
MeSH terms
LinkOut - more resources
Full Text Sources
Medical
Miscellaneous
