

Quantification of binding affinity of glyconanomaterials with lectins
- PMID: 33057503
- PMCID: PMC7644678
- DOI: 10.1039/d0cc05899h
Quantification of binding affinity of glyconanomaterials with lectins
Abstract
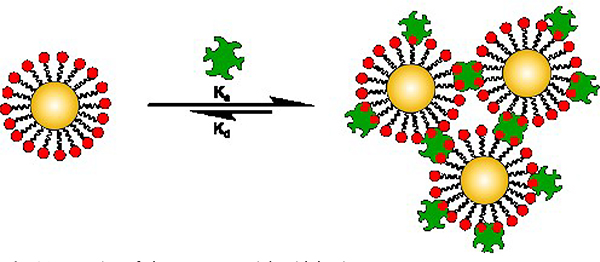
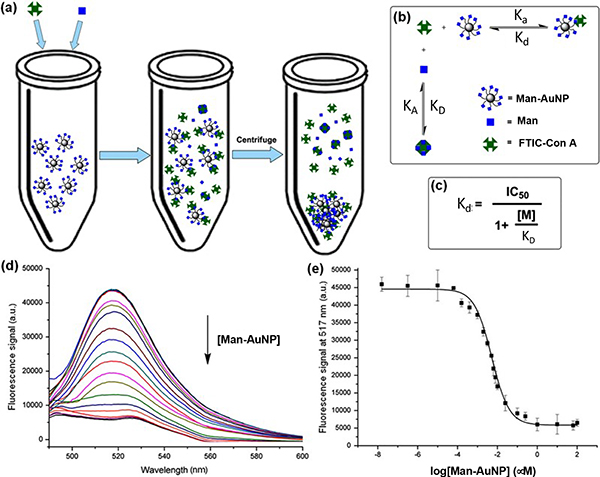
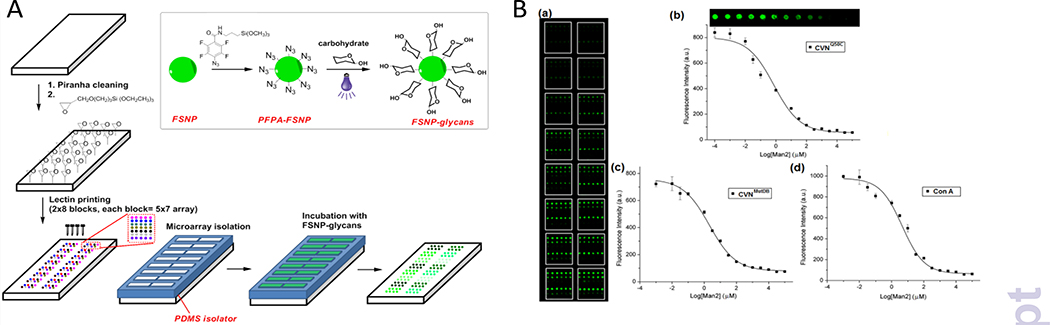
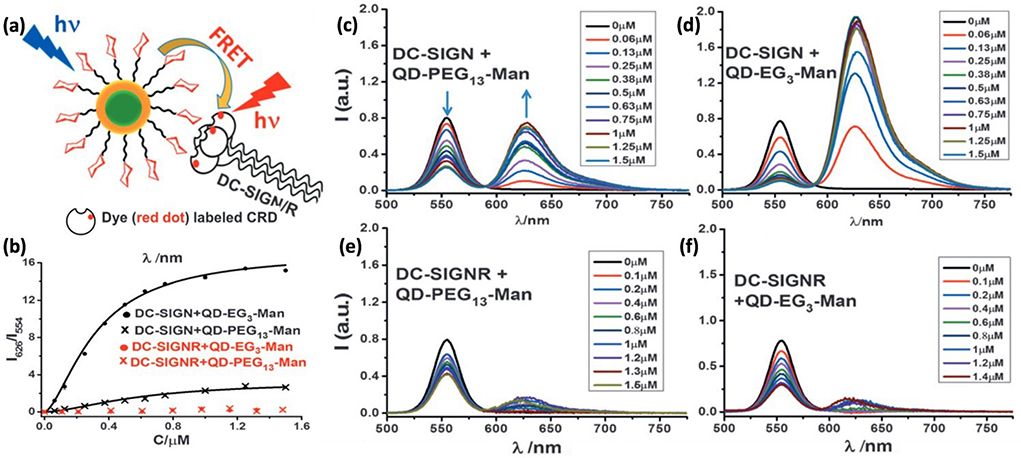
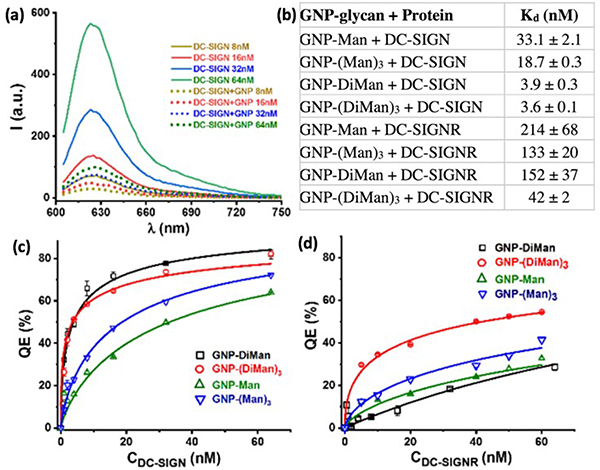
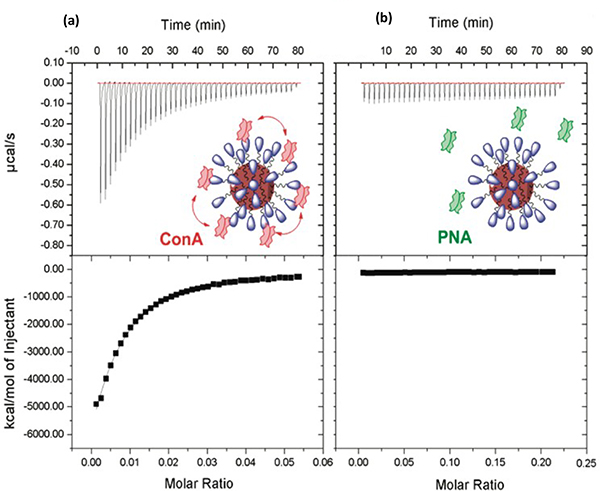
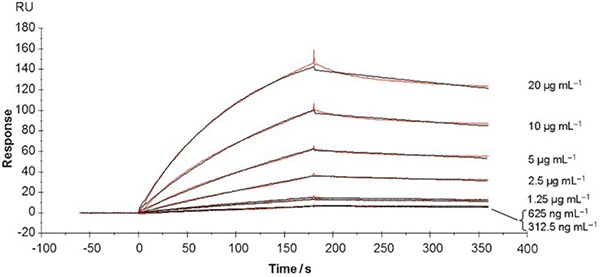
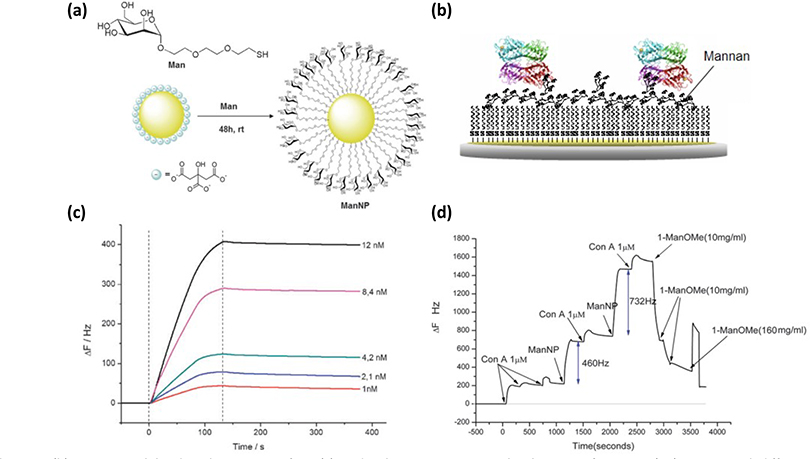
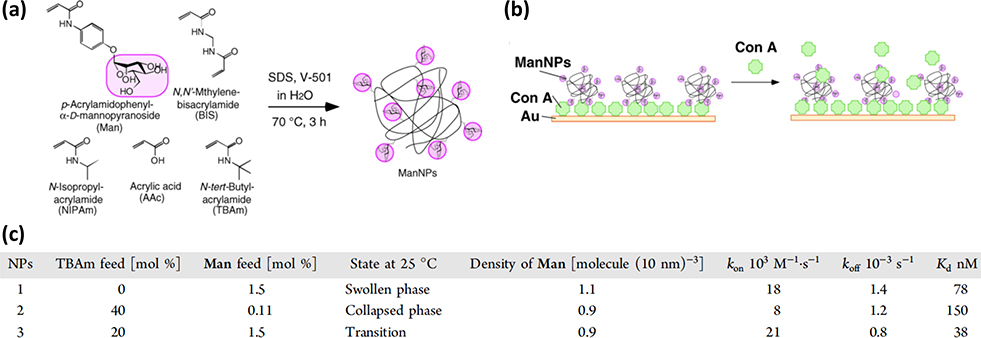
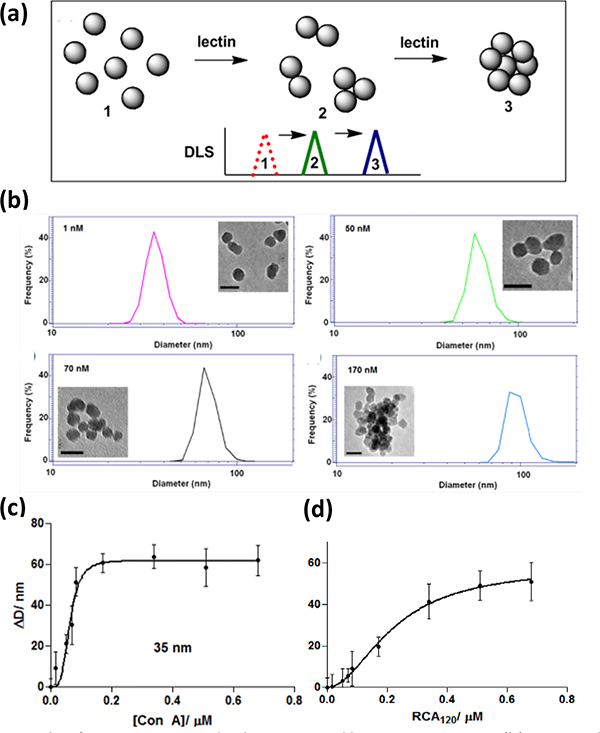
Carbohydrate-mediated interactions are involved in many cellular activities including immune responses and infections. These interactions are relatively weak, and as such, cells employ multivalency, i.e., the presentation of multiple monovalent carbohydrate ligands within a close proximity, for cooperative binding thus drastically enhanced binding affinity. In the past two decades, the field of glyconanomaterials has emerged where nanomaterials are used as multivalent scaffolds to present multiple copies of carbohydrate ligands on the nanomaterial surface. At the core of glyconanomaterial research is the ability to control and modulate multivalency through ligand display. For the quantitative evaluation of multivalency, the binding affinity must be determined. Quantification of the binding parameters provides insights for not only the fundamental glyconanomaterial-lectin interactions, but also the rational design of effective diagnostics and therapeutics. Several methods have been developed to determine the binding affinity of glyconanomaterials with lectins, including fluorescence competitive assays in solution or on microarrays, Förster resonance energy transfer, fluorescence quenching, isothermal titration calorimetry, surface plasmon resonance spectroscopy, quartz crystal microbalance and dynamic light scattering. This Feature Article discusses each of these techniques, as well as how each technique is applied to determine the binding affinity of glyconanomaterials with lectins, and the data analysis. Although the results differed depending on the specific method used, collectively, they showed that nanomaterials as multivalent scaffolds could amplify the binding affinity of carbohydrate-lectin interactions by several orders of magnitude, the extent of which depending on the structure of the carbohydrate ligand, the ligand density, the linker length and the particle size.
Conflict of interest statement
Conflicts of interest
There are no conflicts to declare.
Figures
Similar articles
-
Glyconanomaterials: synthesis, characterization, and ligand presentation.Adv Mater. 2010 May 4;22(17):1946-53. doi: 10.1002/adma.200903908. Adv Mater. 2010. PMID: 20301131 Free PMC article.
-
Quantitative analysis of multivalent ligand presentation on gold glyconanoparticles and the impact on lectin binding.Anal Chem. 2010 Nov 1;82(21):9082-9. doi: 10.1021/ac102114z. Epub 2010 Oct 13. Anal Chem. 2010. PMID: 20942402 Free PMC article.
-
Probing Multivalent Protein-Carbohydrate Interactions by Quantum Dot-Förster Resonance Energy Transfer.Methods Enzymol. 2018;598:71-100. doi: 10.1016/bs.mie.2017.06.012. Epub 2017 Jul 18. Methods Enzymol. 2018. PMID: 29306444
-
Multivalent lectin-carbohydrate interactions energetics and mechanisms of binding.Adv Carbohydr Chem Biochem. 2010;63:139-64. doi: 10.1016/S0065-2318(10)63005-3. Adv Carbohydr Chem Biochem. 2010. PMID: 20381706 Review.
-
Glyconanomaterials for biosensing applications.Biosens Bioelectron. 2016 Feb 15;76:113-30. doi: 10.1016/j.bios.2015.07.031. Epub 2015 Jul 15. Biosens Bioelectron. 2016. PMID: 26212205 Free PMC article. Review.
Cited by
-
Designing Functional Bionanoconstructs for Effective In Vivo Targeting.Bioconjug Chem. 2022 Mar 16;33(3):429-443. doi: 10.1021/acs.bioconjchem.1c00546. Epub 2022 Feb 15. Bioconjug Chem. 2022. PMID: 35167255 Free PMC article. Review.
-
Glycopolymer-Wrapped Carbon Nanotubes Show Distinct Interaction of Carbohydrates With Lectins.Front Chem. 2022 Mar 3;10:852988. doi: 10.3389/fchem.2022.852988. eCollection 2022. Front Chem. 2022. PMID: 35308788 Free PMC article.
-
Polyvalent Glycan Functionalized Quantum Nanorods as Mechanistic Probes for Shape-Selective Multivalent Lectin-Glycan Recognition.ACS Appl Nano Mater. 2023 Mar 14;6(6):4201-4213. doi: 10.1021/acsanm.2c05247. eCollection 2023 Mar 24. ACS Appl Nano Mater. 2023. PMID: 37006911 Free PMC article.
-
From structure to function - Ligand recognition by myeloid C-type lectin receptors.Comput Struct Biotechnol J. 2022 Oct 20;20:5790-5812. doi: 10.1016/j.csbj.2022.10.019. eCollection 2022. Comput Struct Biotechnol J. 2022. PMID: 36382179 Free PMC article. Review.
-
Molecular Tweezers for Biomimetic Recognition of Carbohydrates.Chembiochem. 2025 Jun 3;26(11):e202500123. doi: 10.1002/cbic.202500123. Epub 2025 Mar 27. Chembiochem. 2025. PMID: 40146926 Free PMC article. Review.
References
-
- Costerton JW; Irvin RT; Cheng KJ, The bacterial glycocalyx in nature and disease. Annu. Rev. Microbiol 1981, 35, 299–324. - PubMed
-
- Hoyle BD; Jass J; Costerton JW, The biofilm glycocalyx as a resistance factor. J. Antimicrob. Chemother 1990, 26, 1–5. - PubMed
-
- Karlsson KA, Bacterium-host protein-carbohydrate interactions and pathogenicity. Biochem. Soc. Trans, 1999, 27, 471–4. - PubMed
-
- Tarbell JM; Cancel LM, The glycocalyx and its significance in human medicine. J. Intern. Med 2016, 280, 97–113. - PubMed
Publication types
MeSH terms
Substances
Grants and funding
LinkOut - more resources
Full Text Sources
Miscellaneous