

Preconception Alcohol Exposure Increases the Susceptibility to Diabetes in the Offspring
- PMID: 33057655
- PMCID: PMC7709217
- DOI: 10.1210/endocr/bqaa188
Preconception Alcohol Exposure Increases the Susceptibility to Diabetes in the Offspring
Abstract
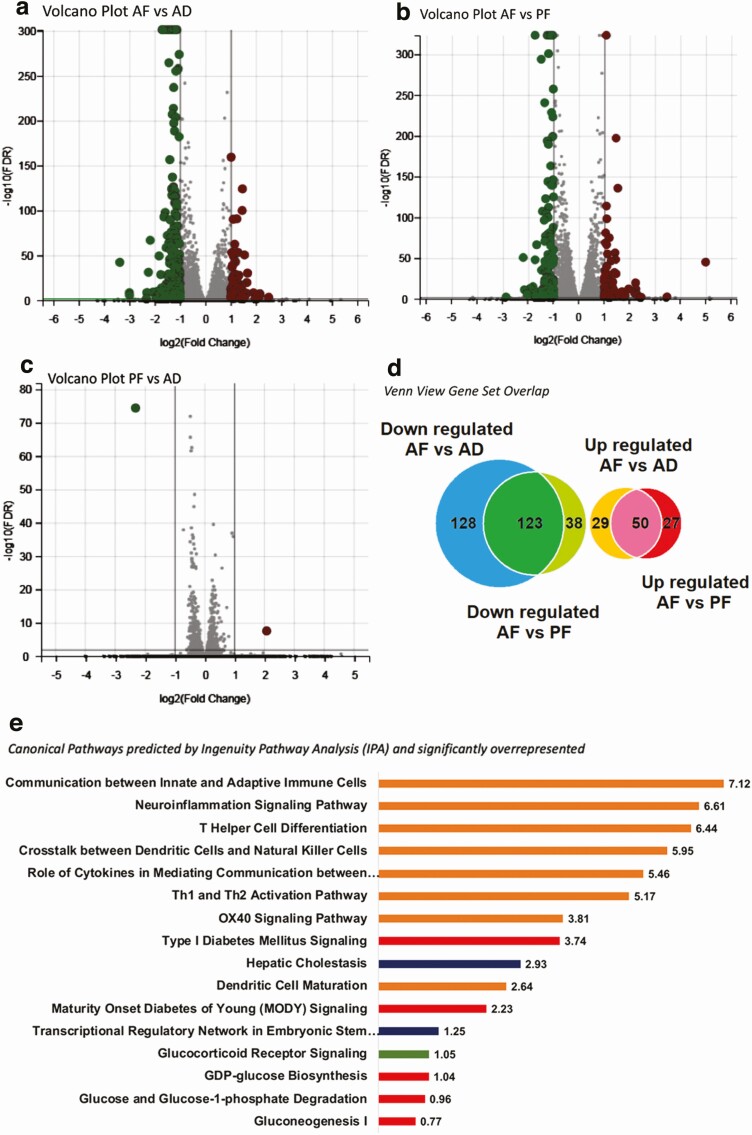
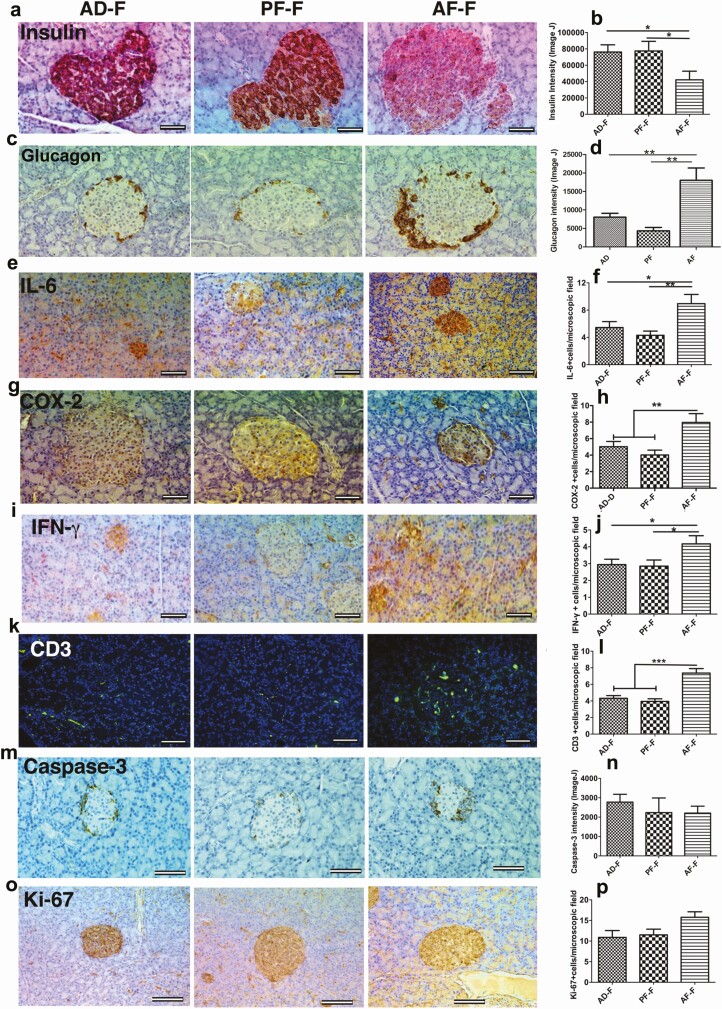
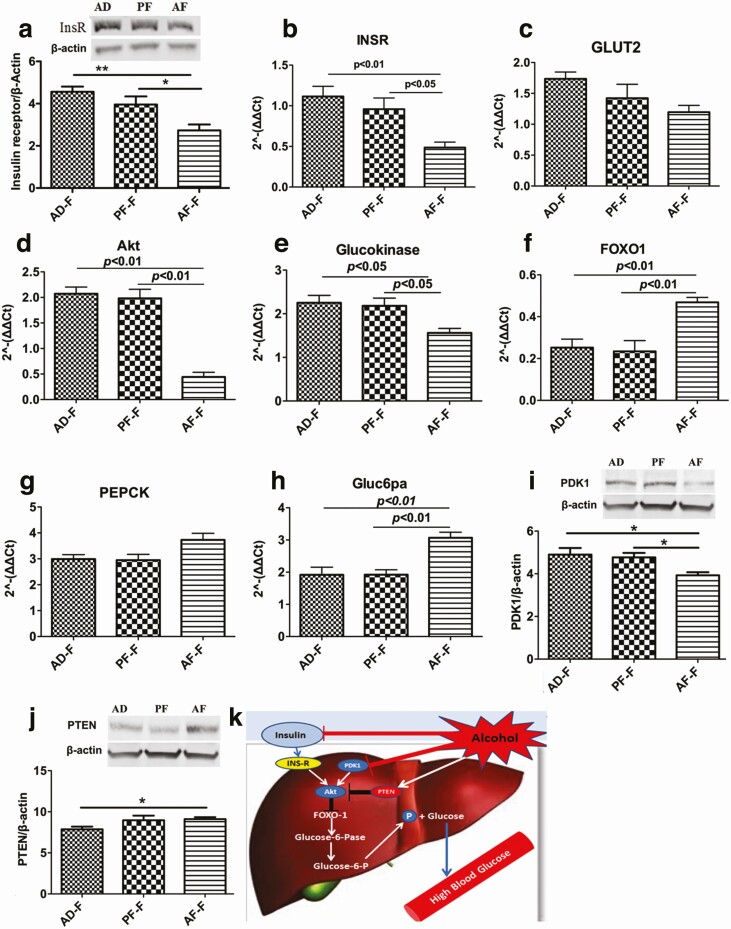
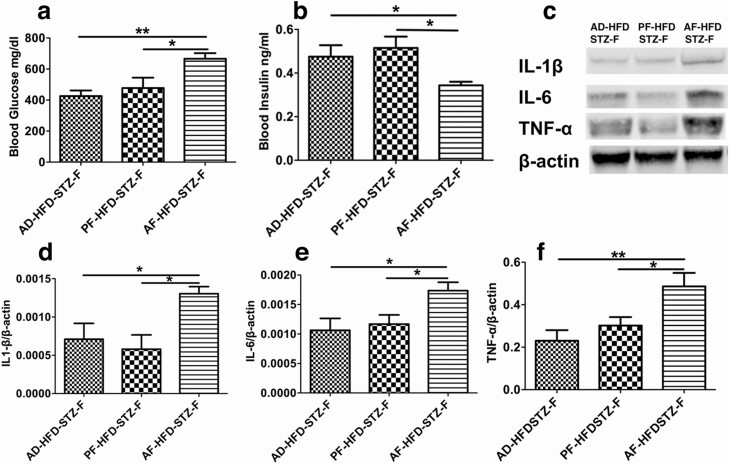
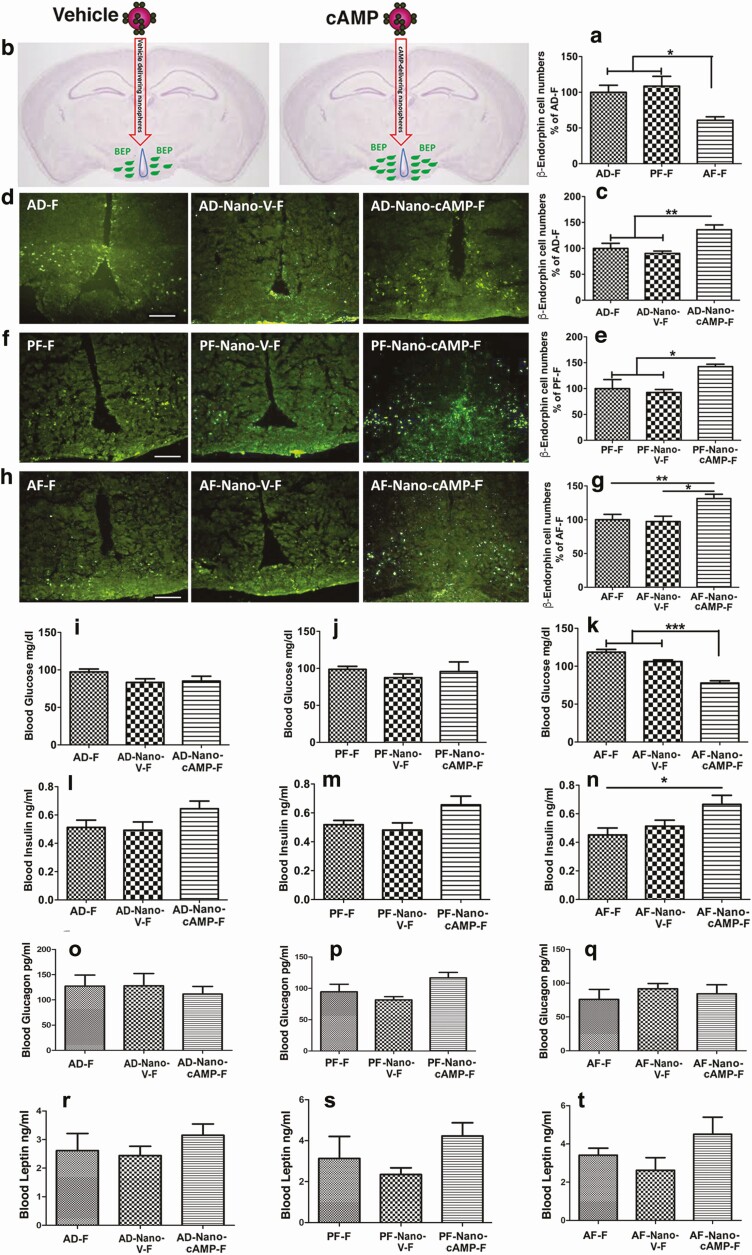
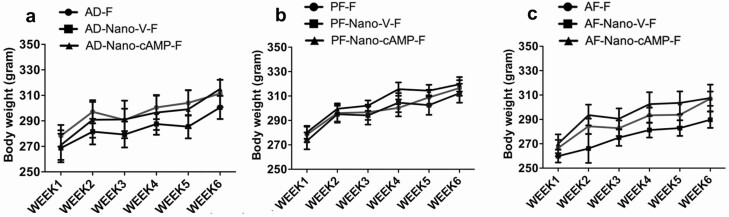
Heavy alcohol drinking alters glucose metabolism, but the inheritability of this effect of alcohol is not well understood. We used an animal model of preconception alcohol exposure in which adult female rats were given free access to 6.7% alcohol in a liquid diet and water for about 4 weeks, went without alcohol for 3 weeks, and then were bred to generate male and female offspring. Control animals were either ad lib-fed rat chow or pair-fed an isocaloric liquid diet during the time of alcohol-feeding in the experimental animals. Our results show that the female rats fed with alcohol in the liquid diet, but not with the isocaloric liquid diet, prior to conception had an altered stress gene network involving glucose metabolism in oocytes when compared with those in ad lib-fed chow diet controls. The offspring born from preconception alcohol-fed mothers showed significant hyperglycemia and hypoinsulinemia when they were adults. These rats also showed increased levels of inflammatory cytokines and cellular apoptosis in the pancreas, altered insulin production and actions in the liver, and a reduced number of proopiomelanocortin neurons in the hypothalamus. Replenishment of proopiomelanocortin neurons in these animals normalized the abnormal glucose to restore homeostasis. These data suggest that preconception alcohol exposures alter glucose homeostasis by inducing proopiomelanocortin neuronal functional abnormalities. Our findings provide a novel insight into the impact of high doses of alcohol on the female gamete that may cause inheritance of an increased susceptibility to diabetes.
Keywords: alcohol; diabetes; hyperglycemia; hypoinsulinemia; preconception; proopiomelanocortin.
© The Author(s) 2020. Published by Oxford University Press on behalf of the Endocrine Society. All rights reserved. For permissions, please e-mail: journals.permissions@oup.com.
Figures


Similar articles
-
Fetal alcohol exposure alters proopiomelanocortin gene expression and hypothalamic-pituitary-adrenal axis function via increasing MeCP2 expression in the hypothalamus.PLoS One. 2014 Nov 19;9(11):e113228. doi: 10.1371/journal.pone.0113228. eCollection 2014. PLoS One. 2014. PMID: 25409090 Free PMC article.
-
Preconception Alcohol Increases Offspring Vulnerability to Stress.Neuropsychopharmacology. 2016 Oct;41(11):2782-93. doi: 10.1038/npp.2016.92. Epub 2016 Jun 14. Neuropsychopharmacology. 2016. PMID: 27296153 Free PMC article.
-
Insulin resistance in adult rat offspring associated with maternal dietary fat and alcohol consumption.J Endocrinol. 2002 Apr;173(1):63-71. doi: 10.1677/joe.0.1730063. J Endocrinol. 2002. PMID: 11927385
-
Ethanol suppression of the hypothalamic proopiomelanocortin level and the splenic NK cell cytolytic activity is associated with a reduction in the expression of proinflammatory cytokines but not anti-inflammatory cytokines in neuroendocrine and immune cells.Alcohol Clin Exp Res. 2006 Nov;30(11):1925-32. doi: 10.1111/j.1530-0277.2006.00237.x. Alcohol Clin Exp Res. 2006. PMID: 17067358
-
Gestational choline supplementation normalized fetal alcohol-induced alterations in histone modifications, DNA methylation, and proopiomelanocortin (POMC) gene expression in β-endorphin-producing POMC neurons of the hypothalamus.Alcohol Clin Exp Res. 2013 Jul;37(7):1133-42. doi: 10.1111/acer.12082. Epub 2013 Feb 15. Alcohol Clin Exp Res. 2013. PMID: 23413810 Free PMC article.
Cited by
-
Toxic and Teratogenic Effects of Prenatal Alcohol Exposure on Fetal Development, Adolescence, and Adulthood.Int J Mol Sci. 2021 Aug 16;22(16):8785. doi: 10.3390/ijms22168785. Int J Mol Sci. 2021. PMID: 34445488 Free PMC article. Review.
-
Exploring behavioral phenotypes in a mouse model of fetal alcohol spectrum disorders.Dev Neurobiol. 2023 Jul-Sep;83(5-6):184-204. doi: 10.1002/dneu.22922. Epub 2023 Jul 11. Dev Neurobiol. 2023. PMID: 37433012 Free PMC article.
-
miRNA-383 and miRNA-384 Suppress Proopiomelanocortin Gene Expression in the Hypothalamus: Effects of Early Life Ethanol Exposure.Neuroendocrinology. 2023;113(8):844-858. doi: 10.1159/000530289. Epub 2023 Mar 22. Neuroendocrinology. 2023. PMID: 36948162 Free PMC article.
-
Prenatal Alcohol Exposure and Metabolic Disorders in Pediatrics: The Role of the Oxidative Stress-A Review of the Literature.Children (Basel). 2024 Feb 21;11(3):269. doi: 10.3390/children11030269. Children (Basel). 2024. PMID: 38539304 Free PMC article. Review.
-
Inter- and transgenerational heritability of preconception chronic stress or alcohol exposure: Translational outcomes in brain and behavior.Neurobiol Stress. 2023 Dec 25;29:100603. doi: 10.1016/j.ynstr.2023.100603. eCollection 2024 Mar. Neurobiol Stress. 2023. PMID: 38234394 Free PMC article.
References
-
- National Diabetes Statistics Report, 2020. Centers for disease control and prevention (CDC) website. https://www.cdc.gov/diabetes/data/statistics/statistics-report.html. Accessed August 11, 2020.
-
- Hu FB, Manson JE, Stampfer MJ, et al. Diet, lifestyle, and the risk of type 2 diabetes mellitus in women. N Engl J Med. 2001;345(11):790-797. - PubMed
-
- Spear BA, Barlow SE, Ervin C, et al. Recommendations for treatment of child and adolescent overweight and obesity. Pediatrics. 2007;120 Suppl 4:S254-S288. - PubMed
-
- Centers for Disease Control and Prevention (CDC). Behavioral risk factor surveillance system survey data. CDC report. https://www.cdc.gov/nchs/data/hus/hus16.pdf. 2016.
-
- Roberts SCM, Thompson KM. Estimating the prevalence of United States women with alcohol-exposed pregnancies and births. Womens Health Issues. 2019;29(2):188-193. - PubMed
Publication types
MeSH terms
Substances
Grants and funding
LinkOut - more resources
Full Text Sources
Medical
