. 2020 Oct 15;9(10):giaa111.
doi: 10.1093/gigascience/giaa111.

IDseq-An open source cloud-based pipeline and analysis service for metagenomic pathogen detection and monitoring

Affiliations

IDseq-An open source cloud-based pipeline and analysis service for metagenomic pathogen detection and monitoring

Katrina L Kalantar et al. Gigascience. .

Abstract

Background: Metagenomic next-generation sequencing (mNGS) has enabled the rapid, unbiased detection and identification of microbes without pathogen-specific reagents, culturing, or a priori knowledge of the microbial landscape. mNGS data analysis requires a series of computationally intensive processing steps to accurately determine the microbial composition of a sample. Existing mNGS data analysis tools typically require bioinformatics expertise and access to local server-class hardware resources. For many research laboratories, this presents an obstacle, especially in resource-limited environments.

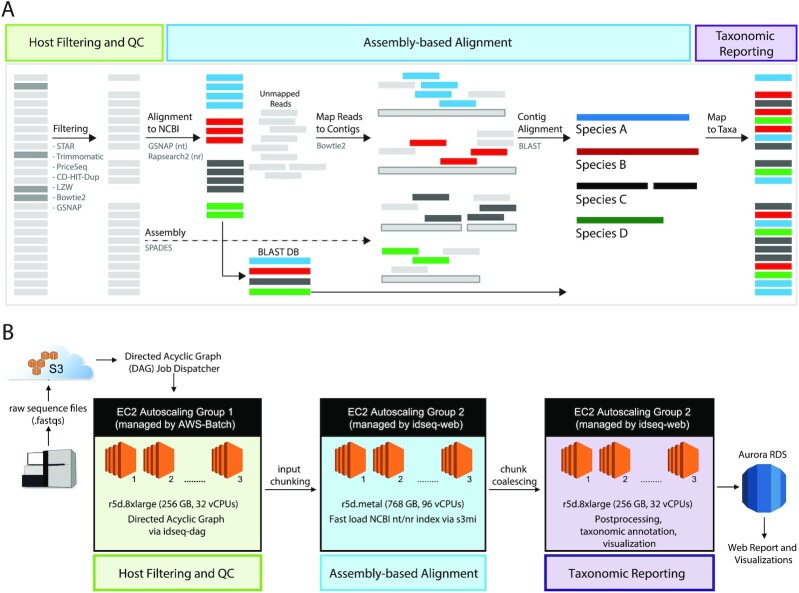
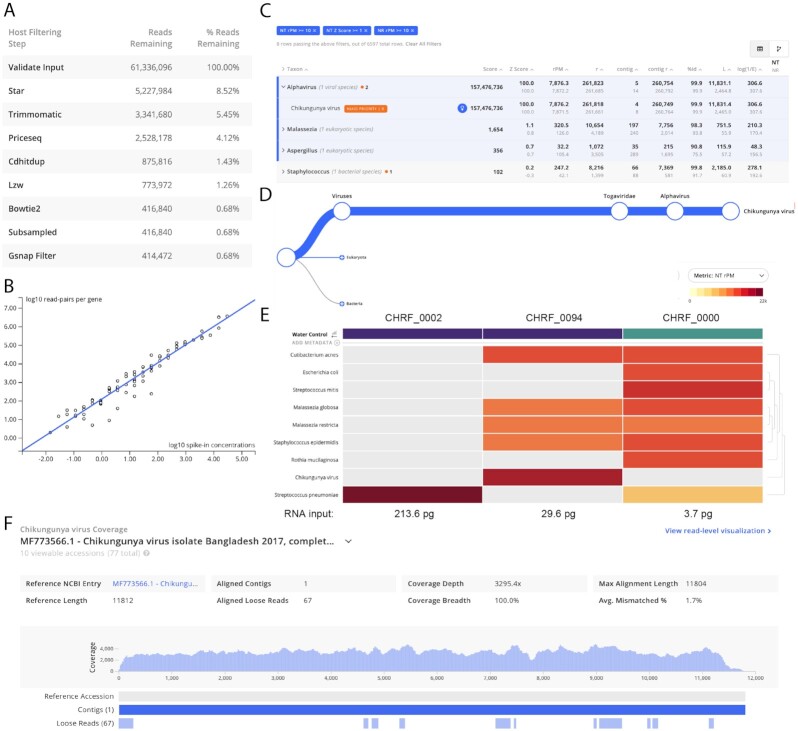
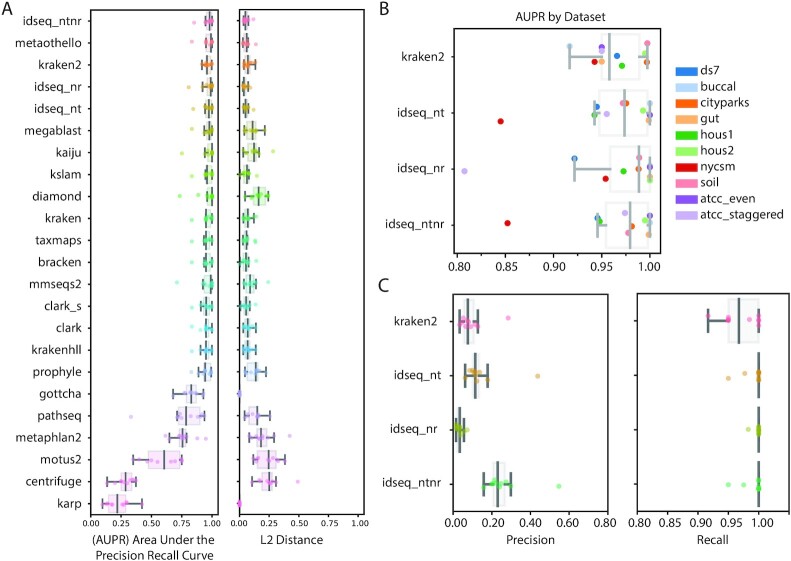
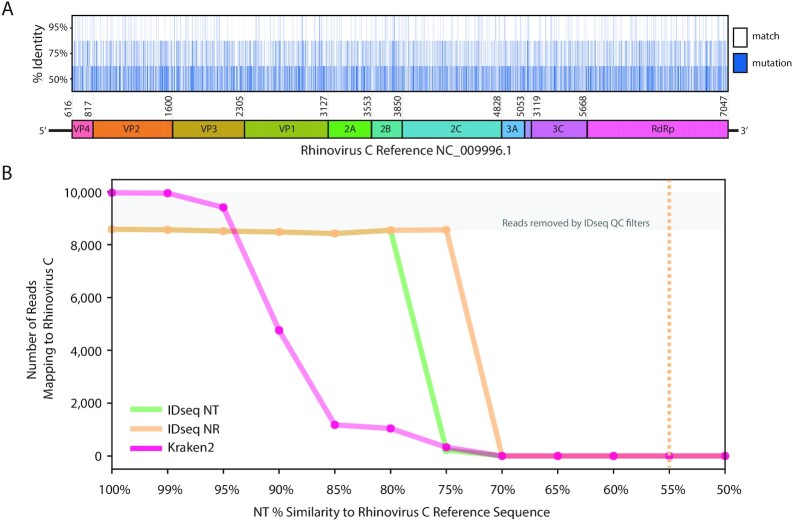
Findings: We present IDseq, an open source cloud-based metagenomics pipeline and service for global pathogen detection and monitoring (https://idseq.net). The IDseq Portal accepts raw mNGS data, performs host and quality filtration steps, then executes an assembly-based alignment pipeline, which results in the assignment of reads and contigs to taxonomic categories. The taxonomic relative abundances are reported and visualized in an easy-to-use web application to facilitate data interpretation and hypothesis generation. Furthermore, IDseq supports environmental background model generation and automatic internal spike-in control recognition, providing statistics that are critical for data interpretation. IDseq was designed with the specific intent of detecting novel pathogens. Here, we benchmark novel virus detection capability using both synthetically evolved viral sequences and real-world samples, including IDseq analysis of a nasopharyngeal swab sample acquired and processed locally in Cambodia from a tourist from Wuhan, China, infected with the recently emergent SARS-CoV-2.

Conclusion: The IDseq Portal reduces the barrier to entry for mNGS data analysis and enables bench scientists, clinicians, and bioinformaticians to gain insight from mNGS datasets for both known and novel pathogens.

Keywords: COVID-2019; cloud-based; metagenomics; pathogen detection; virus.


Figures

Figure 1:
Figure 1:
(A) Overview of the IDseq pipeline steps and data analysis workflow. The IDseq pipeline for pathogen discovery is composed of several steps, including host filtering and QC, assembly-based alignment, and taxonomic aggregation and reporting. Each step comprises a number of existing bioinformatics tools. (B) The IDseq pipeline is optimized for AWS cloud computational infrastructure. Each of the core pipeline steps (host filtering and QC, assembly-based alignment, and taxonomic aggregation and reporting) is managed by EC2 Autoscaling Groups.
Figure 2:
Figure 2:
The IDseq web application provides multiple easy-to-use visualizations to help the user assess the quality and content of their sample. Screenshots taken from the IDseq Portal correspond to the re-analysis of samples from a study of etiologies of pediatric meningitis originally published by Saha et al. [1] (see section Application I). CHRF_0002 and CHRF_0094 are CSF samples from pediatric patients with meningitis due to Streptococcus pneumonia and chikungunya virus, respectively. CHRF_0000 is a water control. (A) Table of reads remaining during each step of the host filtration step (for CHRF_0094)—interpretation of the relative loss at each step in can provide insight into the quality of the library preparation and sequencing run. (B) Automatic quantification of ERCC counts from sample CHRF_0094; ERCC quantification enables back-calculation of input RNA concentration. (C) The results for a single sample (CHRF_0094) are presented as a table, with key metrics for interpreting taxon alignment quality. (D) The tree view indicates the relative abundance of sequences and their taxonomic relationship within a particular sample; shown is the relative abundance of chikungunya virus reads in CHRF_0094. (E) The results from multiple samples can be compared using the IDseq heat map view, with associated metadata (purple = CSF, blue = water control). The interactive heat map visualization can be viewed at [42]. The heat map is especially powerful when analyzing trends across a larger number of samples. (F) Coverage of chikungunya virus in CHRF_0094; the coverage visualization enables rapid interrogation of genome coverage.
Figure 3:
Figure 3:
Performance metrics calculated for IDseq (NT and NR), as compared to the values recently published by Ye et al. [46]. (A) Area under the precision recall curve (AUPR) and L2 distance values for 22 tools, as evaluated against their default databases. (B) The AUPR values for specific benchmark datasets evaluated for 3 tools (Kraken2, IDseq NT, and IDseq NR), including metrics obtained when evaluating basic threshold filters integrating both IDseq NT and NR (idseq_ntnr). (C) The precision and recall of the same 3 tools for detecting known taxa. In all boxplots, the median is shown as a dark grey line, with light grey boxes corresponding to the first and third quartiles. Whiskers extend to the farthest data points that are not outliers.
Figure 4:
Figure 4:
(A) Graphic representation of genomic similarity for simulated divergent Rhinovirus C genomes, at 95%, 75%, and 50% similarity to reference sequence NC_0 09996.1. (B) Performance of IDseq (NT and NR) as compared to Kraken2 for recovery of reads from simulated divergent Rhinovirus C genomes at varying levels of divergence. The dotted line indicates the theoretical limit for detection of Rhinovirus C achieved by manual BLASTx of IDseq-produced contigs.

References

    1. Saha S, Ramesh A, Kalantar K, et al. Unbiased metagenomic sequencing for pediatric meningitis in Bangladesh reveals neuroinvasive chikungunya virus outbreak and other unrealized pathogens. MBio. 2019;10(6):e02877–19. - PMC - PubMed
    1. Simner PJ, Miller S, Carroll KC. Understanding the promises and hurdles of metagenomic next-generation sequencing as a diagnostic tool for infectious diseases. Clin Infect Dis. 2018;66:778. - PMC - PubMed
    1. Lu J, Breitwieser FP, Thielen P, et al. Bracken: Estimating species abundance in metagenomics data. PeerJ Comput Sci. 2017;3:e104.
    1. Kim D, Song L, Breitwieser FP, et al. Centrifuge: Rapid and sensitive classification of metagenomic sequences. Genome Res. 2016;26:1721–9. - PMC - PubMed
    1. Walker MA, Pedamallu CS, Ojesina AI, et al. GATK PathSeq: A customizable computational tool for the discovery and identification of microbial sequences in libraries from eukaryotic hosts. Bioinformatics. 2018;34(24):4287–9. - PMC - PubMed

Publication types