

Neuroanatomical underpinning of diffusion kurtosis measurements in the cerebral cortex of healthy macaque brains
- PMID: 33058286
- PMCID: PMC8934732
- DOI: 10.1002/mrm.28548
Neuroanatomical underpinning of diffusion kurtosis measurements in the cerebral cortex of healthy macaque brains
Abstract
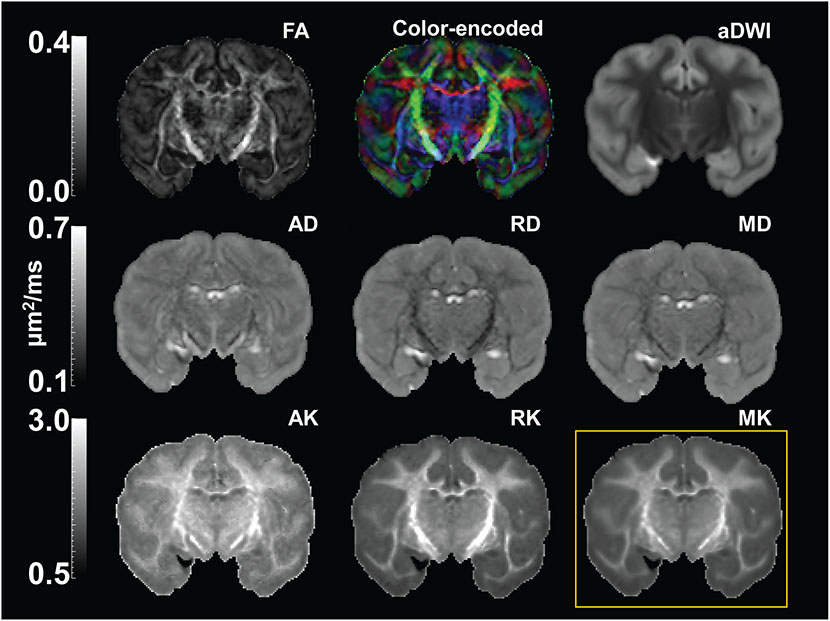
Purpose: To investigate the neuroanatomical underpinning of healthy macaque brain cortical microstructure measured by diffusion kurtosis imaging (DKI), which characterizes non-Gaussian water diffusion.
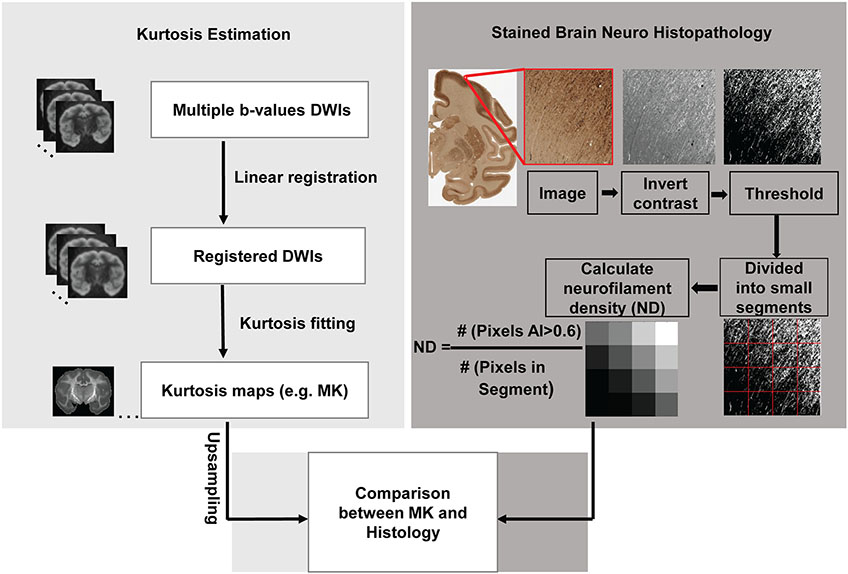
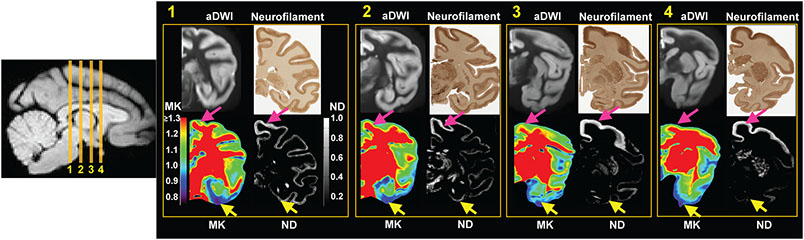
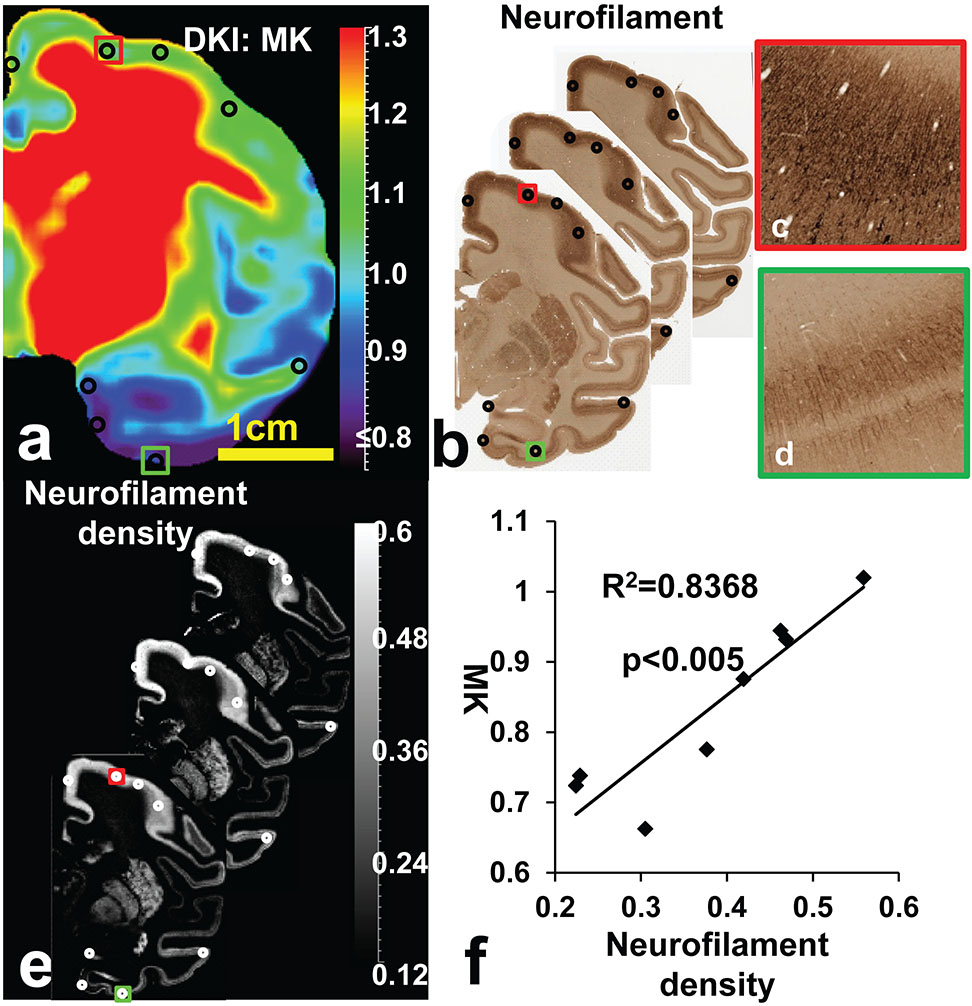
Methods: High-resolution DKI was acquired from 6 postmortem macaque brains. Neurofilament density (ND) was quantified based on structure tensor from neurofilament histological images of a different macaque brain sample. After alignment of DKI-derived mean kurtosis (MK) maps to the histological images, MK and histology-based ND were measured at corresponding regions of interests characterized by distinguished cortical MK values in the prefrontal/precentral-postcentral and temporal cortices. Pearson correlation was performed to test significant correlation between these cortical MK and ND measurements.
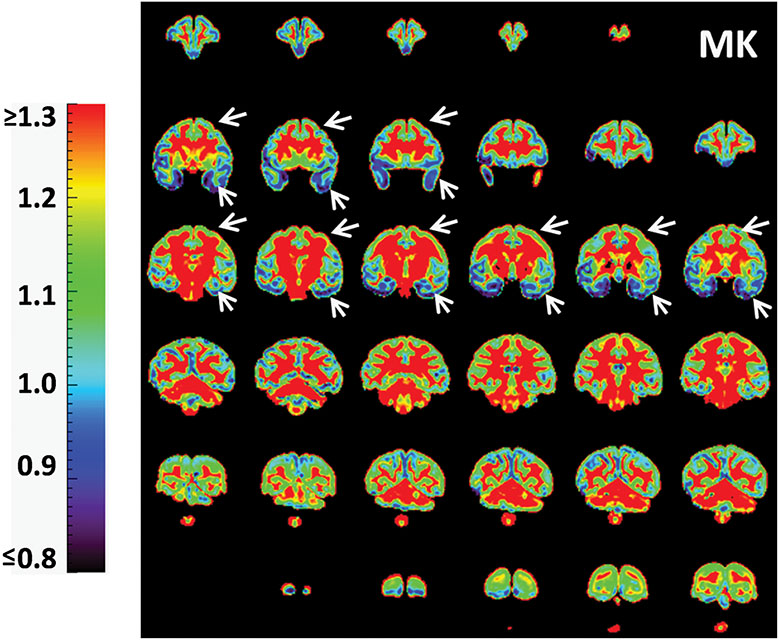
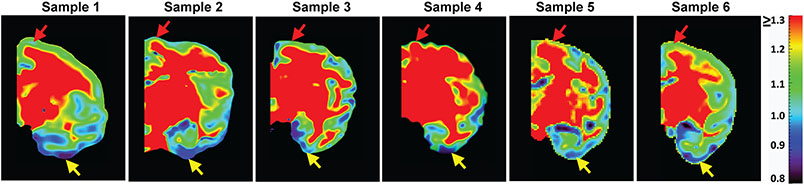
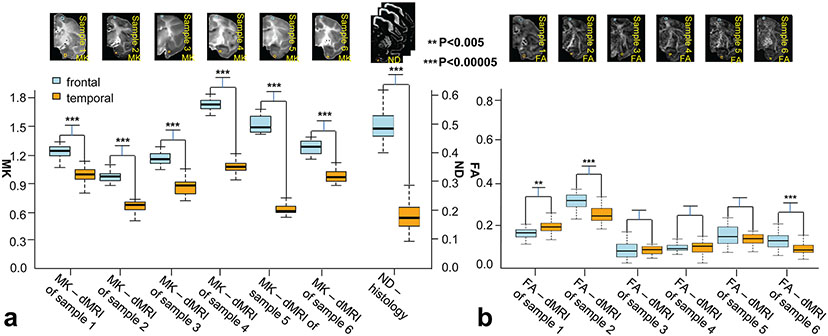
Results: Heterogeneity of cortical MK across different cortical regions was revealed, with significantly and consistently higher MK measurements in the prefrontal/precentral-postcentral cortex compared to those in the temporal cortex across all six scanned macaque brains. Corresponding higher ND measurements in the prefrontal/precentral-postcentral cortex than in the temporal cortex were also found. The heterogeneity of cortical MK is associated with heterogeneity of histology-based ND measurements, with significant correlation between cortical MK and corresponding ND measurements (P < .005).
Conclusion: These findings suggested that DKI-derived MK can potentially be an effective noninvasive biomarker quantifying underlying neuroanatomical complexity inside the cerebral cortical mantle for clinical and neuroscientific research.
Keywords: biomarker; cerebral cortex; diffusion MRI; diffusion kurtosis imaging; histology; microstructure.
© 2020 International Society for Magnetic Resonance in Medicine.
Figures
Similar articles
-
Differential cortical microstructural maturation in the preterm human brain with diffusion kurtosis and tensor imaging.Proc Natl Acad Sci U S A. 2019 Mar 5;116(10):4681-4688. doi: 10.1073/pnas.1812156116. Epub 2019 Feb 19. Proc Natl Acad Sci U S A. 2019. PMID: 30782802 Free PMC article.
-
Diffusion kurtosis imaging of gray matter in schizophrenia.Cortex. 2019 Dec;121:201-224. doi: 10.1016/j.cortex.2019.08.013. Epub 2019 Aug 29. Cortex. 2019. PMID: 31629198 Free PMC article.
-
Dynamics of blood brain barrier permeability and tissue microstructure following controlled cortical impact injury in rat: A dynamic contrast-enhanced magnetic resonance imaging and diffusion kurtosis imaging study.Magn Reson Imaging. 2019 Oct;62:1-9. doi: 10.1016/j.mri.2019.01.017. Epub 2019 Jan 17. Magn Reson Imaging. 2019. PMID: 30660704
-
Pathological assessment of chronic kidney disease with DWI: Is there an added value for diffusion kurtosis imaging?J Magn Reson Imaging. 2021 Aug;54(2):508-517. doi: 10.1002/jmri.27569. Epub 2021 Feb 26. J Magn Reson Imaging. 2021. PMID: 33634937
-
Microstructural alterations of cortical and deep gray matter over a season of high school football revealed by diffusion kurtosis imaging.Neurobiol Dis. 2018 Nov;119:79-87. doi: 10.1016/j.nbd.2018.07.020. Epub 2018 Jul 23. Neurobiol Dis. 2018. PMID: 30048802
Cited by
-
Diffusional Kurtosis Imaging in the Diffusion Imaging in Python Project.Front Hum Neurosci. 2021 Jul 19;15:675433. doi: 10.3389/fnhum.2021.675433. eCollection 2021. Front Hum Neurosci. 2021. PMID: 34349631 Free PMC article.
-
Machine-learning based prediction of future outcome using multimodal MRI during early childhood.Semin Fetal Neonatal Med. 2024 Nov;29(2-3):101561. doi: 10.1016/j.siny.2024.101561. Epub 2024 Nov 7. Semin Fetal Neonatal Med. 2024. PMID: 39528363 Review.
-
Advances in magnetic resonance imaging of the developing brain and its applications in pediatrics.World J Pediatr. 2025 Jul;21(7):652-707. doi: 10.1007/s12519-025-00905-7. Epub 2025 May 30. World J Pediatr. 2025. PMID: 40442377 Review.
-
Diffusional kurtosis imaging as a possible prognostic marker of cervical incomplete spinal cord injury outcome: a prospective pilot study.Acta Neurochir (Wien). 2022 Jan;164(1):25-32. doi: 10.1007/s00701-021-05018-4. Epub 2021 Oct 20. Acta Neurochir (Wien). 2022. PMID: 34671848
-
Rapid microstructural plasticity in the cortical semantic network following a short language learning session.PLoS Biol. 2021 Jun 14;19(6):e3001290. doi: 10.1371/journal.pbio.3001290. eCollection 2021 Jun. PLoS Biol. 2021. PMID: 34125828 Free PMC article.
References
-
- Le Bihan D Molecular diffusion, tissue microdynamics and microstructure. NMR Biomed. 1995;8:375–386. - PubMed
-
- Pierpaoli C, Basser PJ. Toward a quantitative assessment of diffusion anisotropy. Magn Reson Med. 1996;36:893–906. - PubMed
-
- Beaulieu C The basis of anisotropic water diffusion in the nervous system–a technical review. NMR Biomed. 2002;15:435–455. - PubMed
Publication types
MeSH terms
Grants and funding
LinkOut - more resources
Full Text Sources
