

Distinct influence of parental occupation on cortical thickness and surface area in children and adolescents: Relation to self-esteem
- PMID: 33058416
- PMCID: PMC7670644
- DOI: 10.1002/hbm.25169
Distinct influence of parental occupation on cortical thickness and surface area in children and adolescents: Relation to self-esteem
Abstract
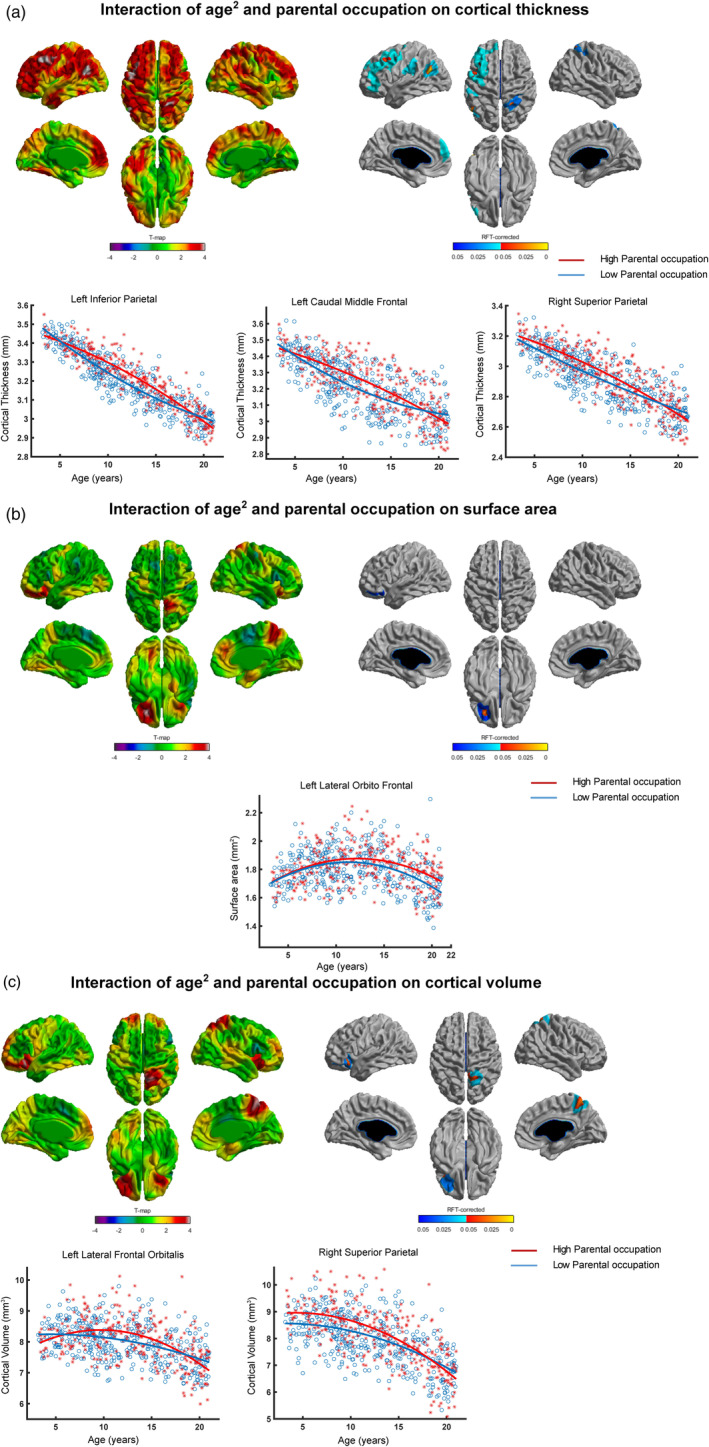
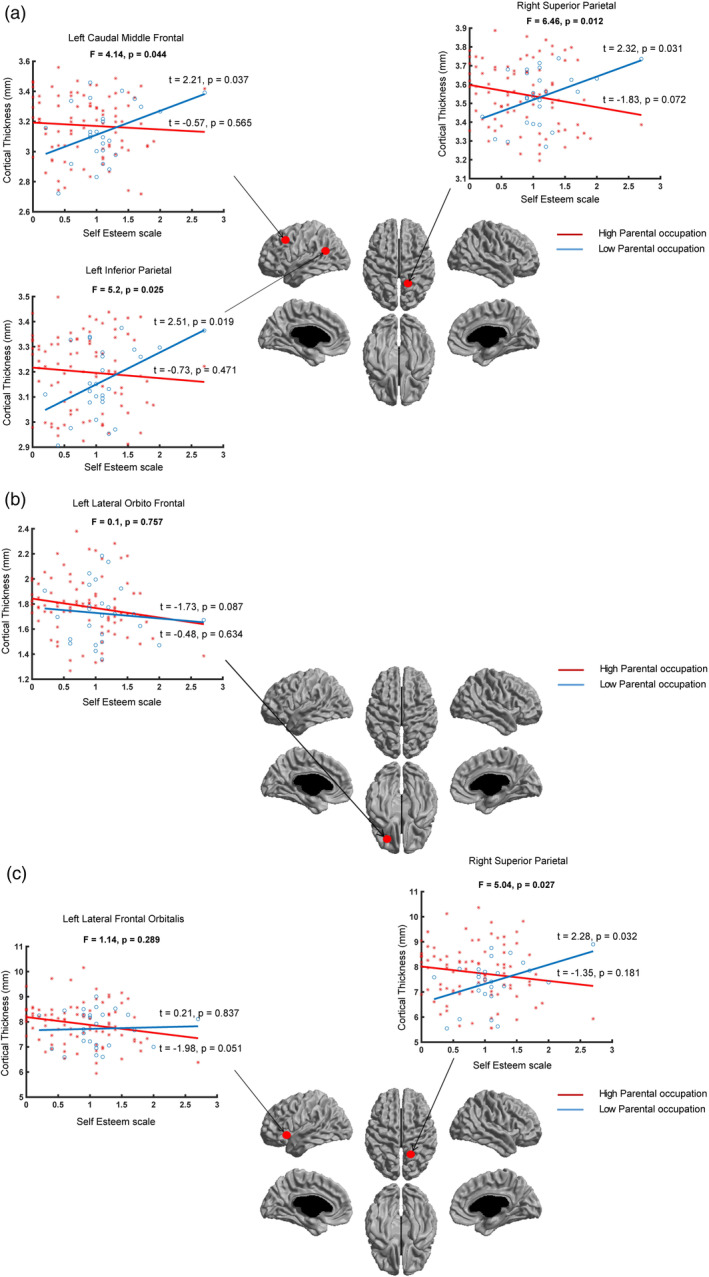
Studies of socioeconomic disparities have largely focused on correlating brain measures with either composite measure of socioeconomic status (SES), or its components-family income or parental education, giving little attention to the component of parental occupation. Emerging evidence suggests that parental occupation may be an important and neglected indicator of childhood and adolescent SES compared to absolute measures of material resources or academic attainment because, while related, it may more precisely capture position in social hierarchy and related health outcomes. On the other hand, although cortical thickness and surface area are brain measures with distinct genetic and developmental origins, large-scale neuroimaging studies investigating regional differences in interaction of the composite measure of SES or its components with cortical thickness and surface area are missing. We set out to fill this gap, focusing specifically on the role of parental occupation on cortical thickness and surface area by analyzing magnetic resonance imaging scans from 704 healthy individuals (age = 3-21 years). We observed spatially distributed patterns of (parental occupation × age2 ) interaction with cortical thickness (localized at the left caudal middle frontal, the left inferior parietal and the right superior parietal) and surface area (localized at the left orbitofrontal cortex), indicating independent sources of variability. Further, with decreased cortical thickness, children from families with lower parental occupation exhibited lower self-esteem. Our findings demonstrate distinct influence of parental occupation on cortical thickness and surface area in children and adolescents, potentially reflecting different neurobiological mechanisms by which parental occupation may impact brain development.
Keywords: brain development; cortical thickness; parental occupation; self-esteem; socioeconomic status (SES); surface area.
© 2020 The Authors. Human Brain Mapping published by Wiley Periodicals LLC.
Conflict of interest statement
The authors declare no conflict of interest.
Figures
Similar articles
-
Parental socioeconomic status is linked to cortical microstructure and language abilities in children and adolescents.Dev Cogn Neurosci. 2022 Aug;56:101132. doi: 10.1016/j.dcn.2022.101132. Epub 2022 Jul 4. Dev Cogn Neurosci. 2022. PMID: 35816931 Free PMC article.
-
Age-Related Differences in Cortical Thickness Vary by Socioeconomic Status.PLoS One. 2016 Sep 19;11(9):e0162511. doi: 10.1371/journal.pone.0162511. eCollection 2016. PLoS One. 2016. PMID: 27644039 Free PMC article.
-
Longitudinally Mapping Childhood Socioeconomic Status Associations with Cortical and Subcortical Morphology.J Neurosci. 2019 Feb 20;39(8):1365-1373. doi: 10.1523/JNEUROSCI.1808-18.2018. Epub 2018 Dec 26. J Neurosci. 2019. PMID: 30587541 Free PMC article.
-
Associations between cortical thickness and neurocognitive skills during childhood vary by family socioeconomic factors.Brain Cogn. 2017 Aug;116:54-62. doi: 10.1016/j.bandc.2017.03.007. Epub 2017 Apr 2. Brain Cogn. 2017. PMID: 28377043 Free PMC article.
-
How Socioeconomic Disadvantages Get Under the Skin and into the Brain to Influence Health Development Across the Lifespan.2017 Nov 21. In: Halfon N, Forrest CB, Lerner RM, Faustman EM, editors. Handbook of Life Course Health Development [Internet]. Cham (CH): Springer; 2018. 2017 Nov 21. In: Halfon N, Forrest CB, Lerner RM, Faustman EM, editors. Handbook of Life Course Health Development [Internet]. Cham (CH): Springer; 2018. PMID: 31314284 Free Books & Documents. Review.
Cited by
-
Parental education and income are linked to offspring cortical brain structure and psychopathology at 9-11 years.JCPP Adv. 2024 Feb 6;4(1):e12220. doi: 10.1002/jcv2.12220. eCollection 2024 Mar. JCPP Adv. 2024. PMID: 38486948 Free PMC article.
-
Parental socioeconomic status is linked to cortical microstructure and language abilities in children and adolescents.Dev Cogn Neurosci. 2022 Aug;56:101132. doi: 10.1016/j.dcn.2022.101132. Epub 2022 Jul 4. Dev Cogn Neurosci. 2022. PMID: 35816931 Free PMC article.
-
Educational attainment polygenic scores, socioeconomic factors, and cortical structure in children and adolescents.Hum Brain Mapp. 2022 Nov;43(16):4886-4900. doi: 10.1002/hbm.26034. Epub 2022 Jul 27. Hum Brain Mapp. 2022. PMID: 35894163 Free PMC article.
-
Cortical thickness and childhood eating behaviors: differences according to sex and age, and relevance for eating disorders.Eat Weight Disord. 2024 Jul 19;29(1):47. doi: 10.1007/s40519-024-01675-3. Eat Weight Disord. 2024. PMID: 39028377 Free PMC article.
-
Relationships between physical activity, healthy eating and cortical thickness in children and young adults.Brain Imaging Behav. 2022 Dec;16(6):2690-2704. doi: 10.1007/s11682-022-00728-4. Epub 2022 Nov 2. Brain Imaging Behav. 2022. PMID: 36319908
References
-
- Aber, J. L. , Bennett, N. G. , Conley, D. C. , & Li, J. (1997). The effects of poverty on child health and development. Annual Review of Public Health, 18, 463–483. - PubMed
-
- Ackerman, B. P. , Brown, E. D. , & Izard, C. E. (2004). The relations between persistent poverty and contextual risk and children's behavior in elementary school. Developmental Psychology, 40, 367–377. - PubMed
Publication types
MeSH terms
Grants and funding
LinkOut - more resources
Full Text Sources
Miscellaneous
