

Beam angle comparison for distal esophageal carcinoma patients treated with intensity-modulated proton therapy
- PMID: 33058523
- PMCID: PMC7700921
- DOI: 10.1002/acm2.13049
Beam angle comparison for distal esophageal carcinoma patients treated with intensity-modulated proton therapy
Abstract
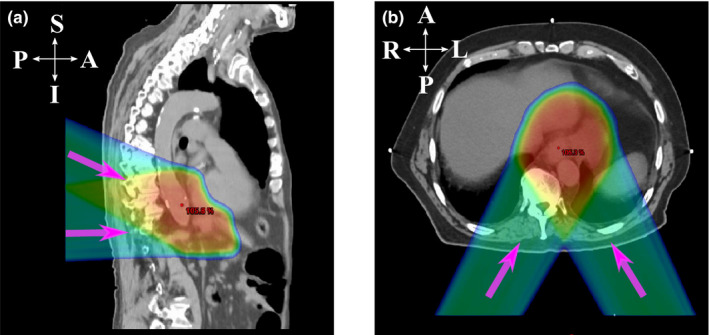
Purpose: To compare the dosimetric performances of intensity-modulated proton therapy (IMPT) plans generated with two different beam angle configurations (the Right-Left oblique posterior beams and the Superior-Inferior oblique posterior beams) for the treatment of distal esophageal carcinoma in the presence of uncertainties and interplay effect.
Methods and materials: Twenty patients' IMPT plans were retrospectively selected, with 10 patients treated with the R-L oblique posterior beams (Group R-L) and the other 10 patients treated with the S-I oblique posterior beams (Group S-I). Patients in both groups were matched by their clinical target volumes (CTVs-high and low dose levels) and respiratory motion amplitudes. Dose-volume-histogram (DVH) indices were used to assess plan quality. DVH bandwidth was calculated to evaluate plan robustness. Interplay effect was quantified using four-dimensional (4D) dynamic dose calculation with random respiratory starting phase of each fraction. Normal tissue complication probability (NTCP) for heart, liver, and lung was calculated, respectively, to estimate the clinical outcomes. Wilcoxon signed-rank test was used for statistical comparison between the two groups.
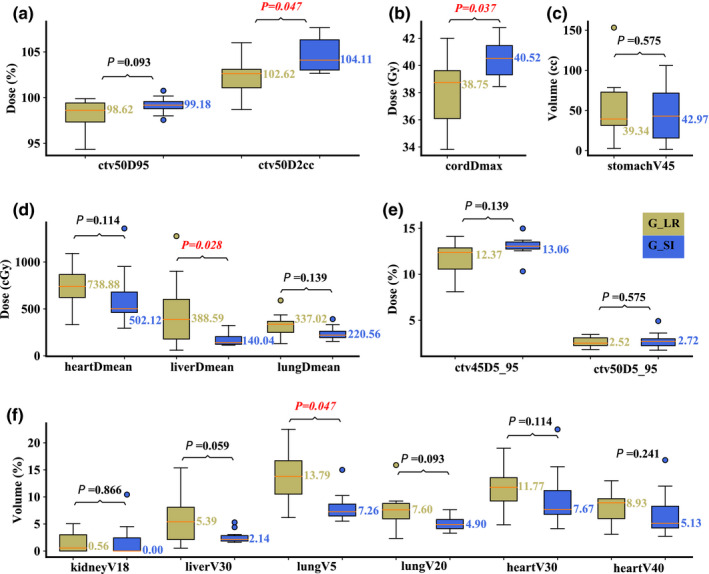
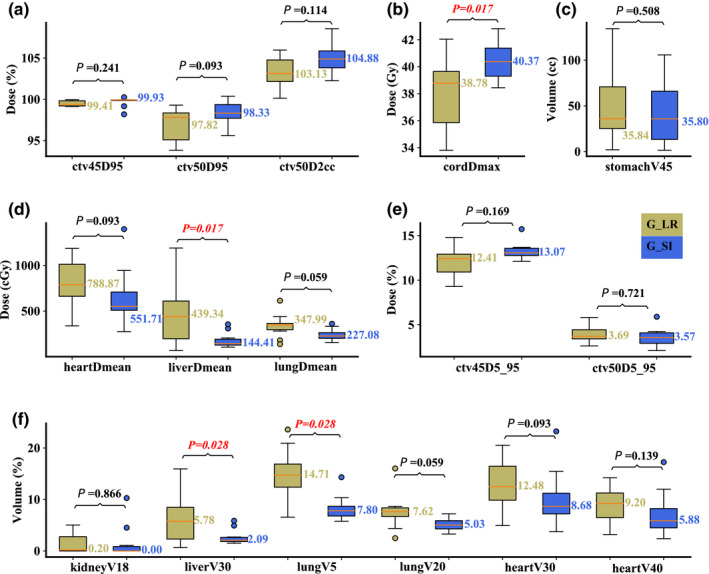
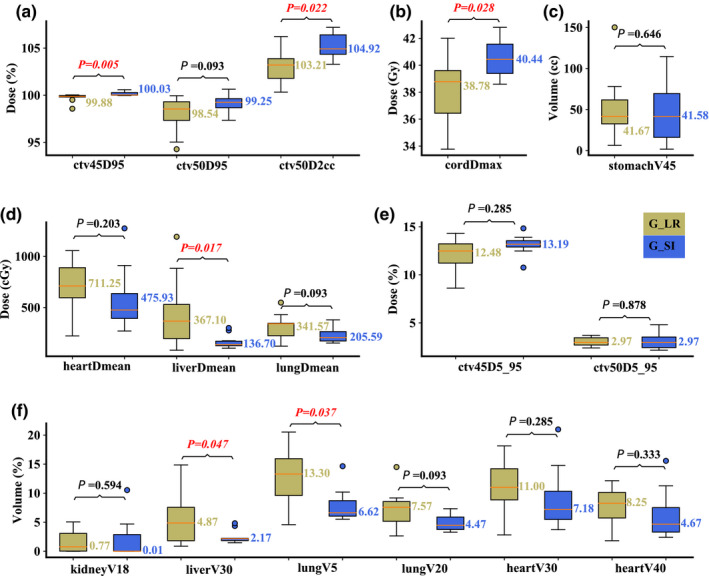
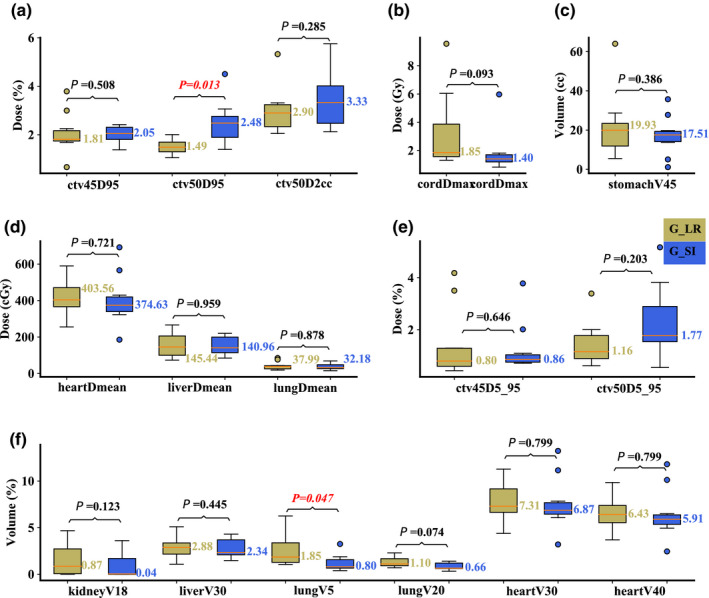
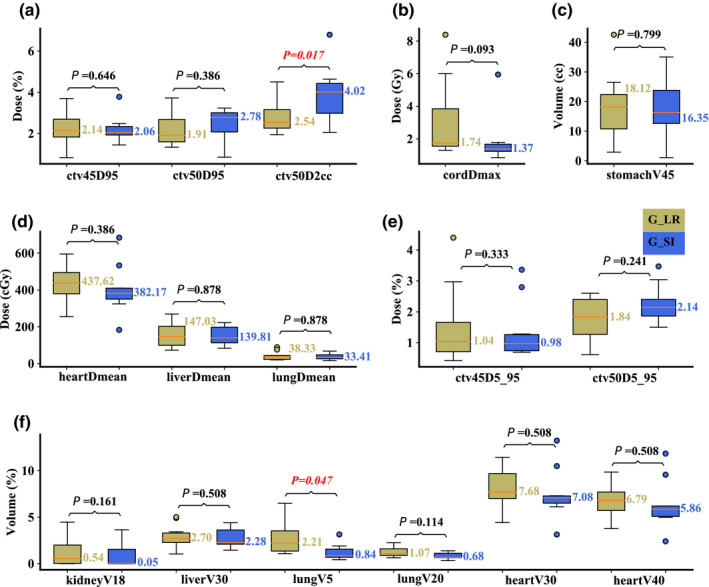
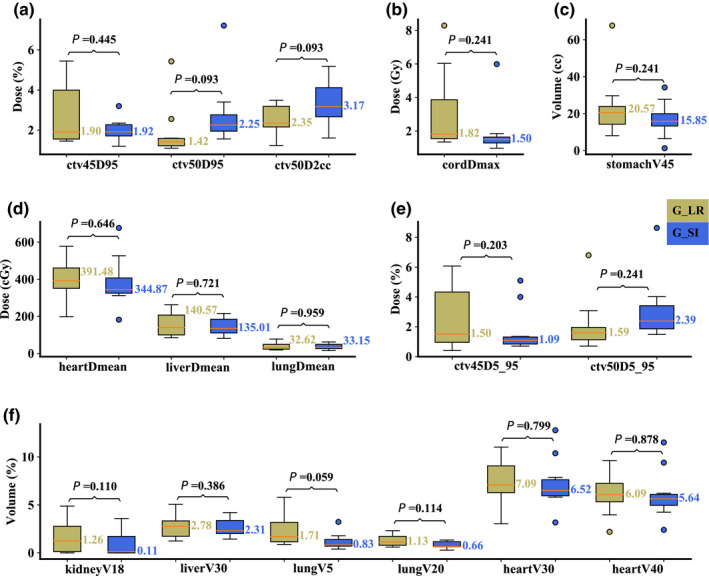
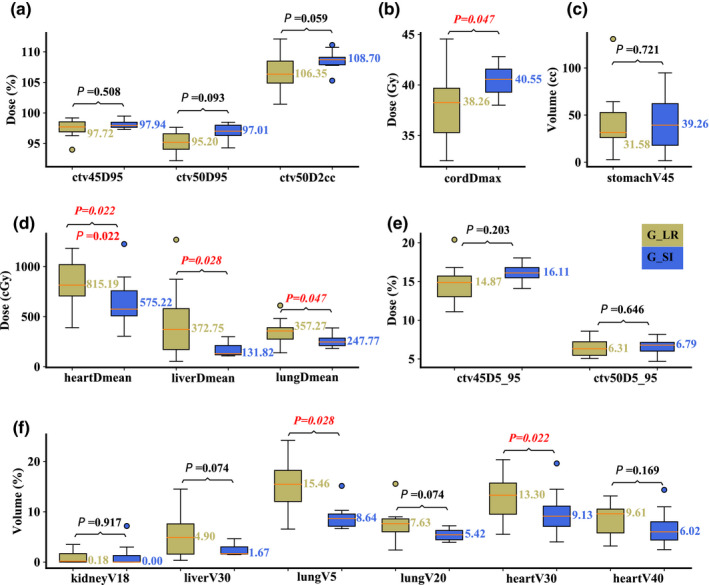
Results: Compared with plans in Group R-L, plans in Group S-I resulted in significantly lower liver Dmean and lung V30Gy[RBE] with slightly higher but clinically acceptable spinal cord Dmax . Similar plan robustness was observed between the two groups. When interplay effect was considered, plans in Group S-I performed statistically better for heart Dmean and V30Gy[RBE] , lung Dmean and V5Gy[RBE] , and liver Dmean , with slightly increased but clinically acceptable spinal cord Dmax . NTCP for liver was significantly better in Group S-I.
Conclusions: IMPT plans in Group S-I have better sparing of liver, heart, and lungs at the slight cost of spinal cord maximum dose protection, and are more interplay-effect resilient compared to IMPT plans in Group R-L. Our study supports the routine use of the S-I oblique posterior beams for the treatments of distal esophageal carcinoma.
Keywords: beam angle; esophageal cancer; intensity-modulated proton therapy; interplay effect.
© 2020 The Authors. Journal of Applied Clinical Medical Physics published by Wiley Periodicals LLC on behalf of American Association of Physicists in Medicine.
Conflict of interest statement
Terence T. Sio, MD, MS, provides strategic and scientific recommendations as a member of the Advisory Board and speaker for Novocure, Inc. This position has no relation to this manuscript. All other authors have no additional conflict to disclose.
Figures
Similar articles
-
Dosimetric comparison of distal esophageal carcinoma plans for patients treated with small-spot intensity-modulated proton versus volumetric-modulated arc therapies.J Appl Clin Med Phys. 2019 Jul;20(7):15-27. doi: 10.1002/acm2.12623. Epub 2019 May 21. J Appl Clin Med Phys. 2019. PMID: 31112371 Free PMC article.
-
Technical Note: 4D robust optimization in small spot intensity-modulated proton therapy (IMPT) for distal esophageal carcinoma.Med Phys. 2021 Aug;48(8):4636-4647. doi: 10.1002/mp.15003. Epub 2021 Jun 24. Med Phys. 2021. PMID: 34058026
-
Technical Note: Treatment planning system (TPS) approximations matter - comparing intensity-modulated proton therapy (IMPT) plan quality and robustness between a commercial and an in-house developed TPS for nonsmall cell lung cancer (NSCLC).Med Phys. 2019 Nov;46(11):4755-4762. doi: 10.1002/mp.13809. Epub 2019 Sep 21. Med Phys. 2019. PMID: 31498885
-
Small-spot intensity-modulated proton therapy and volumetric-modulated arc therapies for patients with locally advanced non-small-cell lung cancer: A dosimetric comparative study.J Appl Clin Med Phys. 2018 Nov;19(6):140-148. doi: 10.1002/acm2.12459. Epub 2018 Oct 17. J Appl Clin Med Phys. 2018. PMID: 30328674 Free PMC article.
-
Reflections on beam configuration optimization for intensity-modulated proton therapy.Phys Med Biol. 2022 Jun 27;67(13):10.1088/1361-6560/ac6fac. doi: 10.1088/1361-6560/ac6fac. Phys Med Biol. 2022. PMID: 35561700 Free PMC article. Review.
Cited by
-
Collimating individual beamlets in pencil beam scanning proton therapy, a dosimetric investigation.Front Oncol. 2022 Nov 11;12:1031340. doi: 10.3389/fonc.2022.1031340. eCollection 2022. Front Oncol. 2022. PMID: 36439436 Free PMC article.
-
Executive Summary of Clinical and Technical Guidelines for Esophageal Cancer Proton Beam Therapy From the Particle Therapy Co-Operative Group Thoracic and Gastrointestinal Subcommittees.Front Oncol. 2021 Oct 19;11:748331. doi: 10.3389/fonc.2021.748331. eCollection 2021. Front Oncol. 2021. PMID: 34737959 Free PMC article. Review.
-
Beam mask and sliding window-facilitated deep learning-based accurate and efficient dose prediction for pencil beam scanning proton therapy.ArXiv [Preprint]. 2023 May 29:arXiv:2305.18572v1. ArXiv. 2023. Update in: Med Phys. 2024 Feb;51(2):1484-1498. doi: 10.1002/mp.16758. PMID: 37396612 Free PMC article. Updated. Preprint.
-
Diffusion Transformer-based Universal Dose Denoising for Pencil Beam Scanning Proton Therapy.ArXiv [Preprint]. 2025 Jun 4:arXiv:2506.04467v1. ArXiv. 2025. PMID: 40503017 Free PMC article. Preprint.
-
Dosimetric analysis and biological evaluation between proton radiotherapy and photon radiotherapy for the long target of total esophageal squamous cell carcinoma.Front Oncol. 2022 Oct 3;12:954187. doi: 10.3389/fonc.2022.954187. eCollection 2022. Front Oncol. 2022. PMID: 36263217 Free PMC article.
References
-
- Bray F, Ferlay J, Soerjomataram I, Siegel RL, Torre LA, Jemal A. Global cancer statistics 2018: GLOBOCAN estimates of incidence and mortality worldwide for 36 cancers in 185 countries. CA: Cancer J Clin. 2018;68:394–424. - PubMed
-
- Siegel RL, Miller KD, Jemal A. Cancer statistics, 2020. CA: Cancer J Clin. 2020;70:7–30. - PubMed
-
- Kole TP, Aghayere O, Kwah J, Yorke ED, Goodman KA. Comparison of heart and coronary artery doses associated with intensity‐modulated radiotherapy versus three‐dimensional conformal radiotherapy for distal esophageal cancer. Int J Radiat Oncol Biol Phys. 2012;83:1580–1586. - PubMed
MeSH terms
Grants and funding
LinkOut - more resources
Full Text Sources
Medical
