

COVID-19 and Overall Mortality Inequities in the Surge in Death Rates by Zip Code Characteristics: Massachusetts, January 1 to May 19, 2020
- PMID: 33058698
- PMCID: PMC7662002
- DOI: 10.2105/AJPH.2020.305913
COVID-19 and Overall Mortality Inequities in the Surge in Death Rates by Zip Code Characteristics: Massachusetts, January 1 to May 19, 2020
Abstract
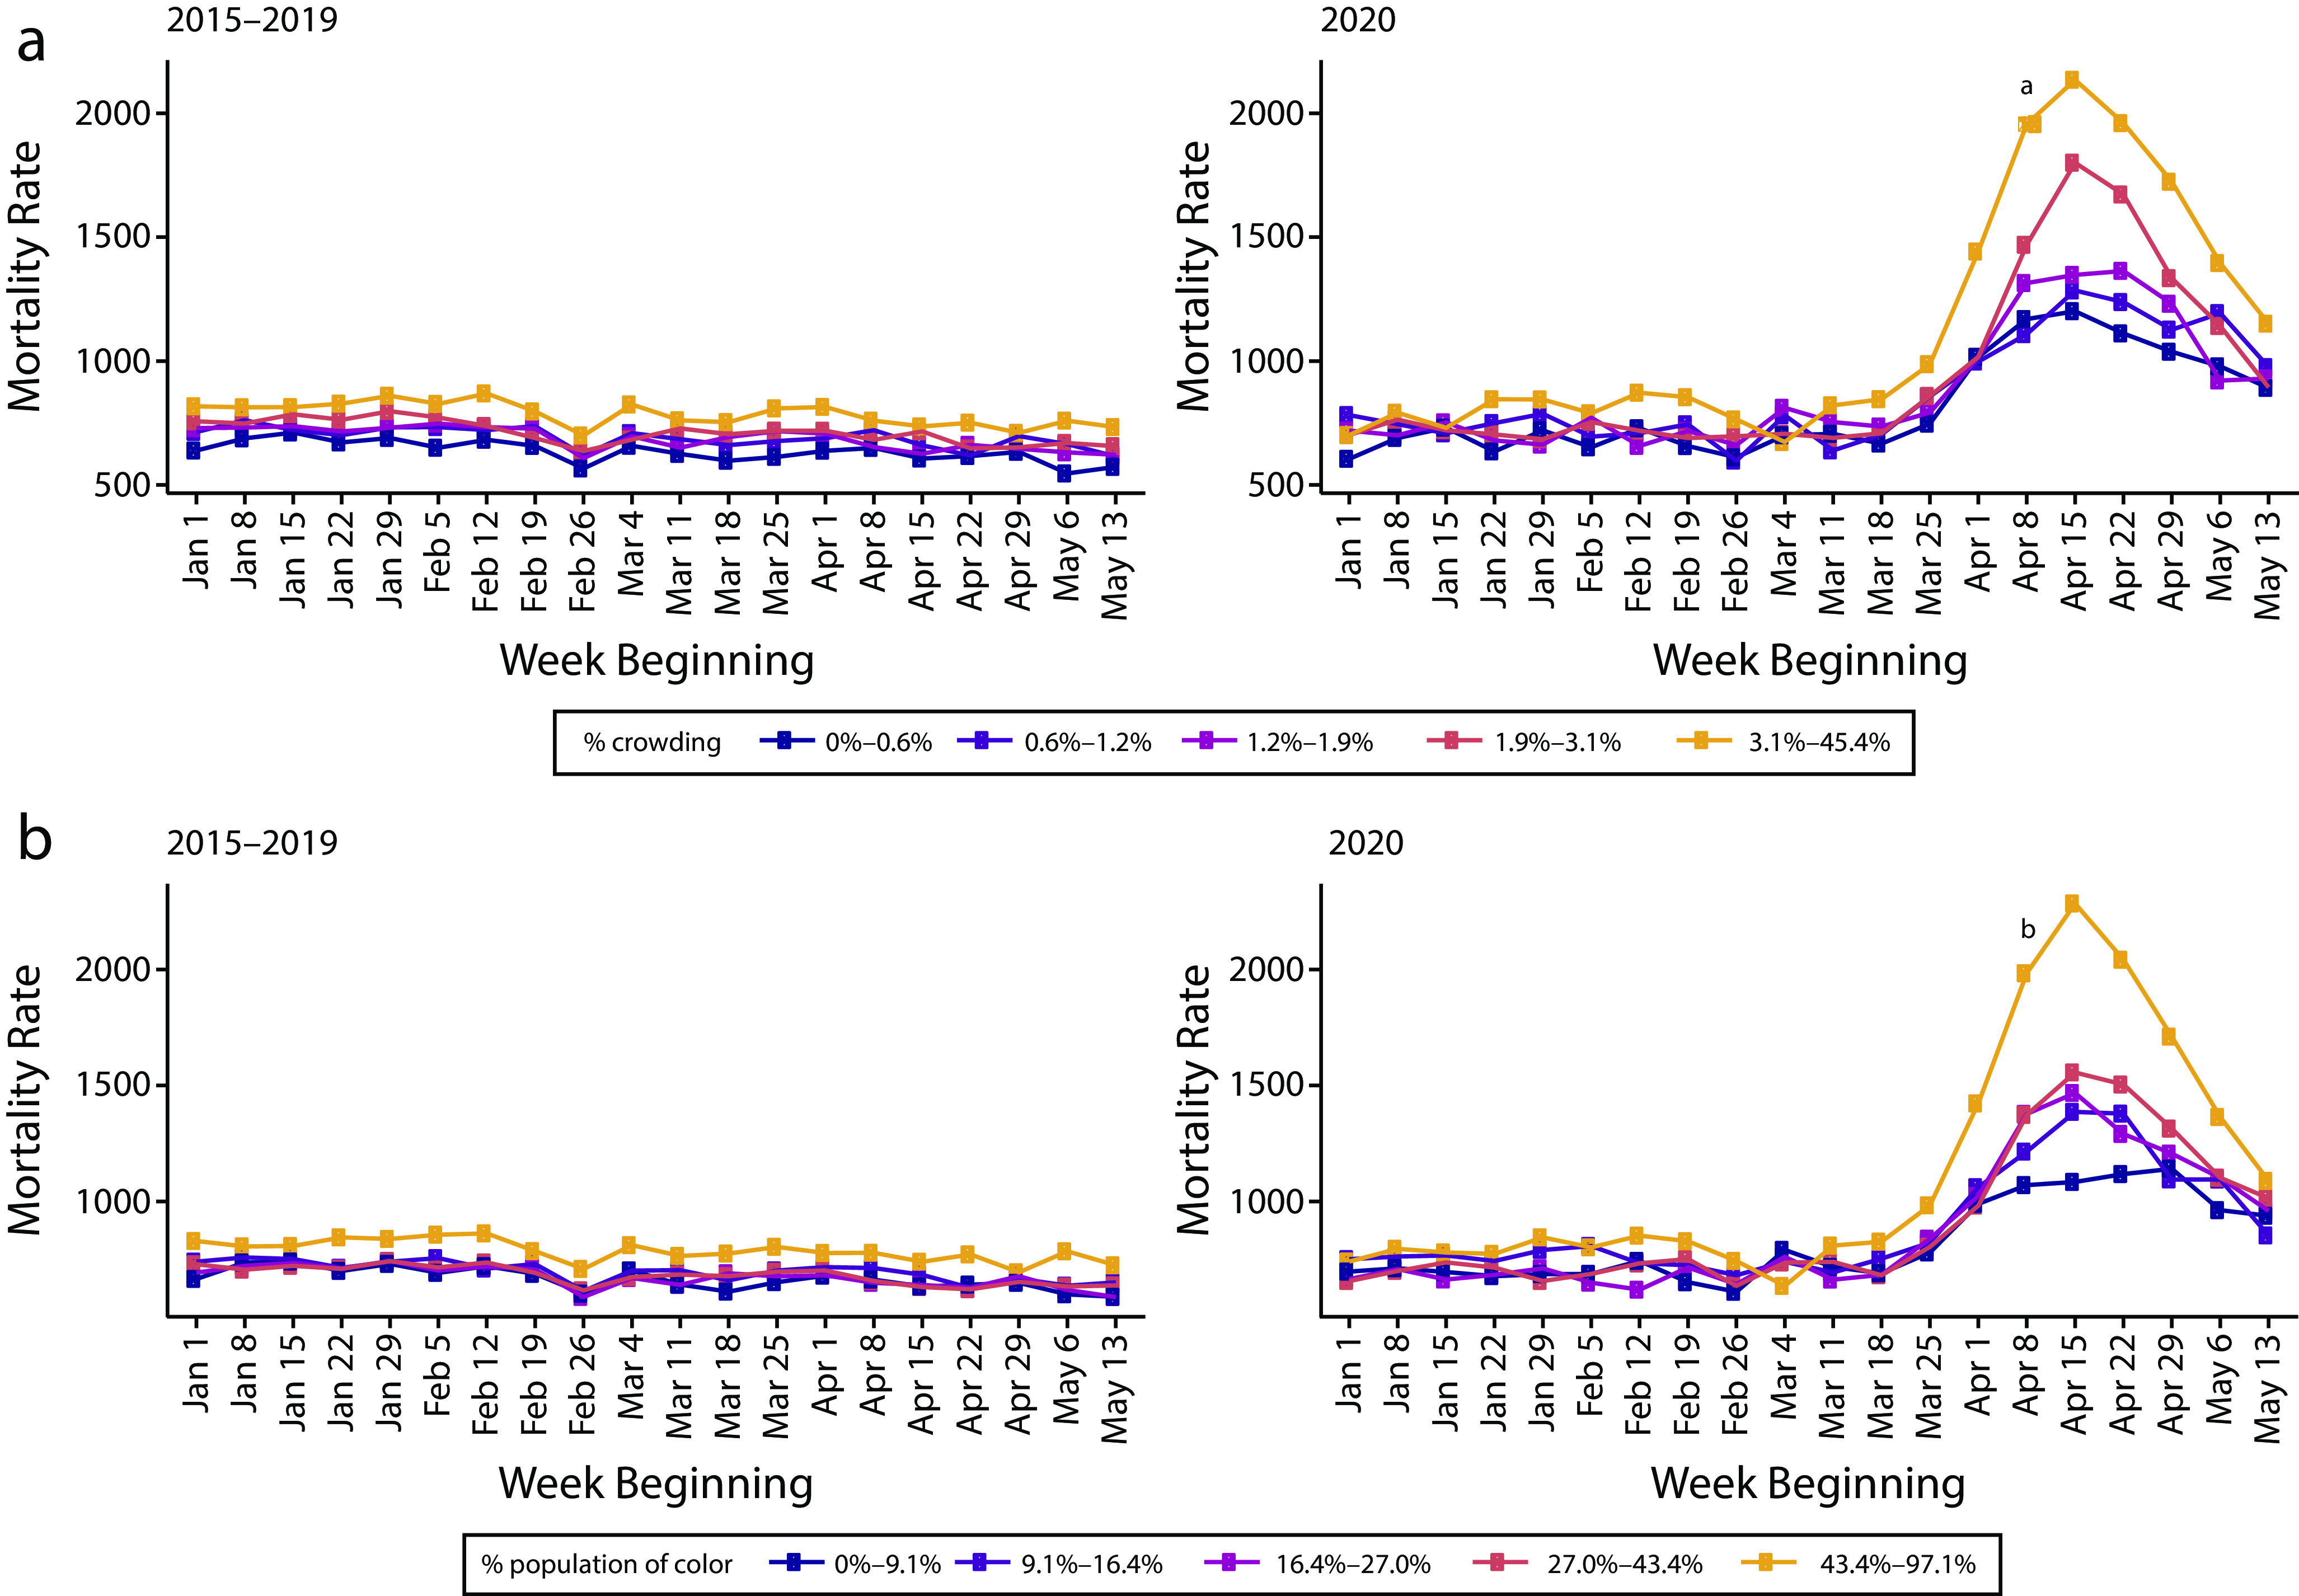
Objectives. To address evidence gaps in COVID-19 mortality inequities resulting from inadequate race/ethnicity data and no socioeconomic data.Methods. We analyzed age-standardized death rates in Massachusetts by weekly time intervals, comparing rates for January 1 to May 19, 2020, with the corresponding historical average for 2015 to 2019 stratified by zip code social metrics.Results. At the surge peak (week 16, April 15-21), mortality rate ratios (comparing 2020 vs 2015-2019) were 2.2 (95% confidence interval [CI] = 1.4, 3.5) and 2.7 (95% CI = 1.4, 5.5) for the lowest and highest zip code tabulation area (ZCTA) poverty categories, respectively, with the 2020 peak mortality rate 1.1 (95% CI = 1.0, 1.3) times higher in the highest than the lowest poverty ZCTA. Similarly, rate ratios were significantly elevated for the highest versus lowest quintiles with respect to household crowding (1.7; 95% CI = 1.0, 2.9), racialized economic segregation (3.1; 95% CI = 1.8, 5.3), and percentage population of color (1.8; 95% CI = 1.6, 2.0).Conclusions. The COVID-19 mortality surge exhibited large inequities.Public Health Implications. Using zip code social metrics can guide equity-oriented COVID-19 prevention and mitigation efforts.
Figures
References
-
- Krieger N, Gonsalves G, Bassett MT, Hanage W, Krumholz HM. The fierce urgency of now: closing glaring gaps in US surveillance data on COVID-19. Available at: https://www.healthaffairs.org/do/10.1377/hblog20200414.238084/full. Accessed July 29, 2020. - DOI
-
- Villarosa L. “A terrible price”: the deadly racial disparities of COVID-19 in America. Available at: https://www.nytimes.com/2020/04/29/magazine/racial-disparities-covid-19..... Accessed July 29, 2020.
-
- COVID Tracking Project. COVID racial data tracker. Available at: https://covidtracking.com/race. Accessed July 29, 2020.
MeSH terms
LinkOut - more resources
Full Text Sources
Medical
Miscellaneous
