. 2020 Nov 12;183(4):1058-1069.e19.
doi: 10.1016/j.cell.2020.09.049. Epub 2020 Sep 23.

A Therapeutic Non-self-reactive SARS-CoV-2 Antibody Protects from Lung Pathology in a COVID-19 Hamster Model

Affiliations

A Therapeutic Non-self-reactive SARS-CoV-2 Antibody Protects from Lung Pathology in a COVID-19 Hamster Model

Jakob Kreye et al. Cell. .

Abstract

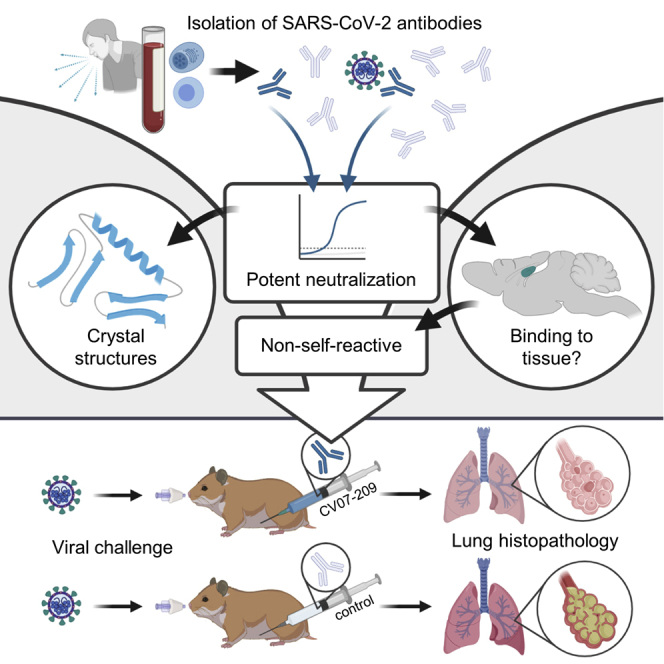
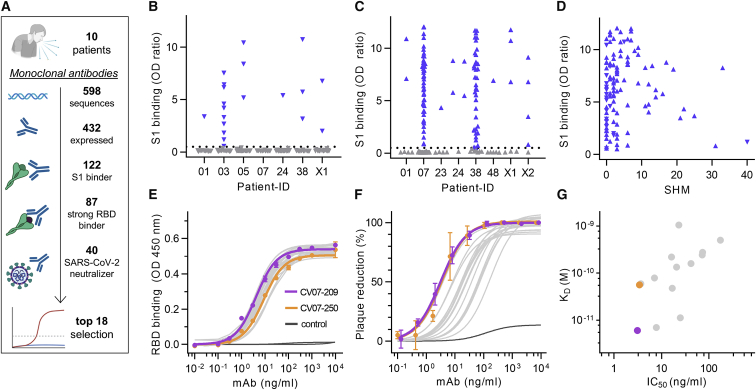
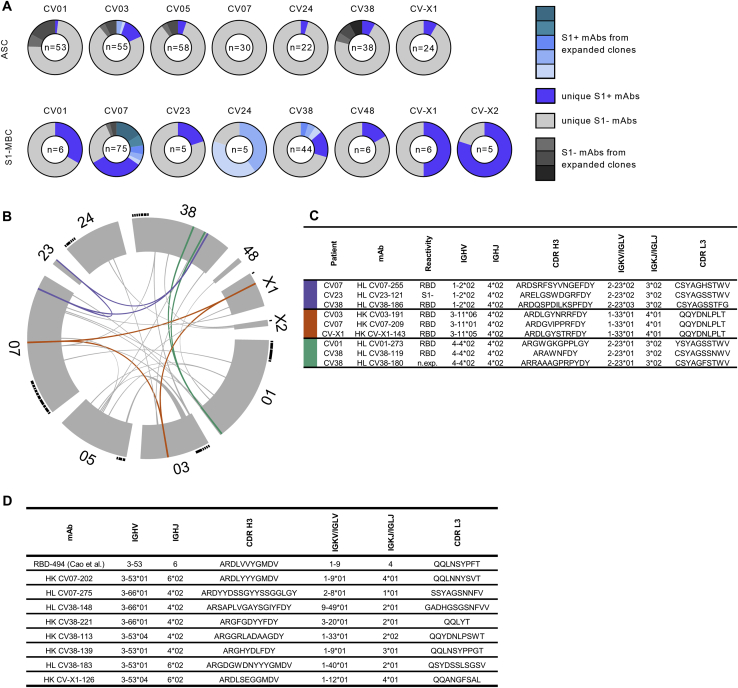
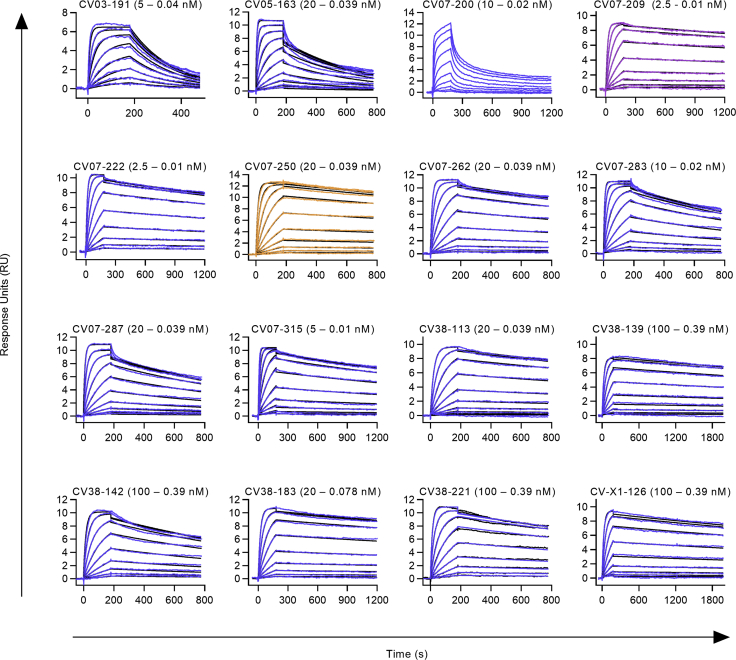
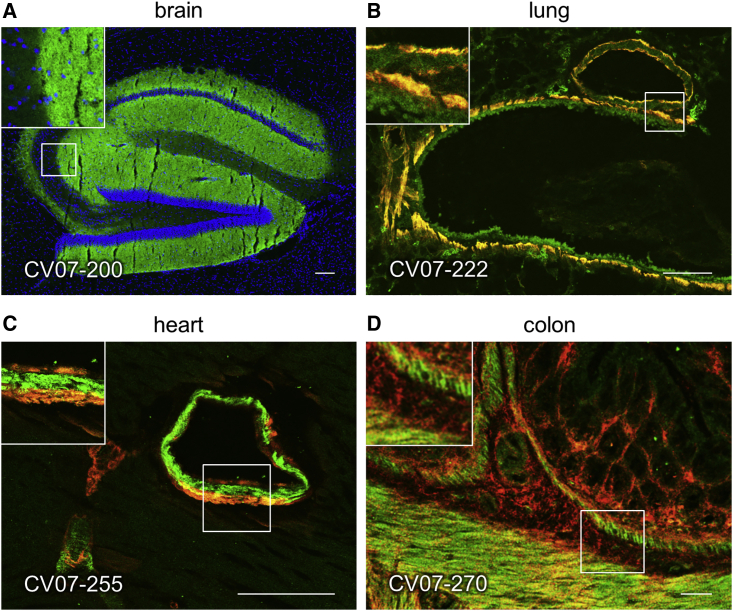
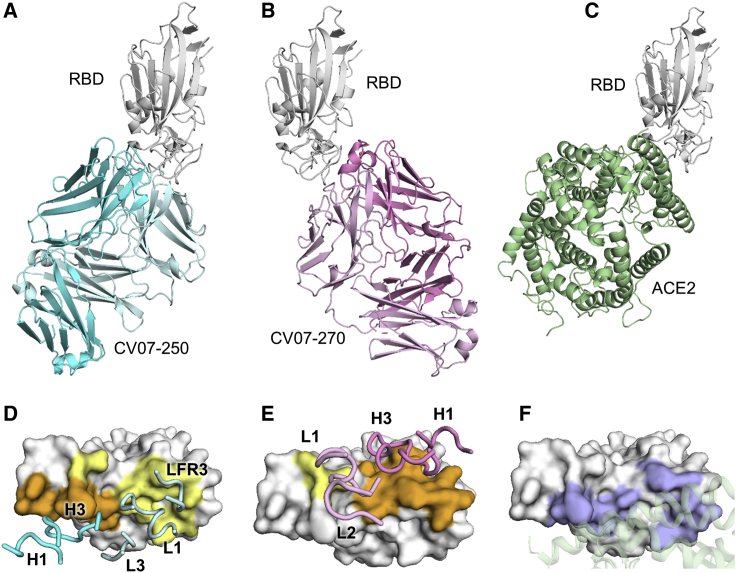
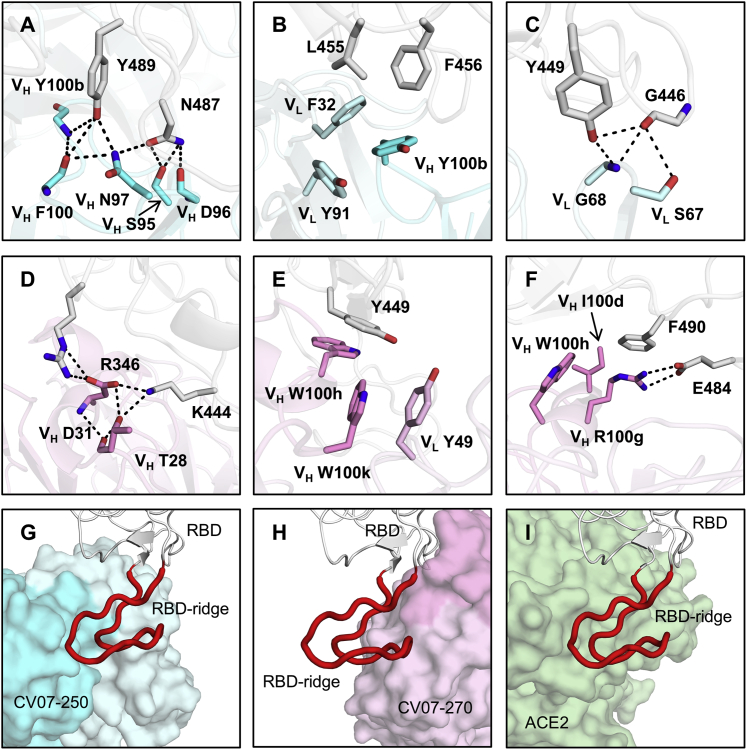
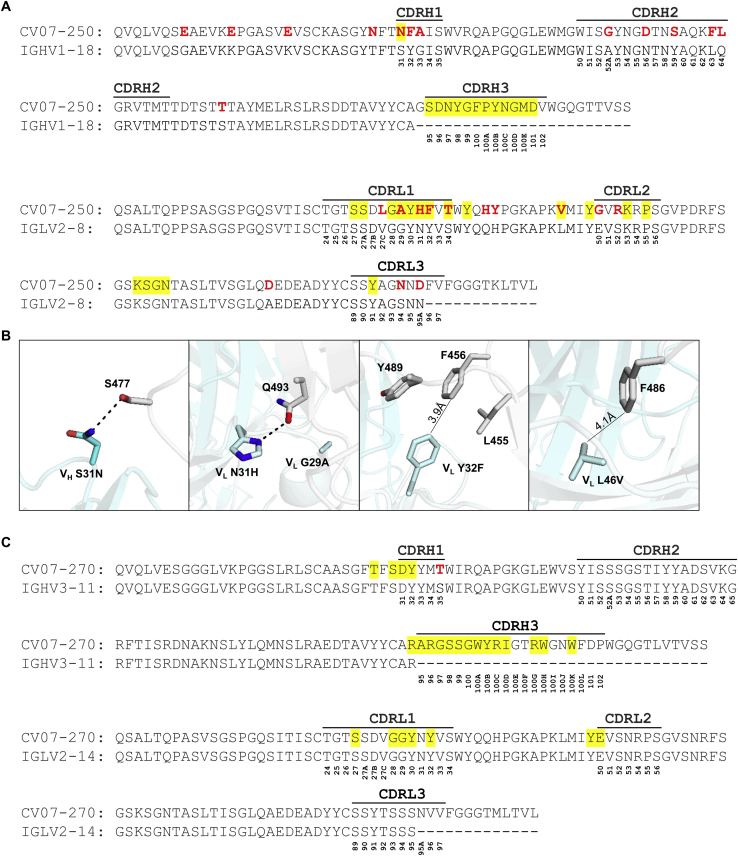
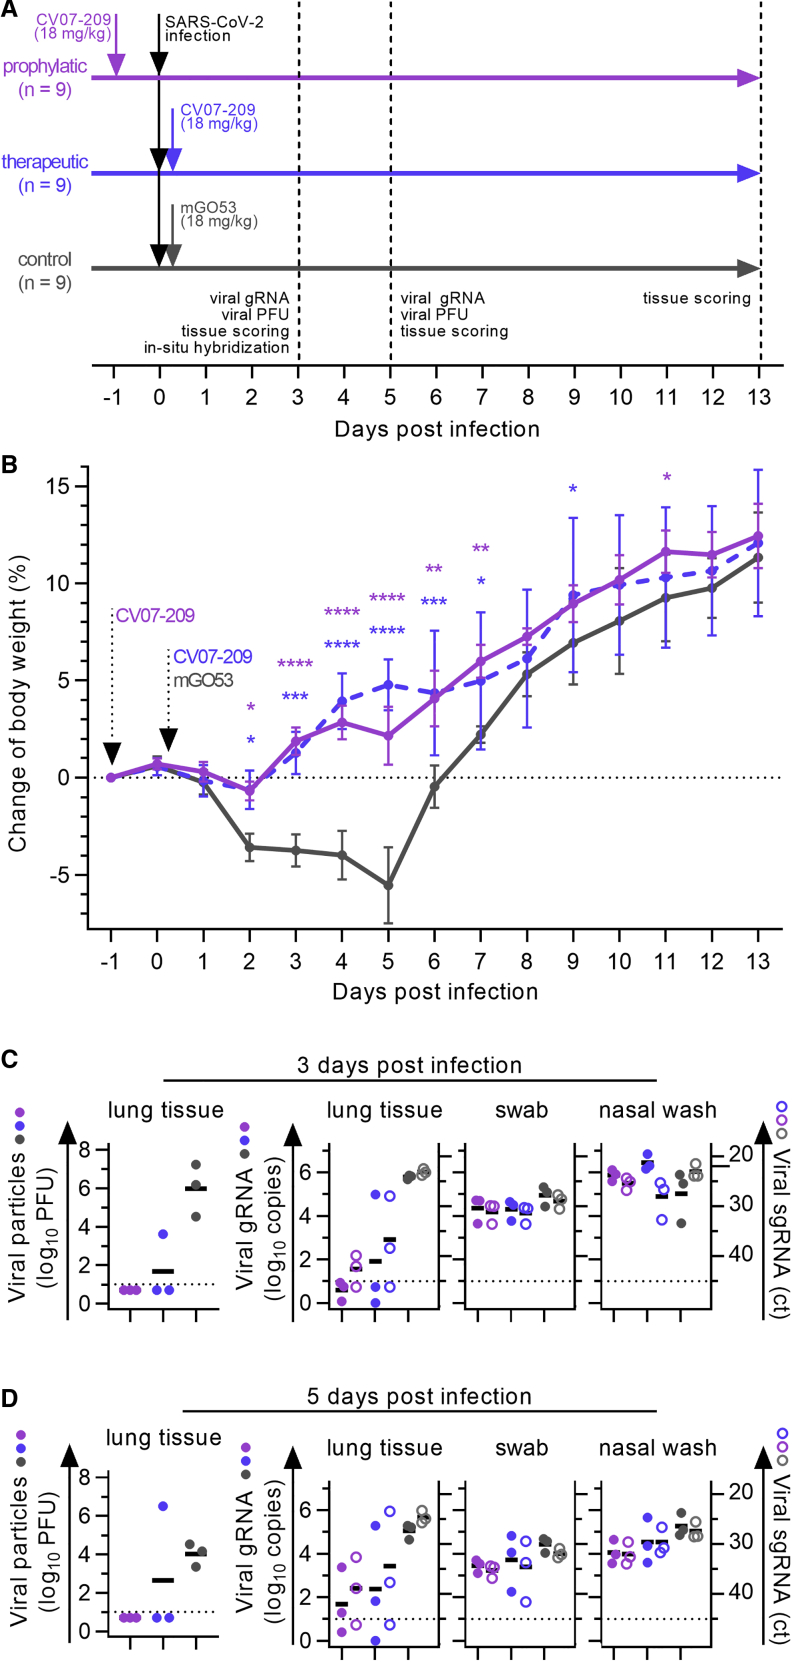
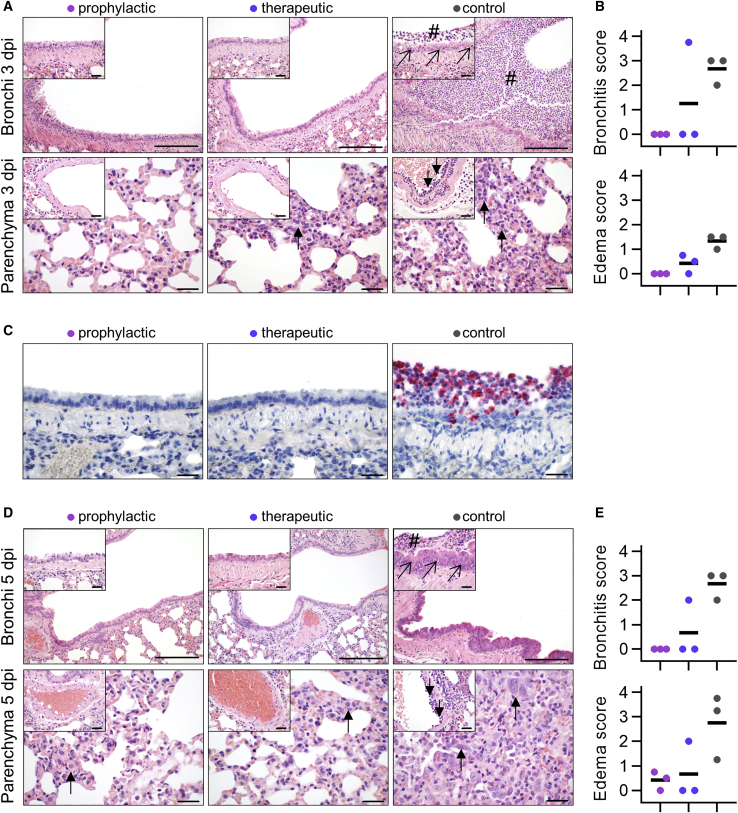
The emergence of SARS-CoV-2 led to pandemic spread of coronavirus disease 2019 (COVID-19), manifesting with respiratory symptoms and multi-organ dysfunction. Detailed characterization of virus-neutralizing antibodies and target epitopes is needed to understand COVID-19 pathophysiology and guide immunization strategies. Among 598 human monoclonal antibodies (mAbs) from 10 COVID-19 patients, we identified 40 strongly neutralizing mAbs. The most potent mAb, CV07-209, neutralized authentic SARS-CoV-2 with an IC50 value of 3.1 ng/mL. Crystal structures of two mAbs in complex with the SARS-CoV-2 receptor-binding domain at 2.55 and 2.70 Å revealed a direct block of ACE2 attachment. Interestingly, some of the near-germline SARS-CoV-2-neutralizing mAbs reacted with mammalian self-antigens. Prophylactic and therapeutic application of CV07-209 protected hamsters from SARS-CoV-2 infection, weight loss, and lung pathology. Our results show that non-self-reactive virus-neutralizing mAbs elicited during SARS-CoV-2 infection are a promising therapeutic strategy.

Keywords: COVID-19; SARS-CoV-2; autoreactivity; crystal structures; hamster model; monoclonal antibody; neutralizing antibody; post-exposure; self-antigens; self-reactivity.


Conflict of interest statement

Declaration of Interests Related to this work, the German Center for Neurodegenerative Diseases (DZNE) and Charité-Universitätsmedizin Berlin have filed a patent application on which J.K., S.M.R., H.-C.K., E.S.-S., V.M.C., M.A.M., D.W., L.E.S., and H.P. are named as inventors.

Figures

None
Graphical abstract
Figure 1
Figure 1
Identification and Characterization of Potent SARS-CoV-2-Neutralizing mAbs (A) Diagram depicting the strategy for isolation of 18 potently neutralizing mAbs (top 18). (B) Normalized binding to S1 of SARS-CoV-2 for mAbs isolated from ASCs (inverted triangles; blue, S1-binding; gray, not S1-binding). OD, optical density in ELISA. (C) Normalized binding to S1 of SARS-CoV-2 for mAbs isolated from S1-stained MBCs (triangles; colors as in B). (D) S1-binding plotted against the number of somatic hypermutations (SHMs) for all S1-reactive mAbs. (E) Concentration-dependent binding of the top 18 SARS-CoV-2 mAbs to the RBD of S1 (mean ± SD from two wells of one experiment). (F) Concentration-dependent neutralization of authentic SARS-CoV-2 plaque formation by the top 18 mAbs (mean ± SD from two independent measurements). (G) Apparent affinities of mAbs to RBDs (KD determined by surface plasmon resonance) plotted against IC50 of authentic SARS-CoV-2 neutralization. See also Figures S1, S2, S3, S4, and S5 and Tables S1, S2, and S3.
Figure S1
Figure S1
SARS-CoV-2-S1 Serum IgG Response from COVID-19 Patients, Flow Cytometry Gating, and Characteristics of Ig Sequences, Related to Figure 1 and Tables S1 and S2 (A) Serum IgG response determined as the normalized optical density (OD) in a SARS-CoV-2-S1 ELISA in relation to the time point of diagnosis defined by the first positive qPCR test. Upward arrowhead denotes the appearance of first symptoms. Downward arrowhead denotes the PBMC isolation. From patient CV01, PBMC samples were isolated at two time points as indicated by the second downward arrow with an asterisk (). (B-C) A representative flow cytometry plot from patient CV38 indicating gating on (B) CD19+CD27+antibody-secreting cells (ASC) and (C) SARS-CoV-2-S1-stained memory B cells (S1-MBC). Cells were pre-gated on live CD19+ B cells. (D) Comparison of somatic hypermutation (SHM) count within immunoglobulint V genes combined from heavy and light chains of S1-reactive (S1+, blue) and non-S1-reactive (S1-, gray) mAbs. Statistical significance was determined using a Kruskal-Wallis test with Dunn’s multiple comparison test. (ASC: n = 20 S1+, n = 260 S1-; S1-MBC: n = 102 S1+, n = 50 S1-, n-values represent number of mAbs). All expressed mAbs are displayed. Each triangle represents one mAb, isolated from an ASC (inverted triangle) or a S1-MBC (triangle). Bars indicate mean. (E-F) Length comparison of complementarity-determining region (CDR) 3 amino acid sequences between S1+ and S1- mAbs within (E) heavy and (F) light chains. Bars indicate mean. Symbols and colors have the same meaning as in (D). (G) Frequency of RBD-binder (S1+RBD+) and non-RBD-binder (S1+RBD-) relative to all expressed mAbs (upper lanes) and relative to S1+ mAbs (lower lanes).
Figure S2
Figure S2
Comparison of Variable Gene Use, Related to Figure 1 and Table S2 Comparison of gene usage between SARS-CoV-2-S1-reactive (S1+) and non-reactive (S1-) mAbs is shown for immunoglobulin (A) variable heavy (IGHV), (B) variable kappa (IGKV) and (C) variable lambda (IGLV) genes. Bars depict percentage of gene usage of all expressed mAbs within each group.
Figure S3
Figure S3
Clonal Expansion and Public or Common Clonotypes, Related to Figure 1 and Table S2. (A) Pie charts represent clonal relationship of all expressed mAbs from each donor separately for antibody secreting cells (ASC) and S1-stained memory B cells (S1-MBC). mAbs were considered S1-reactive (S1+) or non-S1-reactive (S1-) based on SARS-CoV-2-S1 ELISA measurements. Antibodies were considered to be clonally expanded when they were isolated from multiple cells. (B) Circos plot displays all isolated mAbs from ten donors. Interconnecting lines indicate relationship between mAbs that share the same V and J gene on both Ig heavy and light chain. Such public or shared clonotypes in which more than 50% of mAbs are S1-reactive are represented as colored lines. Small black angles at the outer circle border indicate expanded clones within the respective donor. (C) Properties of public clonotypes from S1+ mAbs according to the colors used in (B) with sequence similarities between mAbs isolated from different donors, also within CDR3. (D) Public or common antibody response using VH3-53 and VH3-66 genes. IGHV, IGHJ IGKV, IGKJ, IGLV, IGLJ = V (variable) and J (joining) genes of immunoglobulin heavy, kappa, lambda chains; CDR = complementarity-determining region; n.exp. = not expressed.
Figure S4
Figure S4
Binding Kinetic Measurements of mAbs to the RBD, Related to Figure 1 and Table S3 Binding kinetics of mAbs to RBD were modeled (black) from multi-cycle surface plasmon resonance (SPR) measurements (blue, purple, orange). Fitted monovalent analyte model is shown. For CV07-200, neither a bivalent nor a monovalent analyte model described the data accurately (no model is shown). Three out of the 18 selected mAbs for detailed characterization (top 18) were not analyzed using multi-cycle-kinetics: CV07-270 was excluded as it interacted with the anti-mouse IgG reference surface on initial qualitative measurements. CV07-255 and CV-X2-106 were not analyzed since they showed biphasic binding kinetics and relatively fast dissociation rates in initial qualitative measurements. Non-neutralizing CV03-191, a mAb not included in the top 18 mAbs, was included in the multicycle experiments as it has the same clonotype as strongly neutralizing CV07-209 (Figure S4C). All measurements are performed by using a serial 2-fold dilution of mAbs on reversibly immobilized SARS-CoV-2-S1 RBD-mFc.
Figure S5
Figure S5
Binding Epitope Characterization of Selected mAbs, Related to Figures 1, 3, and 4 and Table S3 (A) Competition for RBD binding between top 18 mAbs and ACE2. ELISA-based measurements of human ACE2 binding to SARS-CoV-2 RBD after pre-incubation with the indicated neutralizing mAbs. Values are shown relative to antibody-free condition as mean + SD from three independent measurements. (B) Competition for RBD binding between combinations of potent neutralizing mAbs is illustrated as a heatmap. Shades of green indicate the degree of competition for RBD binding of detection mAb in presence of 100-fold excess of competing mAb relative to non-competition conditions. Green squares indicate no competition. Values are shown as mean of two independent experiments. (C) Representative immunofluorescence staining on VeroB4 cells overexpressing spike protein of indicated coronavirus with SARS-CoV-2 mAb CV07-209 at 5 μg/ml. For all other 17 of the selected 18 mAbs (top 18, Table S3), similar results were obtained. (D) Binding of indicated mAbs to fusion proteins containing the RBD of indicated coronaviruses and the constant region of rabbit IgG revealed by ELISA. For all other top 18 mAbs, similar results were obtained as for CV07-209. Values indicate mean + SD from two wells of one experiment. (E) Representative HEp-2 cell staining with a commercial anti-nuclear antibody as positive control revealed nuclear binding (top). S1-reactive non-neutralizing mAb CV38-148 exhibited cytoplasmatic binding (middle). Neutralizing mAb CV07-209 showed no binding (bottom). All mAbs selected for detailed characterization (top 18, Table S3) revealed similar results like CV07-209 when used at 50 μg/ml. Representative scale bar: 25 μm. (F) Structural comparison of CV07-270/RBD and P2B-2F6/RBD complexes. Structure of CV07-270 (pink, left) and structure of P2B-2F6 (PDB 7BWJ) (Ju et al., 2020) (blue, middle) in complex with RBD (white), as well as superimposition of the structures of CV07-270/RBD and P2B-2F6/RBD based on the RBD (right).
Figure 2
Figure 2
SARS-CoV-2-Neutralizing Antibodies Can Bind to Murine Tissue Immunofluorescence staining of SARS-CoV-2 mAbs (green) on murine organ sections showed specific binding to distinct anatomical structures. (A) Staining of hippocampal neuropil with CV07-200 (cell nuclei depicted in blue). (B) Staining of bronchial walls with CV07-222. (C) Staining of vascular walls with CV07-255. (D) Staining of intestinal walls with CV07-270. Smooth muscle tissue in (B)–(D) was co-stained with a commercial smooth muscle actin antibody (red). Scale bars, 100 μm. See also Table S3.
Figure 3
Figure 3
Crystal Structures of mAbs in Complex with the SARS-CoV-2 RBD (A) CV07-250 (cyan) in complex with the RBD (white). (B) CV07-270 (pink) in complex with the RBD (white). (C) Human ACE2 with the SARS-CoV-2 RBD (PDB: 6M0J; Lan et al., 2020). (D and E) Epitopes of (D) CV07-250 and (E) CV07-270. Epitope residues contacting the heavy chain are shown in orange and those contacting the light chain in yellow. CDR loops and the framework region that contact the RBD are labeled. (F) ACE2-binding residues on the RBD (blue) in the same view as in (D) and (E). The ACE2-interacting region is shown in green within a semi-transparent cartoon representation. See also Figures S5 and S6 and Tables S4 and S5.
Figure 4
Figure 4
Interactions and Angle of Approach at the RBD-Antibody Interface (A–C) Key interactions between CV07-250 (cyan) and the RBD (white) are highlighted. (A) CDR H3 of CV07-250 forms a hydrogen bond network with RBD Y489 and N487. (B) VH Y100b (CDR H3), VL F32 (CDR L1), and VL Y91 (CDR L3) of CV07-250 form a hydrophobic aromatic patch for interaction with RBD L455 and F456. (C) The side chain of VL S67 and backbone amide of VL G68 from FR3 are engaged in a hydrogen bond network with RBD G446 and Y449. (D–F) Interactions between CV07-270 (cyan) and the RBD (white). (D) Residues in CDR H1 of CV07-270 participate in an electrostatic and hydrogen bond network with RBD R346 and K444. (E) VH W100h and VH W100k on CDR H3 of CV07-270 make π-π stacking interactions with Y449. VH W100k is also stabilized by a π-π stacking interaction with VL Y49. (F) VH R100 g on CDR H3 of CV07-270 forms an electrostatic interaction with RBD E484 as well as a π-cation interaction with RBD F490. Oxygen atoms are shown in red and nitrogen atoms in blue. Hydrogen bonds are represented by dashed lines. (G–I) Magnified views of the different RBD ridge interactions with (G) CV07-250, (H) CV07-270, and (I) ACE2 (PDB: 6M0J; Lan et al., 2020). The ACE2-binding ridge in the RBD is represented by a backbone ribbon trace in red. See also Figures S5 and S6 and Tables S4 and S5.
Figure S6
Figure S6
Comparison of Sequences of CV07-250 and CV07-270 with Their Putative Germline Sequences, Related to Figures 3 and 4 (A) Alignment of CV07-250 with the germline IGHV1-18 sequence (nucleotide SHM rate 5.8%) and IGLV2-8 (nucleotide SHM rate 5.4%). (B) Somatic mutations VH S31H, VL G29A, VL N31H, VL Y32F, VL S34T, and VL L46V are located in the CV07-250 paratope with other somatic mutations in all of the CDRs that may affect overall CDR conformation and interactions. Hydrogen bonds are represented by dashed lines. Distances between atoms are shown in solid lines. CV07-250 heavy chain is in dark cyan and light chain is in light cyan. SARS-CoV-2 RBD is in light gray. (C) Alignment of CV07-270 with the germline IGHV3-11 sequence (nucleotide SHM rate 0.7%) and IGLV2-14 (nucleotide SHM rate 0%). The regions that correspond to CDR H1, H2, H3, L1, L2, and L3 are indicated. Residues that differ from the germline are highlighted in red. Residues that interact with the RBD are highlighted in yellow. Residue positions in the CDRs are labeled according to the Kabat numbering scheme.
Figure 5
Figure 5
Prophylactic and Therapeutic Application of mAb CV07-209 in a COVID-19 Hamster Model (A) Schematic overview of the animal experiment. (B) Body weight of hamsters after virus challenge and prophylactic (pink) or therapeutic (blue) application of the SARS-CoV-2-neutralizing mAb CV07-209 or control antibody (mean ± SEM from 9 animals per group from days −1 to 3, n = 6 from days 4–5; n = 3 from days 6–13; mixed-effects model with post hoc Dunnett’s multiple tests in comparison with the control group; significance levels are shown as p < 0.05, ∗∗p < 0.01, ∗∗∗p < 0.001, and ∗∗∗∗p < 0.0001 or not shown when not significant. (C and D) Left: quantification of plaque-forming units (PFU) from lung homogenates. Right: quantification of genomic SARS-CoV-2 RNA (gRNA) as copies per 105 cellular transcripts (left y axis, filled circles) and cycle threshold (ct) of subgenomic SARS-CoV-2 RNA (sgRNA) detection (right y axis, unfilled circles) from samples and time points as indicated. Values for PFUs were set to 5 when not detected, gRNA copies below 1 were set to 1, and the ct of sgRNA was set to 46 when not detected. Bars indicate the mean. Dotted lines represent the detection threshold. See also Figure 6 and Table S6.
Figure 6
Figure 6
Histopathological Analysis of Hamsters after SARS-CoV-2 Infection (A) Histopathology of representative hematoxylin-and-eosin-stained, paraffin-embedded bronchi with inserted epithelium (top row) and lung parenchyma with inserted blood vessels (bottom row) at 3 dpi. Severe suppurative bronchitis with immune cell infiltration (hash symbol) is apparent only in the control-treated animals with necrosis of bronchial epithelial cells (diagonal arrows). Necro-suppurative interstitial pneumonia (upward arrows) with endothelialitis (downward arrows) is prominent in control-treated animals. Scale bars, 200 μm in the bronchus overview, 50 μm in all others. (B) Bronchitis and edema score at 3 dpi. Bars indicate the mean. (C) Detection of viral RNA (red) using in situ hybridization of representative bronchial epithelium present only in the control group. Scale bars, 50 μm. (D) Histopathology of representative lung sections from areas comparable with (A) at 5 dpi. Staining of bronchi of control-treated animals showed marked bronchial hyperplasia with hyperplasia of epithelial cells (diagonal arrow) and still existing bronchitis (hash symbol), absent in all prophylactically treated and in 2/3 therapeutically treated animals (top row). Lung parenchyma staining of control-treated animals showed severe interstitial pneumonia with marked type II alveolar epithelial cell hyperplasia and endothelialitis (insets, downward arrows). Compared with control-treated animals, prophylactically treated animals showed only mild signs of interstitial pneumonia with mild type II alveolar epithelial cell hyperplasia (upward arrow), whereas therapeutically treated animals showed a more heterogeneous picture, with 1/3 animals showing no signs of lung pathology, 1/3 animals showing only mild signs of interstitial pneumonia, and 1/3 animals showing moderate multifocal interstitial pneumonia. Scale bars, 200 μm in the bronchus overview, 50 μm in all others. (E) Bronchitis and edema score at 5 dpi. Bars indicate the mean. See also Figure 5 and Table S6.

Update of

  • A SARS-CoV-2 neutralizing antibody protects from lung pathology in a COVID-19 hamster model.
    Kreye J, Reincke SM, Kornau HC, Sánchez-Sendin E, Max Corman V, Liu H, Yuan M, Wu NC, Zhu X, Lee CD, Trimpert J, Höltje M, Dietert K, Stöffler L, von Wardenburg N, van Hoof S, Homeyer MA, Hoffmann J, Abdelgawad A, Gruber AD, Bertzbach LD, Vladimirova D, Li LY, Barthel PC, Skriner K, Hocke AC, Hippenstiel S, Witzenrath M, Suttorp N, Kurth F, Franke C, Endres M, Schmitz D, Jeworowski LM, Richter A, Schmidt ML, Schwarz T, Müller MA, Drosten C, Wendisch D, Sander LE, Osterrieder N, Wilson IA, Prüss H. Kreye J, et al. bioRxiv [Preprint]. 2020 Aug 16:2020.08.15.252320. doi: 10.1101/2020.08.15.252320. bioRxiv. 2020. Update in: Cell. 2020 Nov 12;183(4):1058-1069.e19. doi: 10.1016/j.cell.2020.09.049. PMID: 32817952 Free PMC article. Updated. Preprint.

Comment in

  • 'nAb' the self-reactive activity in the COVID-19 combat.
    Narasimhan M, Mahimainathan L, Muthukumar A. Narasimhan M, et al. Signal Transduct Target Ther. 2021 Mar 2;6(1):105. doi: 10.1038/s41392-021-00518-2. Signal Transduct Target Ther. 2021. PMID: 33654054 Free PMC article. No abstract available.

References

    1. Adams P.D., Afonine P.V., Bunkóczi G., Chen V.B., Davis I.W., Echols N., Headd J.J., Hung L.W., Kapral G.J., Grosse-Kunstleve R.W. PHENIX: a comprehensive Python-based system for macromolecular structure solution. Acta Crystallogr. D Biol. Crystallogr. 2010;66:213–221. - PMC - PubMed
    1. Bailey L.J., Sheehy K.M., Dominik P.K., Liang W.G., Rui H., Clark M., Jaskolowski M., Kim Y., Deneka D., Tang W.J., Kossiakoff A.A. Locking the Elbow: Improved Antibody Fab Fragments as Chaperones for Structure Determination. J. Mol. Biol. 2018;430:337–347. - PMC - PubMed
    1. Barnes C.O., West A.P., Jr., Huey-Tubman K.E., Hoffmann M.A.G., Sharaf N.G., Hoffman P.R., Koranda N., Gristick H.B., Gaebler C., Muecksch F. Structures of Human Antibodies Bound to SARS-CoV-2 Spike Reveal Common Epitopes and Recurrent Features of Antibodies. Cell. 2020;182:828–842.e16. - PMC - PubMed
    1. Baum A., Copin R., Ajithdoss D., Zhou A., Lanza K., Negron N., Ni M., Wei Y., Atwal G.S., Oyejide A. REGN-COV2 antibody cocktail prevents and treats SARS-CoV-2 infection in rhesus macaques and hamsters. bioRxiv. 2020 doi: 10.1101/2020.08.02.233320. - DOI - PMC - PubMed
    1. Brouwer P.J.M., Caniels T.G., van der Straten K., Snitselaar J.L., Aldon Y., Bangaru S., Torres J.L., Okba N.M.A., Claireaux M., Kerster G. Potent neutralizing antibodies from COVID-19 patients define multiple targets of vulnerability. Science. 2020;369:643–650. - PMC - PubMed

Publication types

MeSH terms