. 2020 Oct 29;183(3):684-701.e14.
doi: 10.1016/j.cell.2020.09.017. Epub 2020 Oct 14.

A MicroRNA Linking Human Positive Selection and Metabolic Disorders

Affiliations

A MicroRNA Linking Human Positive Selection and Metabolic Disorders

Lifeng Wang et al. Cell. .

Abstract

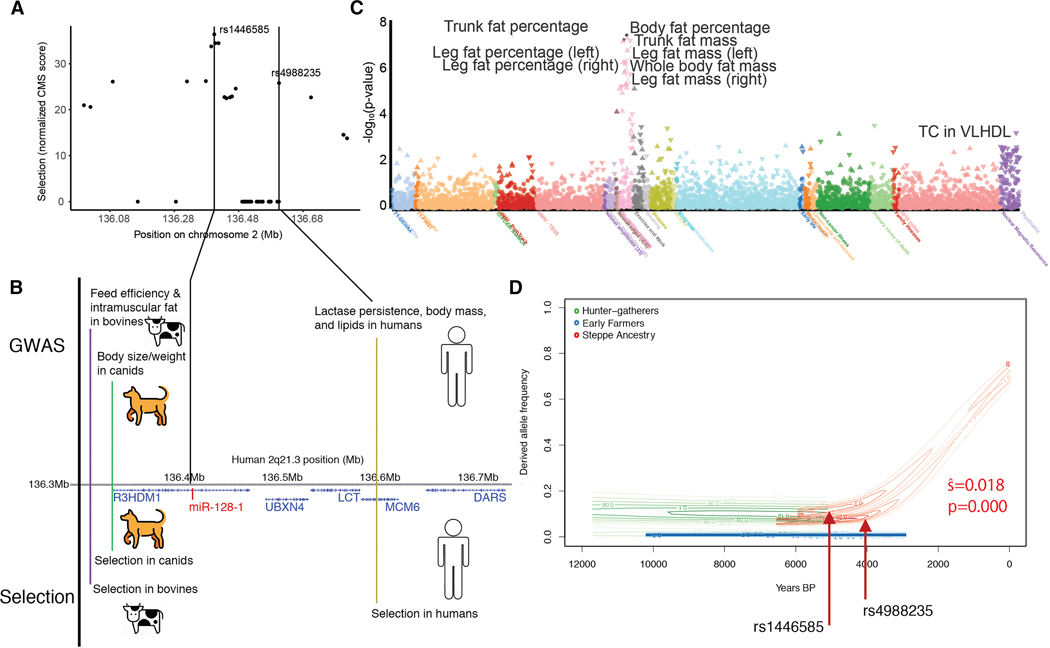
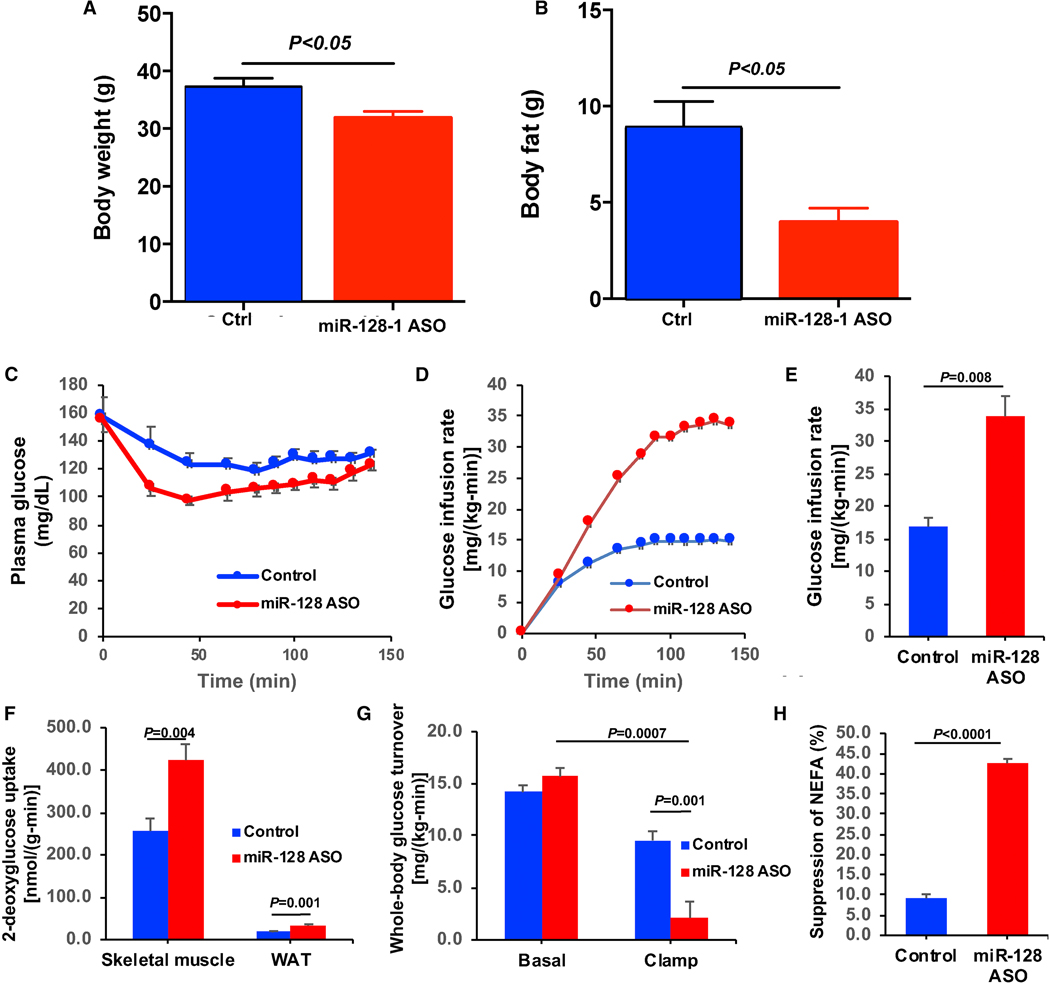
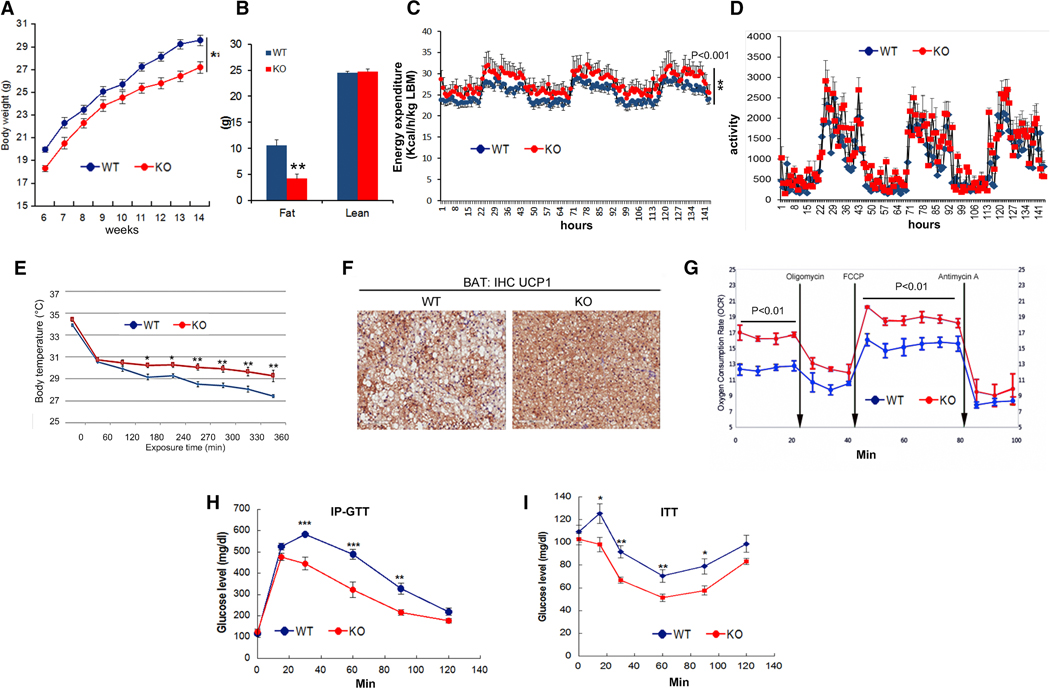
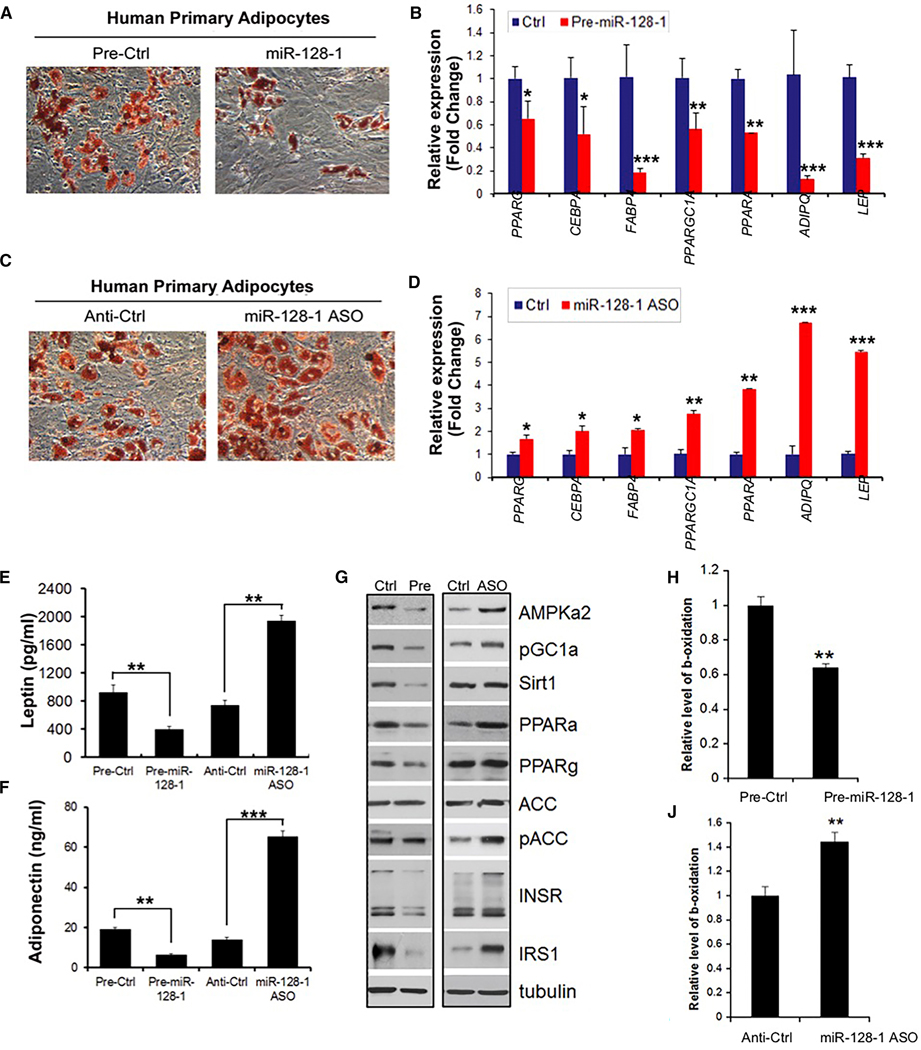
Positive selection in Europeans at the 2q21.3 locus harboring the lactase gene has been attributed to selection for the ability of adults to digest milk to survive famine in ancient times. However, the 2q21.3 locus is also associated with obesity and type 2 diabetes in humans, raising the possibility that additional genetic elements in the locus may have contributed to evolutionary adaptation to famine by promoting energy storage, but which now confer susceptibility to metabolic diseases. We show here that the miR-128-1 microRNA, located at the center of the positively selected locus, represents a crucial metabolic regulator in mammals. Antisense targeting and genetic ablation of miR-128-1 in mouse metabolic disease models result in increased energy expenditure and amelioration of high-fat-diet-induced obesity and markedly improved glucose tolerance. A thrifty phenotype connected to miR-128-1-dependent energy storage may link ancient adaptation to famine and modern metabolic maladaptation associated with nutritional overabundance.


Conflict of interest statement

Declaration of Interests A.M.N. has issued patents on miR-128-1 (U.S. Pat. Nos. 9,045,749; 9,476,046; 9,789,132).

Figures

Figure 1.
Figure 1.. Selection at the 2q21.3 locus in mammals.
(A) A strong signal of positive selection is present at the 2q21.3 locus, evaluated using the Composite of Multiple Signals (CMS, Grossman et al., 2010). (B) Selection at 2q21.3 across mammals. There is evidence for selection on metabolic and anthropomorphic traits in dogs, cows, and humans. Relative locations annotated on the basis of lead SNPs in other species transferred to human GRCh37. (C) PheWAS of UK Biobank traits at rs1438307. Aggregated traits show a strong effect primarily on body composition and adiposity, with a smaller effect on cholesterol. (D) Ancient DNA from different ancient European populations reveals that that a shared selection event is present at the locus, starting in the Steppe ancestry around 4KY (Mathieson and Mathieson, 2018).
Figure 2.
Figure 2.. The 2q21.3 regulatory circuitry in humans.
(A) Chromatin state maps from 127 cell types for the region surrounding miR-128-1. (B) Hi-C (GM12878) indicates a stable chromatin domain whose boundary coincides with rs1438307. (C) Wider view of the topological domain reveals a larger domain structure also encompassing RAB3GAP1. A further domain contains DARS and CXCR4. (D) The intensity of the CTCF peak of interest and the expression of R3HDM1 gene are strongly increased in the ENCODE cell lines with the variant locus rs1438307. Boxplots of the distributions of CTCF ChIP-seq enrichment near the TSS of UBXN4 gene (left) and the expression of R3HDM1 (right) for the ENCODE samples with two different variants of rs1438307 (T, red vs G, blue). (E) Data from CellMinerCDB, derived from GDSC, show that expression of genes in the locus, spanned by R3HDM1 and MCM6, are highly correlated. (F) The expression of miR-128-1 is highly correlated with the expression of the host gene R3HDM1 (CCLE).
Figure 3.
Figure 3.. Inhibition of miR-128-1 by miR-128-1 ASO prevents diet-induced obesity (DIO), reduces adipocyte hypertrophy and inflammation, prevents liver steatosis and inflammation, increases whole body energy expenditure and improves glucose homeostasis.
(A) Representative picture of DIO mice treated with miR-128-1 ASO or control anti-miR at 18 weeks. (B) Body weight, (C) body composition and (D) DIO mouse tissue images from miR-128-1 ASO and control treatment groups (n=10 per group). Representative histology data (H&E and IHC) of BAT (E), EPI-WAT (G) and liver (I) from the miR-128-1 ASO and control treatment groups (n=6 per group). Expression of marker genes related to (F) BAT identity (H) epididymal WAT inflammation and (J) liver steatosis was determined by qRT-PCR from the DIO mice. Expression of marker genes in muscle related to glucose homeostasis (K) and energy expenditure (L) was determined by qRT-PCR and western blotting (M). (N) whole body energy expenditure differences were measured in metabolic cages between the miR-128-1 ASO and control group (n=10 per group). Intraperitoneal (IP)-glucose tolerance (O) and insulin tolerance tests (P) were performed after 14 weeks of miR-128-1 ASO and control treatment. Error bars represent SEM. Student’s t test, *P<0.05, **P<0.01, ***P<0.001, compared to mice injected with control ASO.
Figure 4.
Figure 4.. Anti-miR-128-1 treatment of DIO mice improves hepatic, skeletal muscle, and adipocyte insulin sensitivity.
(A) Body weight and (B) body fat percentage in anti-miR-128-1 treated and control HFD-fed mice. (C) Plasma glucose concentrations during the hyperinsulinemic-euglycemic clamp. (D) Glucose infusion rate required to maintain euglycemia during the clamp studies. (E) Steady state (100–140 min) glucose infusion rates required to maintain euglycemia during the clamp. (F) Insulin-stimulated glucose uptake in skeletal muscle and white adipose tissue. (G) Basal and insulin mediated suppression of endogenous glucose production during the clamp. (H) Insulin-mediated suppression of plasma NEFA during the clamp. In all panels, data are expressed as the mean±SEM of n=7 mice per group, with comparisons by the 2-tailed paired (basal vs. clamp) or unpaired (control vs. miR-128-1 ASO) Student’s t-test.
Figure 5.
Figure 5.. miR-128-1 deficiency prevents adiposity, increases whole body energy expenditure and improves glucose homeostasis.
(A) Body weight and (B) body composition of WT and miR-128-1 KO mice (n=10 per group). (C) Whole body energy expenditure and (D) activity differences between miR-128-1 KO and WT mice were measured in metabolic cages (n=10 per group). (E) Rectal temperatures of cold (4°C) exposed miR-128-1 KO mice and WT animals (n=6 per group). (F) Representative IHC of Ucp1 in BAT KO group were compared to WT mice (n=6 per group). (G) Energy expenditure differences of brown adipocytes isolated from miR-128-1 KO and WT mice. IP-Glucose tolerance (H) and insulin tolerance tests (I) of miR-128-1 KO and WT mice were performed at 10 weeks of HFD feeding. Error bars represent SEM. Student’s t test, *P<0.05, **P<0.01, ***P<0.001, compared to control mice.
Figure 6.
Figure 6.. Manipulation of miR-128-1 level in primary human adipocytes alters differentiation state, energy expenditure and leptin/adiponectin secretion.
Over-expression of pre-miR-128-1 prevents primary human adipocyte differentiation (A) and reduces adipocyte hallmark gene expression (B) anti-miR-128-1 promotes primary human adipocyte differentiation (C) and upregulates adipocyte hallmark gene expression (D). Levels of leptin (E) and adiponectin (F) secreted from human primary adipocytes treated with miR-128-1 pre-cursor and anti-miR-128-1. (G) Cellular levels of adipocyte genes in primary human adipocytes were confirmed by western blotting. FAO changes in primary human adipocytes induced by overexpressing miR-128-1 (H) or knockdown (I) was assessed. Errors bars represent mean ± SD. Student’s t-test, *P<0.05, **P<0.01, ***P<0.001, compared to cells transfected with control ASO.
Figure 7.
Figure 7.. miR-128-1 controls primary brown adipocyte differentiation/identity and energy expenditure and restricts trans-differentiation of muscle cell to brown adipocyte lineage.
(A) miR-128-1 WT and KO primary brown adipocytes were induced to differentiate to mature brown adipocytes and stained with Oil-red O. (B) Mitochondrial respiration of miR-128-1 WT and KO brown adipocytes was measured by Seahorse analysis. (C-G) Brown adipocyte marker gene expression of miR-128-1 WT and KO brown adipocytes was measured by qRT-PCR. (H-M) Introduction of miR-128-1 pre-cursor or anti-miR-128-1 into mature brown adipocytes. (H, K) Analysis of expression of brown adipose marker genes and energy expenditure genes by qRT-PCR. (I-M) The brown adipocyte activator dbcAMP stimulates Pgc-1α and Ucp-1 expression in mature mouse brown adipocytes. (N) Anti-miR-128-1 induces C2C12 myoblast differentiation into brown adipocytes. C2C12 myoblasts were stained with Oil-red O after 8 days of treatment. (O-Q) Pan-adipocyte and brown adipose-specific marker expression was determined by qRT-PCR and Western blotting. (R) Myotube formation was assessed after 5 days of C2C12 myocyte differentiation by qRT-PCR analysis of myotube marker gene expression. FAO (S) and mitochondrial respiration (T) were measured by Seahorse analysis after induction of brown adipocyte differentiation by anti-miR-128-1 treatment. Errors bars represent mean ± SD. Student’s t-test, *P < 0.05, **P < 0.01, ***P < 0.001, compared to WT cells or cells transfected with control ASO.

Comment in

References

    1. Ahfeldt T, Schinzel RT, Lee YK, Hendrickson D, Kaplan A, Lum DH, Camahort R, Xia F, Shay J, Rhee EP, et al. (2012). Programming human pluripotent stem cells into white and brown adipocytes. Nature Cell Biol 14, 209–19. - PMC - PubMed
    1. Albuquerque D, Nobrega C, and Manco L. (2013). The lactase persistence −13910C>T polymorphism shows indication of association with abdominal obesity among Portuguese children. Acta paediatrica 102, e153–157. - PubMed
    1. Allison DB, Kaprio J, Korkeila M, Koskenvuo M, Neale MC, and Hayakawa K. (1996). The heritability of body mass index among an international sample of monozygotic twins reared apart. Int J Obes Relat Metab Disord 20, 501–6. - PubMed
    1. Almon R, Alvarez-Leon EE, and Serra-Majem L. (2012). Association of the European lactase persistence variant (LCT-13910 C>T polymorphism) with obesity in the Canary Islands. PLoS One 7, e43978. - PMC - PubMed
    1. Ambros V. (2004). The functions of animal microRNAs. Nature 431, 350–355. - PubMed

Publication types

MeSH terms