. 2020 Nov 3;28(11):1218-1224.e4.
doi: 10.1016/j.str.2020.10.001. Epub 2020 Oct 15.

The Architecture of Inactivated SARS-CoV-2 with Postfusion Spikes Revealed by Cryo-EM and Cryo-ET

Affiliations

The Architecture of Inactivated SARS-CoV-2 with Postfusion Spikes Revealed by Cryo-EM and Cryo-ET

Chuang Liu et al. Structure. .

Abstract

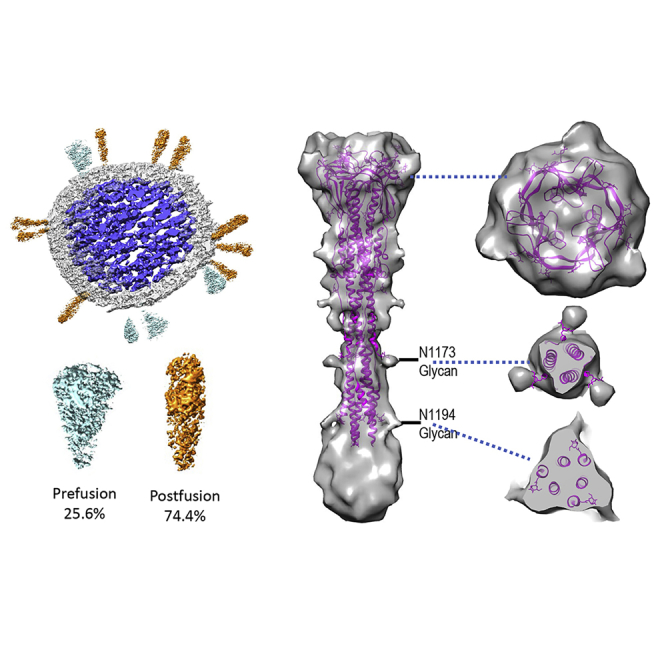
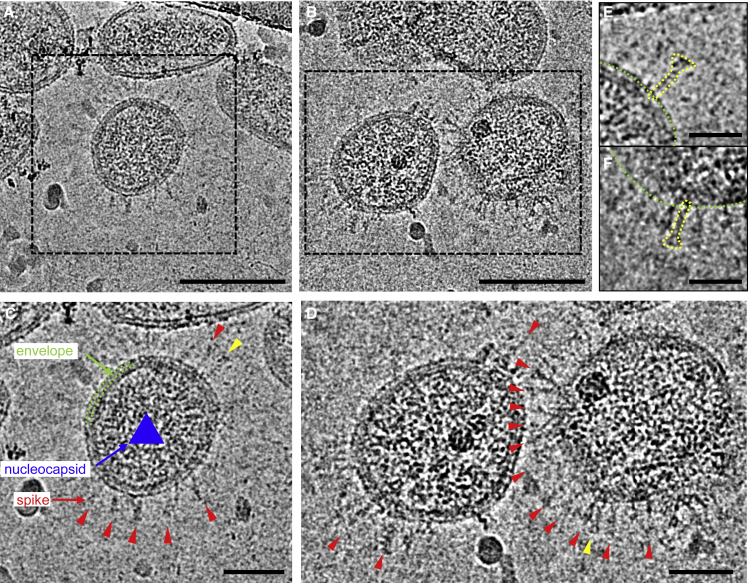
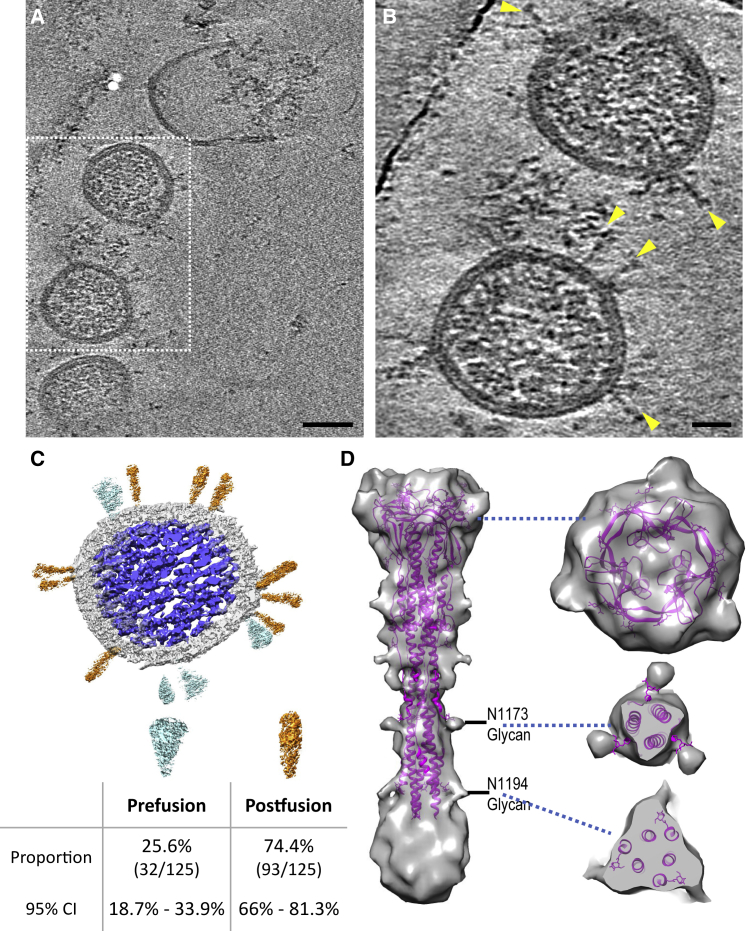
The ongoing global pandemic of coronavirus disease 2019 (COVID-19) resulted from the outbreak of SARS-CoV-2 in December 2019. Currently, multiple efforts are being made to rapidly develop vaccines and treatments to fight COVID-19. Current vaccine candidates use inactivated SARS-CoV-2 viruses; therefore, it is important to understand the architecture of inactivated SARS-CoV-2. We have genetically and structurally characterized β-propiolactone-inactivated viruses from a propagated and purified clinical strain of SARS-CoV-2. We observed that the virus particles are roughly spherical or moderately pleiomorphic. Although a small fraction of prefusion spikes are found, most spikes appear nail shaped, thus resembling a postfusion state, where the S1 protein of the spike has disassociated from S2. Cryoelectron tomography and subtomogram averaging of these spikes yielded a density map that closely matches the overall structure of the SARS-CoV postfusion spike and its corresponding glycosylation site. Our findings have major implications for SARS-CoV-2 vaccine design, especially those using inactivated viruses.

Keywords: COVID-19; SARS-CoV-2; cryo-EM; cryo-ET; glycosylation; postfusion; spike; subtomogram averaging; vaccine; β-propiolactone-inactivated viruses.


Conflict of interest statement

Declaration of Interests The authors declare no competing financial or non-financial interests.

Figures

None
Graphical abstract
Figure 1
Figure 1
Isolation and Identification of the SARS-CoV-2 Virus (A) Representative computed tomography scans of the patient at 7, 16, 26, and 39 days after illness onset (d.a.o). (B) Vero cells were inoculated with a bronchoalveolar lavage fluid sample. The cytopathic effects were observed at 4 days postinfection. (C) Detection of virus by indirect immunofluorescence assay using the patient's plasma (top) and control plasma from a healthy individual (bottom). (D) Viral RNAs were extracted from the cell culture supernatant and detected using a commercial kit probing the ORF 1ab (red) and N (blue) genes of SARS-CoV-2. (E and F) Testing the convalescent plasma IgG antibody (E) and SARS-CoV-2 RBD-specific human monoclonal antibodies (F) using purified SARS-CoV-2 virus particles. The control plasmas 1 and 2 were obtained from a patient recovered from influenza A virus infection and a healthy volunteer, respectively. All data points represent duplicate measurements. The control monoclonal antibody is a human monoclonal antibody specific to influenza A virus generated by the Institute for Hepatology in the Third People's Hospital of Shenzhen. Scale bar, 50 μm.
Figure 2
Figure 2
Cryo-EM Analysis of SARS-CoV-2 (A and B) Representative cryo-EM images of purified inactivated SARS-CoV-2 virus particles. (C and D). Zoom-in views of the boxed virions in (A and B). Envelope and nucleocapsids are indicated by green dashed lines and a blue triangle, respectively. Viral spikes are indicated by red arrowheads. (E and F). Enlarged views of the spikes indicated by yellow arrowheads in (C and D), respectively. The shape of the spike is depicted by yellow dotted lines. Green dotted lines indicate the viral envelope. Scale bars, 100 nm in (A and B), 50 nm in (C and D), 25 nm in (E and F).
Figure 3
Figure 3
Cryo-ET and Subtomogram Averaging of SARS-CoV-2 Postfusion Spike (A) Tomographic slice of inactivated SARS-CoV-2 viruses. (B) Enlarged view of the boxed region in (A). Viral spikes are indicated by yellow arrowheads. (C) Segmentation of a representative virus particle, showing the prefusion spikes in cyan, postfusion spikes in orange, membrane in light gray, and ribonucleoprotein and RNA genome complex in blue. The distribution of prefusion and postfusion spikes and the 95% confidence interval are listed below. (D) Density map of the postfusion SARS-CoV-2 spike fitted with a SARS-CoV model (PDB: 6M3W) (Fan et al., 2020). The unmodeled density at the bottom could account for 224 residues not resolved in PDB: 6M3W. Two glycan sites are labeled. Right side shows sectional views at the positions marked by the blue dashed lines. Scale bars, 50 nm in (A), 20 nm in (B).

Similar articles

Cited by

References

    1. Castaño-Díez D., Kudryashev M., Arheit M., Stahlberg H. Dynamo: a flexible, user-friendly development tool for subtomogram averaging of cryo-EM data in high-performance computing environments. J Struct Biol. 2012;178:139–151. - PubMed
    1. Chen H., Xie Z., Long R., Fan S., Li H., He Z., Xu K., Liao Y., Wang L., Zhang Y. A valid protective immune response elicited in rhesus macaques by an inactivated vaccine is capable of defending against SARS-CoV-2 infection. bioRxiv. 2020
    1. Fan X., Cao D., Kong L., Zhang X. Cryo-EM analysis of the post-fusion structure of the SARS-CoV spike glycoprotein. Nat. Commun. 2020;11:3618. - PMC - PubMed
    1. Gao Q., Bao L., Mao H., Wang L., Xu K., Yang M., Li Y., Zhu L., Wang N., Lv Z. Development of an inactivated vaccine candidate for SARS-CoV-2. Science. 2020;369:77–81. - PMC - PubMed
    1. Hagen W.J.H., Wan W., Briggs J.A.G. Implementation of a cryo-electron tomography tilt-scheme optimized for high resolution subtomogram averaging. J. Struct. Biol. 2017;197:191–198. - PMC - PubMed

Publication types

MeSH terms