Review
. 2020 Oct 14;108(1):66-92.
doi: 10.1016/j.neuron.2020.09.043.

Integrated Neurophotonics: Toward Dense Volumetric Interrogation of Brain Circuit Activity-at Depth and in Real Time

Affiliations
Review

Integrated Neurophotonics: Toward Dense Volumetric Interrogation of Brain Circuit Activity-at Depth and in Real Time

Laurent C Moreaux et al. Neuron. .

Abstract

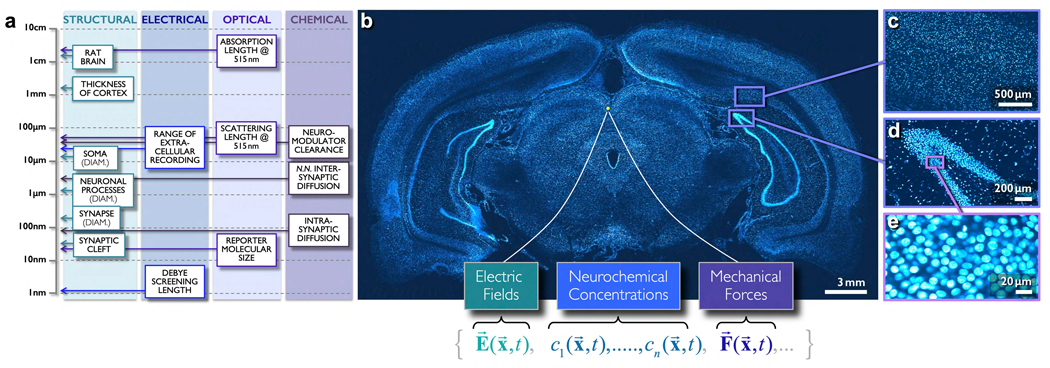
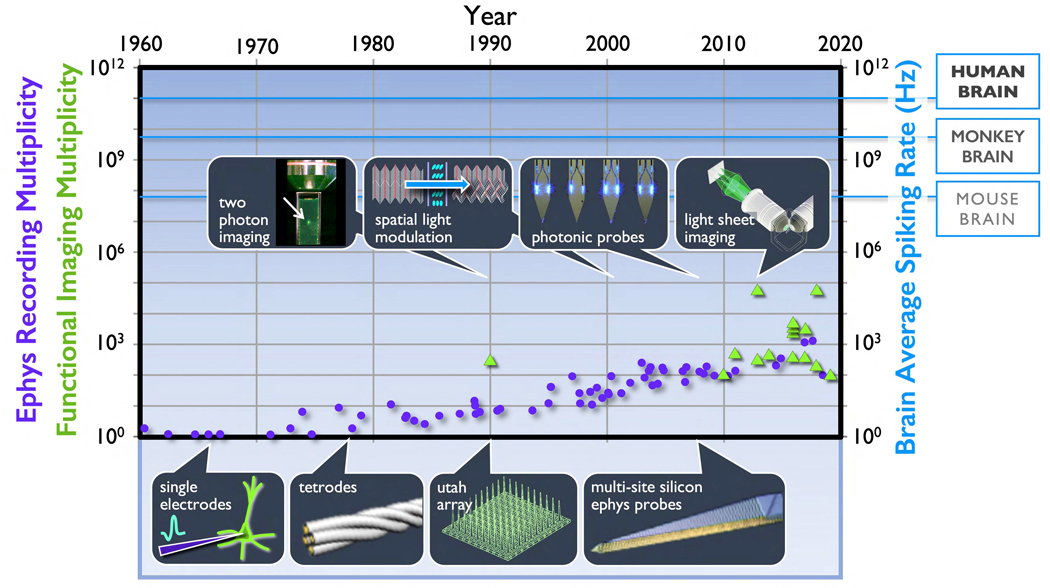
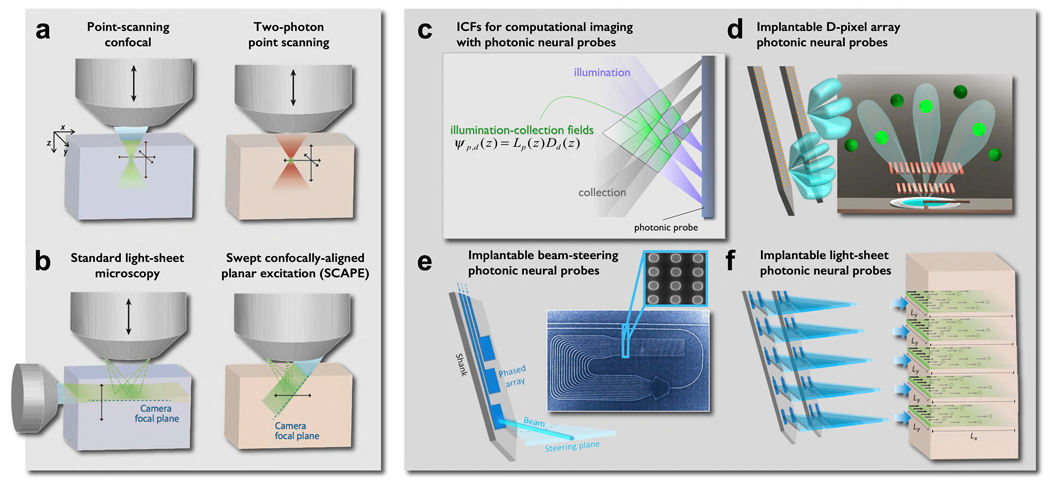
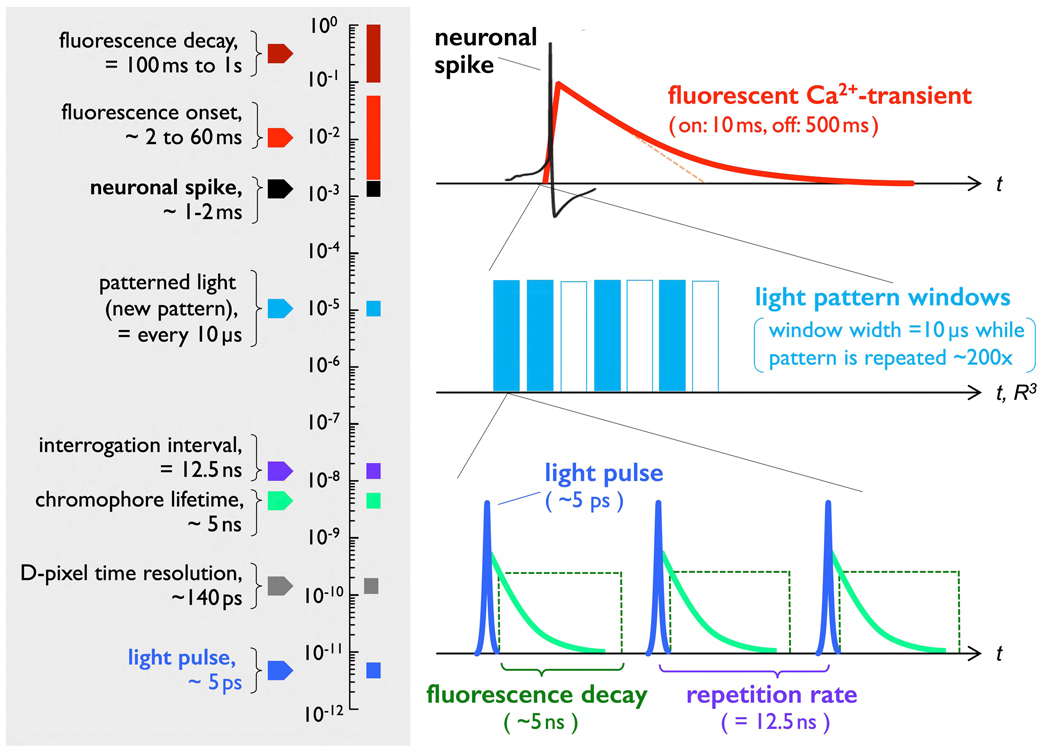
We propose a new paradigm for dense functional imaging of brain activity to surmount the limitations of present methodologies. We term this approach "integrated neurophotonics"; it combines recent advances in microchip-based integrated photonic and electronic circuitry with those from optogenetics. This approach has the potential to enable lens-less functional imaging from within the brain itself to achieve dense, large-scale stimulation and recording of brain activity with cellular resolution at arbitrary depths. We perform a computational study of several prototype 3D architectures for implantable probe-array modules that are designed to provide fast and dense single-cell resolution (e.g., within a 1-mm3 volume of mouse cortex comprising ∼100,000 neurons). We describe progress toward realizing integrated neurophotonic imaging modules, which can be produced en masse with current semiconductor foundry protocols for chip manufacturing. Implantation of multiple modules can cover extended brain regions.


Conflict of interest statement

Declaration of Interests Three patents owned by the California Institute of Technology have been pursued in connection with this work: (1) Roukes (2011). Brain-machine interface based on photonic neural probe arrays. U.S.P.T.O. Patent No. 10,638,933, Issued May 5, 2020, Priority Date: December 8, 2011. (2) Segev, E., Moreaux, L.C., Fowler, T.M. Faraon, A., Roukes, M.L. Implantable, highly collimated light-emitters for biological applications. U.S.P.T.O. Patent No. 10,471,273, Issue date: 12 November 2019; Priority date: 16 October 2015. (3) Roukes et al. (2016). One-photon integrated neurophotonic systems. U.S.P.T.O. Patent Application 20160150963, Filing date: November 5, 2014; Publication date: June 2, 2016.

Figures

Figure 1.
Figure 1.. Brain complexity, “brain fields”, and structural length scales vis-à-vis cell-body location, density and heterogeneity in the rodent brain.
Strong light scattering and absorption in brain tissue make it extremely difficult to achieve dense, volumetric functional imaging with cellular resolution. a) Biophysical scales for electrical, neurochemical and optical domain recordings, and relative sizes of brain structures. b) A ~2μm thick section of an adult rat brain slice, stained with a fluorescent nuclear stain, wet-mounted, and imaged by large-scale serial two-photon microscopy (L. Moreaux, 2010). Beneath this image we enumerate three “brain fields”, that is, neural activity domains: the electrical, neurochemical, and mechanical. c,d,e) Cellular nuclear density at multiple scales, from the macroscopic down to the level of individual cells.
Figure 2.
Figure 2.. Evolution of recording multiplicity for electrophysiology and functional imaging vis-à-vis overall brain activity (spiking rates).
Left ordinate: (violet dots) The evolution of multiplicity for individual electrodes, implantable multi-site probes, and multi-probe modules since the invention of whole cell recording (Stevenson and Kording 2011; Steinmetz, et al. 2018). (green triangles) Also shown are recording multiplicities for multi-photon functional imaging (from Lecoq et al., 2019) and light sheet microscopy (Ahrens et al., 2013, Chen et al., 2018). For a current review of recording capabilities with multi-photon techniques, see (Lecoq et al., 2019). Right ordinate: To compare the evolution of the technology against large-scale volumetric activity, we show the average spiking rate over entire brains is estimated as the product of the number of neurons and the brain average firing rate per neuron (~2Hz).
Figure 3.
Figure 3.. Functional imaging methodologies: free-space versus implantable, lens-less photonic neural probes.
Left panel, Free-space Microscopy: a) Epifluorescence and confocal; multi-photon. b) Light- sheet microscopy in transparent tissues (denoted by bluish blocks), and oblique confocal scanning (SCAPE) in opaque tissues (brownish blocks). Panels a and b are adapted from (Hillman et al., 2019). - Right panel: Paradigm and components of photonic neural probes: (c) Concept of fluorescence interrogation voxels - illumination collection fields (ICF), overlay of illumination angular-fields produced by micro-sized emitter pixels (E-pixels) with detector angular-fields of micro-sized photodetectors. ICFs are analogous to the point-spread function, or optical-transfer function in optical imaging. (d) An angle-selective single-photon avalanche diode (AS-SPAD) detector pixel (D-pixel) arrays, where each D-pixel is equipped with off-axis Talbot gratings to yield an angle-restricted detection field. The diversity in spatial frequency, phase and direction in the Talbot gratings of each pixel allows maximally randomized spatial sampling of the tissue volume, allowing computational reconstruction. (e) Implantable beam- steering photonic probe. Using coherent light in the blue spectrum and an optical phased array, an implantable photonic probe enables micro-sized collimated beams to be scanned within the brain tissue by optical spectral addressing. Combining spectral (beam scan-angle, k) and spatial addressing (pixel number, i.e. phase-array element) enables scanning at different addressable depths. (f) Implantable light-sheet photonic probes imaging within opaque tissue. Photonic probes deliver blue light sheets enabling 2D-interrogation of fluorescently labeled neurons within selective and individually addressable planes. As photonic probes can be implanted at arbitrary depths, they provide access to regions that are impossible to image with free-space methodologies.
Figure 4.
Figure 4.. estricted sub-cellular localization of genetically engineered optical reporters of neural activity.
(a) Optical calcium reporters (GCaMP family). Representative time-averaged projection images of GCaMP6f (top panel) and its respective fusion protein variant (bottom) expressed in mouse dorsal striatum. Images were acquired with a 1P epi-fluorescent microscope. The fusion protein variant was identified in a screen designed to identify GCaMP fusion proteins with enhanced localization within 50 μm of the cell body with no effect on toxicity and GCaMP kinetics. Fusion of GCaMP6f to a de novo designed coiled-coil peptide to realize SomaGCaMP6f2 provides better SNR and fewer artifact spikes from neuropil than its non-fusion counterparts (bottom panel). Coiled-coil motifs, comprised of amino acid repeats that can assemble into complexes by “coiling” around one another via cognate sequence-structure pairing, were hypothesized by the authors to potentially slow diffusion of the GCaMP fusion proteins out of the cell body (Shemesh et al., 2020). (b) Representative confocal images of neurons in cortex layer 2/3 (left), hippocampus (middle), and striatum (right) expressing Archon1 (top) and SomArchon (bottom). Scale bar, 50 microns (Piatkevich et al., 2019). (c) Optical voltage indicator (ASAP reporters). Expression of ASAP2s (left panel) and ASAP2s fused to a cytosolic segment of the potassium voltage-gated channel Kv2.1 (right panel) in Cux2+ neurons in mouse cortex. ASAP voltage reporters are based on a circularly permuted GFP variant inserted within the voltage sensitive domain of a voltage-sensing phosphatase (Villette et al., 2019). (d) Optogenetic dopamine reporters (dLight1 sensors). (left panel) Simulated protein structure of the Dopamine D1 receptor (DRD1)-based dLight1 sensor, color-coded to denote key modules and components: inert DRD1 (purple), circularly permutated GFP (green), transmembrane regions (red, yellow) and linkers (white, black). (right panel) dLight1 plasma membrane localization in HEK cells (Patriarchi et al., 2018).
Figure 5.
Figure 5.. The integrated neurophotonics paradigm via photonic neural probe arrays.
Left) Schematic representation of a 625-shank photonic probe array module. a) Architecture 1, described in the text and Fig. 9a, is designed to record from 1mm3 of mouse cortex. b) We decompose the brain region bounded by four adjacent shanks into unit volumes delineated by the repeat distance of E- and D- pixels along the shank. c) For Architecture 1, each unit volume is surrounded by a small ensemble of E- and D- pixels that illuminate soma and collect fluorescent photons in their proximity. Right) Time-domain interrogation of reporters. d) After an action potential, the optical susceptibility of calcium reporters within a labeled neuronal cell changes. This is read out by a blue-wavelength excitation-pulse that produces a green-wavelength fluorescence transient. e) Photonic probes operate in the mesoscopic regime where proximal emitters and detectors are separated by only a few scattering lengths. This circumvents issues with functional imaging in highly scattering brain tissue. f) The emission peak for a typical GCaMP-family calcium reporter is separated by only ~20nm from its absorption peak, making continuous measurements essentially impossible; the excitation light is overwhelmingly more intense than the neuron’s fluorescence. For this reason, we operate in the time domain. g) Implementation of time-gating to reject excitation light to enable detection of the much weaker neuronal fluorescence.
Figure 6.
Figure 6.. Mesoscopic light scattering and photon transport within the brain.
a) Absorption, scattering, and attenuation in brain tissue versus wavelength. (After N.G. Horton, et al., Nature Photonics 7, 205 (2013). b) Forward Mie scattering in brain tissue is overwhelmingly forward directed. Polar diagram of the scattering of blue light (λ=480nm, unpolarized) from a sphere with radius r ~15μm, index difference Δn0.11 </di>from the environment. This closely approximates scattering from a soma in extracellular media. Each concentric circle represents a ten-fold increase in intensity. The forward peak at 0° (cyan trace) is generally more than 5 orders higher in intensity than scattered light. Adapted from (Laven, 2020). c) Schematic depicting illumination impinging upon a neuron after propagating a distance, z, in scattering tissue. For simplicity, the E-pixel is idealized as a point emitter (d=0) d) Heatmap showing beam intensity versus distance from microscopic emitter. For this analysis the emitted beam is assumed to start with zero width. e) Lateral beam profile for five distances from the emitter shown as dashed lines in panel c. The microscale beam remains highly collimated even 200μm from the emitter. f) Comparison between ballistic photons (blue trace) collected by the “neuron” (15μm-diamater disc, representing a somatic cross-section) as depicted panel c, with those arriving after scattering (orange trace). The horizontal dashed line exemplifies that, because of strong forward scattering in the mesoscopic regime, a given total photon flux (green trace) for, e.g., a million photons, can be collected a significant distance,Δl, further from the source than is the case considering only the ballistic contribution.
Figure 7.
Figure 7.. Temporal scales and the time-domain acquisition protocol.
The system’s fastest time scale is the duration of individual E-pixel emission pulses (~5ps) and the temporal resolution of the SPAD D-pixels (~140ps). As mentioned, together they enable resolving the fast temporal decay of reporter chromophore fluorescence following an excitation pulse (~5ns). Data acquisition sequences - a geometric pattern of pulsed, multiple-E-pixel light emission (5ps), followed by a D-pixel acquisition window (~10ns gate) - are repeated every 12.5ns (80 MHz repetition rate). Given the 5ns typical fluorescence lifetime of the reporter chromophore (green trace), this interval allows for a sufficient recovery period before the next interrogation. A specific light pattern is repeated as a train of ~800 data acquisition sequences are acquired and averaged; the stationary light pattern used during one ~10μs data acquisition window is then changed for the subsequent 10μs window. Thus, on the (relatively) slow time scale of a single action potential (~1–2ms), several hundred light patterns can be imposed, each of which is repeatedly signal-averaged roughly one thousand times to suppress photon statistics to enable acquisition of high SNR data and minimize energy deposited within the tissue.
Figure 8.
Figure 8.. Computational approach to de-mix detector photon counts to obtain multiplexed time records of individual neuron activity.
a) Schematic depicting a top view of one 24-shank photonic probe array module, “design 1”, implanted in a 0.416mm3 volume of mouse cortex that is labeled with increasing density. b) Schematic of a probe-array architecture (designs 2, 3, and 4) providing dense coverage. c) Family of results at various labeling densities for three photonic probe architectures. d) Summary of the evolution of separability with increasing labeling density for the three module architectures. Here, we assume SNR>1 as the criterion for separability.
Figure 9.
Figure 9.. Photonic neural probes.
First-generation hardware developed for implantable probes includes microscale components for cellular-scale patterning and delivery of visible coherent light, and components for lens-less functional imaging with cell-type specificity. Passive emitter-pixel arrays (E-pixels) operating in the visible spectrum: (a) Scanning E-pixels, blue light: Microscale beam-scanning phased array photonic neural probe operating with blue light (480nm). SEM of phased array E-pixel design with ~6 nm free spectral range (FSR). Top-down images of phased array emission pattern at multiple addressing wavelengths. Continuous scanning is possible by sweeping the input wavelength within the FSR (spectral addressing) (Sacher et al., 2019b). b) Light-sheet array photonic neural probes. Probe-based light patterning using the composite emission of four microscale E-pixel arrays based on grating couplers, which are fed with tightly controlled optical modes to produce addressable light sheets with ~10–20 μm thickness. The photonic probe chip is coupled with fiber bundle/array through facets of single mode waveguides of single mode fibers. Spatial addressing using a MEMS mirror allows temporal addressing of multiple planes and provides the requisite intensity per sheet to induce fluorescence by the one-photon excitation process. (Sacher et al., 2019a). Detector-pixel array (D-pixels) based upon visible spectrum angle-selective single-photon avalanche diode (SPAD) detectors: First-generation, minimally invasive photonic neural probes for lens-less functional imaging (Choi et al., 2019; Choi et al., 2020, Lee et al., 2019). (c) Images of a SPAD-based D-pixel array in clockwise order: scanning electron micrograph (SEM) of a rectangular CMOS die post-processed into shanks, waterproof flat flexible cable (FFC) assembly used for in vivo insertion, and shank with an epoxy-based 10um- thick absorption filter coating. (d) Micrograph of CMOS imager probe consisting of 512 SPADs along two 4mm-long shanks. Each pixel is masked with semi-unique off-axis Talbot gratings that vary in angular direction, angular frequency, and phase (four examples shown at top), resulting in one of sixteen distinct detection fields (bottom). The 16-pixel ensemble consists of two detection field directions (x-z, x-y), two angular frequencies, and four phases to minimize overlap between neighboring pixels. Pixel pitch: 25um x 75um, PDP (median): 16.8%, DCR (median): 40 Hz, Time-gate resolution: 140ps, Max frame rate: 50 kilo-frames/s

References

    1. Acher FC, and Bertrand HO (2005). Amino acid recognition by Venus flytrap domains is encoded in an 8-residue motif. Biopolymers 80, 357–366. - PubMed
    1. Adams JK, Boominathan V, Avants BW, Vercosa DG, Ye F, Baraniuk RG, Robinson JT, and Veeraraghavan A. (2017). Single-frame 3D fluorescence microscopy with ultraminiature lensless FlatScope. Science Advances 3, e1701548. - PMC - PubMed
    1. Adrian ED (1926). The impulses produced by sensory nerve endings: Part I. J Physiol 61, 49–72. - PMC - PubMed
    1. Ahrens MB, Orger MB, Robson DN, Li JM, and Keller PJ (2013). Whole-brain functional imaging at cellular resolution using light-sheet microscopy. Nature Methods 10, 413–420. - PubMed
    1. Alivisatos AP, Chun M, Church GM, Greenspan RJ, Roukes ML, and Yuste R. (2012). The brain activity map project and the challenge of functional connectomics. Neuron 74, 970–974. - PMC - PubMed

Publication types