. 2020 Dec 7;55(5):558-573.e6.
doi: 10.1016/j.devcel.2020.09.021. Epub 2020 Oct 14.

DNA Damage Promotes Epithelial Hyperplasia and Fate Mis-specification via Fibroblast Inflammasome Activation

Affiliations

DNA Damage Promotes Epithelial Hyperplasia and Fate Mis-specification via Fibroblast Inflammasome Activation

Lindsey Seldin et al. Dev Cell. .

Abstract

DNA crosslinking agents are commonly used in cancer chemotherapy; however, responses of normal tissues to these agents have not been widely investigated. We reveal in mouse interfollicular epidermal, mammary and hair follicle epithelia that genotoxicity does not promote apoptosis but paradoxically induces hyperplasia and fate specification defects in quiescent stem cells. DNA damage to skin causes epithelial and dermal hyperplasia, tissue expansion, and proliferation-independent formation of abnormal K14/K10 dual-positive suprabasal cells. Unexpectedly, this behavior is epithelial cell non-autonomous and independent of an intact immune system. Instead, dermal fibroblasts are both necessary and sufficient to induce the epithelial response, which is mediated by activation of a fibroblast-specific NLRP3 inflammasome and subsequent IL-1β production. Thus, genotoxic agents that are used chemotherapeutically to promote cancer cell death can have the opposite effect on wild-type epithelia by inducing, via a non-autonomous IL-1β-driven mechanism, both hyperplasia and stem cell lineage defects.

Keywords: DNA damage; IL-1β; chemotherapy; epidermis; hair follicle; hyperplasia; inflammasome; lineage; mammary gland; stem cell.


Conflict of interest statement

Declaration of Interests The authors declare no competing interests.

Figures
Figure 1.
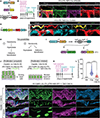
Figure 1.. Genotoxic Agents Promote Hyper-proliferation and Stem Cell Specification Defects in Intact Mouse Interfollicular Epidermis.
(A) Schematic of interfollicular epidermis. BM - basement membrane, K - keratin. (B) Schematic of backskin treatment. (C) Treatment timeline. (D and E) Images of untreated (D) and scraped/vehicle-treated (E) backskin. (F) Epidermal thickness in untreated backskin, and 1 wk following treatment with vehicle, Cisplatin (topically applied) or Mitomycin C (intradermally injected) (n = 3 mice per violin). U - untreated, VC - Cisplatin vehicle, C - Cisplatin, VM - Mitomycin C vehicle, M - Mitomycin C, ns - not significant (p = 1). ****p ≤ 0.0001. (G and H) γH2AX staining 1 d post-treatment. Veh - vehicle, Cisp - Cisplatin. (I and J) H&E staining of mouse backskin 1 wk post-vehicle (I) or Cisplatin (J) treatment. (K) Image of Cisplatin-treated tissue. Yellow bracket = representative region measured for epidermal thickness, as quantified in (F). (L) Epidermis following intradermal injections of Mitomycin C (MMC). (M and N) p63 staining in vehicle- (M) and Cisplatin- (N) treated epidermis. (O and P) Keratin 6 (K6) staining of epidermis. (Q and R) Cleaved caspase-3 (CC-3) staining 2 d post-vehicle (Q) or Cisplatin (R) treatment. (S and T) Mouse backskin in telogen (resting) hair cycle phase that was treated with vehicle (S) or Cisplatin (T) (n = 3 mice). (U and V) Mouse footpad epidermis treated with vehicle (U) or Cisplatin (V) (n = 3 mice). (W and X) Schematic of homeostatic epidermis (W) versus epidermis exposed to genotoxic treatment (X). Dotted boxes demarcate zoomed-in regions. Dotted lines in all figures demarcate basement membrane. Scale bars are 10 μm (*) or 50 μm. For violin plots in all figures, solid line = median, dotted lines = 1st and 3rd quartiles, bottom and top = min and max. See also Figure S1.
Figure 2.
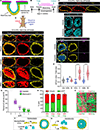
Figure 2.. Expanded Epidermal Layers are Generated from Hyper-proliferating Basal Stem Cells in Response to Genotoxicity.
(A) Diagram of mouse lines for single-color basal cell lineage-tracing. (B) Experimental pulse-chase timeline of doxycycline (dox)-driven induction of basal cell labeling. (C and D) Epidermis from pulse-chase lineage-tracing according to timeline in (B) (n = 3 mice). Dotted boxes demarcate zoomed-in regions. (E) Diagram of Confetti transgenic mouse line for multi-color basal cell lineage-tracing. (F and G) Confetti basal cell lineage-tracing according to timeline in (B) (n = 4 mice). (H) Two alternative models for responses to genotoxicity. (I) Mouse lines crossed to induce overexpression of cell cycle inhibitor Cdkn1b in epidermal basal cells. Control mice lack TetO-Cdkn1b transgene. (J) Illustration of “proliferation-competent” (no TetO-Cdkn1b) and “proliferation-inhibited” (+TetO-Cdkn1b) H2B-GFP+ epidermal cell behavior in response to Cisplatin treatment. OE - overexpression. (K) Experimental timeline of Cdkn1b induction (Tam - tamoxifen, 4OHT - 4-hydroxytamoxifen). (L) Epidermal thickness quantification of vehicle-treated backskin and Cisplatin-treated backskin +/− Cdkn1b overexpression (n = 3 mice per violin). ****p ≤ 0.0001. (M) Representative image of Cisplatin-treated “proliferation competent” backskin. GFP marks Tamoxifen-responsive cells. (N) Representative image of Cisplatin-treated “proliferation-inhibited” backskin. Dotted box demarcates zoomed-in region shown in N’. Scale bars are 10 μm (*) or 50 μm. See also Figure S2.
Figure 3.
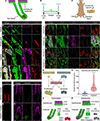
Figure 3.. Genotoxicity Promotes Myoepithelial Stem Cell Plasticity and Luminal Filling in Mouse Mammary Glands.
(A) Schematic of mammary gland budding off embryonic interfollicular epidermis. (B) Timeline of mammary myoepithelial cell lineage-tracing. (C) Lineage-tracing of normal K14-rtTA; TetO-Cre; tdTomato (tdTom) mouse mammary glands, induced with doxycycline according to timeline in (B) (3/3 mice, 100%). (D) Schematic of mammary fat pad injections. (E and F) Lineage-tracing of both control (E) and physically-wounded (F) mammary glands throughout morphogenesis (3/3 mice per condition, 100%). (G and H) Images of vehicle- (G) and Cisplatin- (H) treated mammary glands (3/3 mice per condition, 100%). (I) Image of Mitomycin C- (MMC) treated mammary glands (4/4 mice, 100%). (J and K) E-cadherin (Ecad) staining. Cisp - Cisplatin. (L and M) Keratin 8 (K8) staining. MMC - Mitomycin C. (N and O) CC-3 staining. (P) Quantification of mammary luminal filling. Unt - untreated, V - vehicle, W - wound, C - Cisplatin, M - Mitomycin C, ns - not significant (p = 1). n = 3–4 mice per violin. (Q) Effect of DNA crosslinking agents on cell death compared with vehicle in EpH4 cells (n = 3 experimental replicates, V - vehicle). (R) Images from cell mixing experiments using mApple and eGFP EpH4 cells treated with vehicle (Veh) or Cisplatin (Cisp) (n = 3 experimental replicates). Bars compared to Veh/Veh. (S) Images of representative mApple and eGFP Eph4 cell ratios among treatments. (T and U) Schematic of homeostatic mammary glands (T) versus mammary glands exposed to genotoxic treatment (U). ***p ≤ 0.001, ****p ≤ 0.0001. Scale bars are 10 μm. See also Figure S3.
Figure 4.
Figure 4.. Genotoxic Agents Promote Hyper-proliferation and Defective Specification in Mouse Hair Follicle Epithelium.
(A) Schematic of hair follicle protruding from interfollicular epidermis. (B) Experimental timeline of intradermal injections. (C) Schematic of vehicle and drug intradermal injections. (D and E) Images of skin 1 wk post-intradermal injections. Yellow and blue arrowheads = interfollicular and dermal BrdU+ cells, respectively. D’ and E’ are zoom-ins. (F and G) Images of hair follicle base 1 wk post-intradermal injections (II). (H and I) Images of hair follicle base 1 wk post-topical (T) treatment. (J and K) BrdU labeling in hair follicle base 1 d post-intradermal injection. (L and M) CC-3 and hair shaft differentiation marker AE13 expression in hair follicle base 1 d post-intradermal injections. (N) Schematic comparing response of quiescent versus proliferative cell populations to genotoxicity. (O) Interfollicular epidermal thickness 1 wk post-intradermal injections (n = 3 mice per violin). ****p ≤ 0.0001. (P and Q) Schematic of interfollicular epidermis and hair follicles during homeostasis (P) and following intradermal genotoxic treatment (Q). Dotted boxes demarcate zoomed-in regions. Scale bars are 10 μm (*) or 50 μm.
Figure 5.
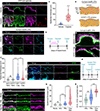
Figure 5.. Dermal Fibroblasts are Necessary and Sufficient for the Epithelial Response to DNA Damage.
(A and B) Images of NOD scid gamma (NSG) epidermis 1 wk post-treatment. (C) NSG epidermal thickness 1 wk post-treatment (n = 3 mice per violin). (D) Schematic of skin compartments: IFE - interfollicular epidermis, FB - fibroblast, DC - dermal cell (non-fibroblast), HF - hair follicle. 4-hydroxytamoxifen (4OHT) application onto Col1a2-CreER; DTA backskin promotes dermal fibroblast ablation. (E and F) S100A4 expression in vehicle- (E) and 4OHT- (F) treated Col1a2-CreER; DTA dermis. Images were acquired using the same exposure times. (G) Timeline of 4OHT-driven dermal fibroblast ablation. (H and I) Images of Cisplatin-treated skin 1 wk +/− fibroblasts. Cisp - Cisplatin. (J) Epidermal thickness in Col1a2-CreER; DTA mice following timeline in (G) (n = 3 mice per violin). Veh1 – 4OHT vehicle, Veh2 - Cisplatin vehicle, ns - not significant (p = 1). (K and L) CFSE-labeled dermal fibroblasts (FBs) (K) and keratinocytes (mKs) (L) 1 d post-transplantation. (M) Fibroblast transplantation timeline. (N-P) Recipient epidermis following media injections (N), or transplantation of untreated (O) and Cisplatin-treated (P) dermal fibroblasts from syngeneic donor backskin. (Q) Epidermal thickness in recipient mice following transplantation, according to timeline in (M) (n = 3 mice per violin). mKs - mouse keratinocytes, FBs - fibroblasts, Cisp - Cisplatin, ns - not significant (p = 0.8). (R) Quantification of overlapping K14+/K10+ expression in recipient epidermis following transplantation (n = 3 mice per violin). ns - not significant (p = 0.1). **p ≤ 0.01, ****p ≤ 0.0001. Scale bars are 50 μm.
Figure 6.
Figure 6.. Genotoxicity Induces NLRP3 Inflammasome Activation in Dermal Fibroblasts.
(A) Schematic of RNA sequencing (seq) sample preparation. (B) Ingenuity Pathway Analysis (IPA) of RNA seq data from Cisplatin- vs. vehicle-treated fibroblasts, showing upregulated and unaffected signaling pathways. Threshold line based on p < 0.05. (C) IPA canonical pathways with z-scores > 2 based on ratio determined by # significantly upregulated genes within pathway divided by # total molecules in pathway. (D-I) Heat maps of inflammasome-associated gene transcript levels from Cisplatin- vs. vehicle-treated fibroblasts. Blue gene names = non-significant changes between treatments. Heat maps present log10 of transcripts per million (TPM). Right color scale in (D) applies to all heat maps; green - low expression, red - high expression. V - vehicle, C - Cisplatin, 1/2 - replicate #s. See also Figure S4.
Figure 7.
Figure 7.. Dermal Fibroblast IL-1β Drives Epithelial Hyperplasia and Defective Stem Cell Specification
(A and B) Vimentin (A) or CD11b (B) and IL-1β staining in backskin dermis 1 wk post-Cisplatin treatment. (C) Pearson correlation coefficients (r values) between IL-1β and CD11b or Vimentin localization (n = 3 mice per violin). (D and E) Vimentin (D) or CD11b (E) and ASC staining in backskin dermis 1 wk post-Cisplatin treatment. (F) Pearson correlation coefficients (r values) between ASC and CD11b or Vimentin localization (n = 3 mice per violin). (G and H) Mouse backskin 4 d post-intradermal injections of vehicle (G) or recombinant IL-1β (H). (I) Epidermal thickness following vehicle and IL-1β intradermal injections (n = 3 mice per violin). (J and K) Mouse backskin 4 d post-intradermal co-injections of control IgG and Cisplatin (J) or anti-IL-1β IgG and Cisplatin (K). (L) Epidermal thickness after intradermal co-injections of control IgG or anti-IL-1β IgG and vehicle or Cisplatin (n = 3 mice per violin). ns - not significant (p = 0.8). (M and N) Model (M) for effect of genotoxic agents on epithelial behavior, and accompanying legend (N). Dotted boxes demarcate zoomed-in regions. ****p ≤ 0.0001. Scale bars are 10 μm (*) or 50 μm. See also Figure S5.

Comment in

Similar articles

Cited by

References

    1. BARRIENTOS S, STOJADINOVIC O, GOLINKO MS, BREM H & TOMIC-CANIC M 2008. Growth factors and cytokines in wound healing. Wound Repair Regen, 16, 585–601. - PubMed
    1. BIFFI G, ONI TE, SPIELMAN B, HAO Y, ELYADA E, PARK Y, PREALL J & TUVESON DA 2019. IL1-Induced JAK/STAT Signaling Is Antagonized by TGFbeta to Shape CAF Heterogeneity in Pancreatic Ductal Adenocarcinoma. Cancer Discov, 9, 282–301. - PMC - PubMed
    1. BLAAS L, PUCCI F, MESSAL HA, ANDERSSON AB, JOSUE RUIZ E, GERLING M, DOUAGI I, SPENCER-DENE B, MUSCH A, MITTER R, BHAW L, STONE R, BORNHORST D, SESAY AK, JONKERS J, STAMP G, MALANCHI I, TOFTGARD R & BEHRENS A 2016. Lgr6 labels a rare population of mammary gland progenitor cells that are able to originate luminal mammary tumours. Nat Cell Biol, 18, 1346–1356. - PMC - PubMed
    1. BLANPAIN C & FUCHS E 2014. Stem cell plasticity. Plasticity of epithelial stem cells in tissue regeneration. Science, 344, 1242281. - PMC - PubMed
    1. CHEN X, WU Y, DONG H, ZHANG CY & ZHANG Y 2013. Platinum-Based Agents for Individualized Cancer Treatment. Current Molecular Medicine, 13, 1603–1612. - PubMed

Publication types

MeSH terms