. 2021 Jan 12;54(1):53-67.e7.
doi: 10.1016/j.immuni.2020.09.011. Epub 2020 Oct 14.

Tetracycline Antibiotics Induce Host-Dependent Disease Tolerance to Infection

Affiliations

Tetracycline Antibiotics Induce Host-Dependent Disease Tolerance to Infection

Henrique G Colaço et al. Immunity. .

Abstract

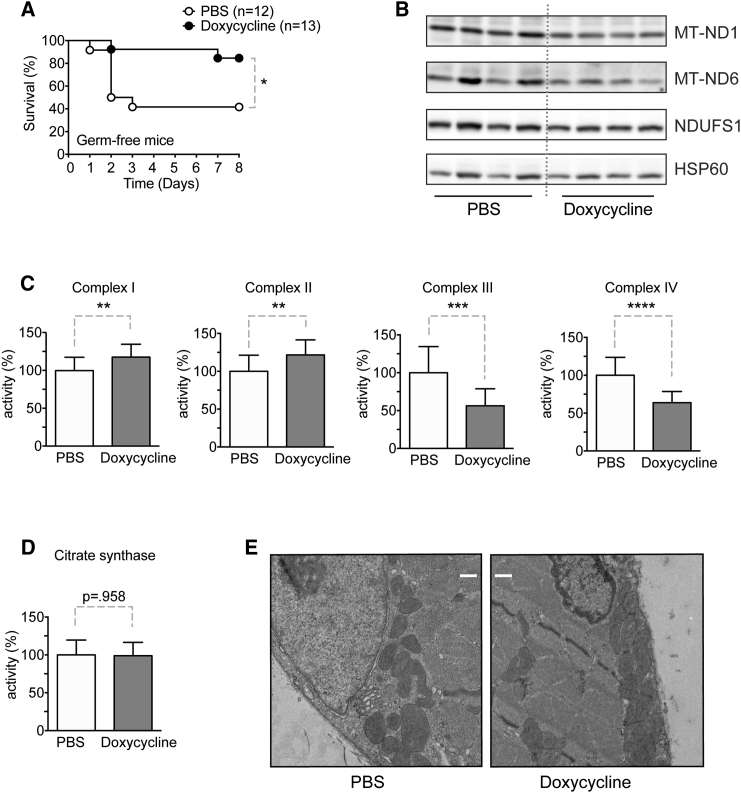
Several classes of antibiotics have long been known to have beneficial effects that cannot be explained strictly on the basis of their capacity to control the infectious agent. Here, we report that tetracycline antibiotics, which target the mitoribosome, protected against sepsis without affecting the pathogen load. Mechanistically, we found that mitochondrial inhibition of protein synthesis perturbed the electron transport chain (ETC) decreasing tissue damage in the lung and increasing fatty acid oxidation and glucocorticoid sensitivity in the liver. Using a liver-specific partial and acute deletion of Crif1, a critical mitoribosomal component for protein synthesis, we found that mice were protected against sepsis, an observation that was phenocopied by the transient inhibition of complex I of the ETC by phenformin. Together, we demonstrate that mitoribosome-targeting antibiotics are beneficial beyond their antibacterial activity and that mitochondrial protein synthesis inhibition leading to ETC perturbation is a mechanism for the induction of disease tolerance.

Keywords: disease tolerance; doxycycline; electron transport chain; immunometabolism; liver; lung; mitochondria; mitoribosome; sepsis.


Conflict of interest statement

Declaration of Interests The authors declare no competing interests.

Figures

None
Graphical abstract
Figure 1
Figure 1
Doxycycline Confers Protection in a Mouse Model of Bacterial Sepsis (A–C) Survival (A), rectal temperature (B), and % initial body weight (C) after i.p. infection of mice with TetR CamR E. coli and i.p. treatment with 1.75 μg/g body weight doxycycline at 0, 24, and 48 h. (D) Bacterial load in mouse blood, liver, lung, and kidney at the indicated time points after infection. (E) Concentrations of the organ damage markers aspartate transaminase (AST), alanine transaminase (ALT), creatinine (CREA), creatine kinase (CPK), and lactate dehydrogenase (LDH). (F) Hematoxylin-eosin-stained liver, lung, and kidney 30 h after infection. (G) Organ damage score in Hematoxylin-eosin-stained tissues 30 h after infection. Score 0 = no lesions; 1 = very mild; 2 = mild; 3 = moderate; 4 = severe lesions. (H) TNFα and interleukin (IL)-6 concentrations in mouse serum. (A) represents pooled data from 12 independent experiments. (B) and (C) represent mean ± SD pooled from six independent experiments. (D), (E), (G), and (H) represent pooled data from at least two independent experiments; squares represent individual mice and bars indicate the mean. (F) Shows representative images of two independent experiments. Scale bars indicate 500 μm (liver), 200 μm (lung), and 100 μm (kidney). p < 0.05; ∗∗p < 0.01; ∗∗∗p < 0.001; ∗∗∗∗p < 0.0001. See also Figure S1.
Figure 2
Figure 2
Doxycycline Improves Lung Pathology (A) Survival of mice after i.p. E. coli infection and intratracheal delivery of doxycycline. (B) Volcano plot with differential expression of lung genes affected by i.p. E. coli infection. Numbers indicate genes with log2 fold change < −5 or > 5 and p < 0.05. (C) Scatterplot of genes affected by i.p. doxycycline treatment in infected versus non-infected groups. Differentially expressed genes are indicated in yellow (infected mice), blue (non-infected mice), or green (both conditions); gray dots indicate non-statistically significant genes (p ≥ 0.05). (D) Heatmaps of most significantly enriched clusters of genes affected by doxycycline treatment in non-infected mice (log2 fold change < −5; p < 0.05). (A) represents pooled data from two independent experiments. (B), (C), and (D) represent one experiment. p < 0.05. See also Figure S2.
Figure 3
Figure 3
Fatty Acid Oxidation and Response to Glucocorticoids Are Essential for Sepsis Outcomes (A) Volcano plot with differential expression of liver genes affected by i.p. E. coli infection. Numbers indicate genes with log2 fold change < −5 or > 5 and p < 0.05. (B) Scatterplot of genes affected by i.p. doxycycline treatment in infected versus non-infected groups. Yellow dots indicate genes differentially expressed in infected mice; gray dots indicate non-statistically significant genes (p ≥ 0.05). (C) Top upregulated metabolites in liver of infected mice (untargeted analysis). Metabolites involved in fatty acid oxidation are highlighted in yellow and glucocorticoids in gray. Each square represents one mouse. (D) Expression of Ppara and several of its targets by qPCR in liver after infection. Data represent mean ± SD of five mice assayed in triplicate. (E and F) Survival of E. coli-infected mice after treatment with either etomoxir (E) or mifepristone (F) with or without doxycycline treatment. Graphs represent data from one or two independent experiments. p < 0.05; ∗∗p < 0.01; ∗∗∗p < 0.001; ∗∗∗∗p < 0.0001. See also Figure S3.
Figure 4
Figure 4
Doxycycline Improves Both FAO and Response to Glucocorticoids (A) High-performance liquid chromatography mass spectrometry (HPLC-MS) analysis of FAO metabolites in liver 8 h after infection and doxycycline treatment. Each square represents one mouse. (B) Glucocorticoid amounts from an untargeted metabolomics analysis (as in Figure 3). Each square represents one mouse. (C) Protein amounts of total and phosphorylated glucocorticoid receptor (GR) in mouse liver at 8 h after infection or doxycycline treatment. Each lane represents one mouse. (D) Survival of mice pre-treated with AAV8-TGG-NR3C1S11/226A ((DN GR) and infected with E. coli 24 h later. Data in (A) represent one experiment. (C) is representative from two independent experiments; (D) represents data from a single experiment. p < 0.05. See also Figure S4.
Figure 5
Figure 5
Low-Dose Doxycycline Affects Mitochondrial Function In Vivo (A) Survival of germ-free mice after infection with E. coli and treatment with doxycycline. (B) Protein amounts of mitochondrial-encoded (MT-ND1, MT-ND6) and nuclear-encoded (NDUFS1, HSP60) proteins in the mitochondrial fraction of liver extracts 16 h after doxycycline treatment. Each lane represents one mouse. (C) Enzymatic activity of ETC complexes in liver 12 h after doxycycline treatment. Activity is expressed as % of PBS-treated control, normalized for citrate synthase (CS) activity. (D) CS activity (expressed as % of control) in liver 12 h after doxycycline treatment. (E) Representative images of two independent experiments of transmission electron microscopy in mouse skeletal muscle after doxycycline treatment. Scale bar represents 500 nm. (A) Represents pooled data from four independent experiments. Data in (B) are representative from two independent experiments. (C) and (D) represent mean ± SD of 12 mice/group from two independent experiments. (E) represents data from one experiment; scale bars represent 500 nm. p < 0.05; ∗∗p < 0.01; ∗∗∗p < 0.001; ∗∗∗∗p < 0.0001. See also Figure S5.
Figure 6
Figure 6
Mild, Transient Perturbations in Mitochondrial Function Are Associated with Increased Survival in Sepsis (A and B) CRIF1 and Cre recombinase protein expression (A) and Crif1 mRNA expression (B) in Crif1lox/lox or Crif1lox/− mice 7 days after injection of AAV8-TBG-expressing Cre recombinase (Ad.Cre) or GFP as a control (Ad.GFP). (C) Survival of Crif1lox/lox or Crif1lox/− mice, previously injected with AAV8-TBG-CRE, after infection with E. coli. (D) Bacterial loads in Crif1lox/− mouse blood 24 h after infection. (E) Survival of infected mice treated with phenformin at the time of infection. (F) Bacterial loads in blood 24 h after infection. (G) Enzymatic activity of the ETC complex I in liver at 12 h. ETC activity is expressed as % of PBS-treated control, normalized for CS activity. (H) HPLC-MS analysis of FAO metabolites in liver 8 h after infection and phenformin treatment. Each square represents one mouse. Data in (A) is from a single experiment. (B) represents mean ± SD of four mice per group assayed in triplicate. (C) represents pooled data from three independent experiments. (D) represents data from a single experiment. Bars indicate the mean. (E) represents pooled data from four independent experiments. (F) represents pooled data from two independent experiments. Bars indicate the mean. (G) represents mean ± SD of five mice per group from a single experiment. p < 0.05; ∗∗p < 0.01; ∗∗∗p < 0.001; ∗∗∗∗p < 0.0001. See also Figure S6.
Figure 7
Figure 7
ETC Inhibition Decreases Lipid Accumulation in the Liver (A) Scatterplot of liver genes changed 20 h after infection in doxycycline- versus phenformin-treated groups. Differentially expressed genes are indicated in yellow (doxycycline-treated), cyan (phenformin-treated), or green (both conditions); gray dots indicate non-statistically significant genes (p ≥ 0.05). Adrenergic receptors and genes involved in taurine conjugation to very long and long-chain fatty acids in the peroxisome are highlighted in dark blue and red, respectively. (B) Expression of adrenergic receptors by qPCR in liver at 30 h post-infection. Each square represents one mouse; bars indicate the mean. (C) Survival of mice infected with E. coli and treated with phenformin alone or in combination with propranolol (antagonist of β adrenergic receptors) or prazosin (antagonist of α1 adrenergic receptors). (D) Representative images of oil red-stained liver 20 h after infection and drug treatments (scale bar represents 50 μm). (E) Quantification of lipid droplet areas from (D) (symbols represent the average area of an individual mouse; bars indicate the mean). (F) HPLC-MS quantification of stearoylcarnitine in liver 20 h after infection and drug treatments. Data in (B), (C), (D), (E) and (F) were obtained from a single experiment. Scale bars represent 50 μm. p < 0.05; ∗∗p < 0.01.

Comment in

References

    1. Aksoy M.O., Mardini I.A., Yang Y., Bin W., Zhou S., Kelsen S.G. Glucocorticoid effects on the β-adrenergic receptor-adenylyl cyclase system of human airway epithelium. J. Allergy Clin. Immunol. 2002;109:491–497. - PubMed
    1. Borghesani P.R., Alt F.W., Bottaro A., Davidson L., Aksoy S., Rathbun G.A., Roberts T.M., Swat W., Segal R.A., Gu Y. Abnormal development of Purkinje cells and lymphocytes in Atm mutant mice. Proc. Natl. Acad. Sci. USA. 2000;97:3336–3341. - PMC - PubMed
    1. Bouazza B., Krytska K., Debba-Pavard M., Amrani Y., Honkanen R.E., Tran J., Tliba O. Cytokines alter glucocorticoid receptor phosphorylation in airway cells: role of phosphatases. Am. J. Respir. Cell Mol. Biol. 2012;47:464–473. - PMC - PubMed
    1. Cecconi M., Evans L., Levy M., Rhodes A. Sepsis and septic shock. Lancet. 2018;392:75–87. - PubMed
    1. Chovatiya R., Medzhitov R. Stress, inflammation, and defense of homeostasis. Mol. Cell. 2014;54:281–288. - PMC - PubMed

Publication types