

Loss of USF2 promotes proliferation, migration and mitophagy in a redox-dependent manner
- PMID: 33059314
- PMCID: PMC7566946
- DOI: 10.1016/j.redox.2020.101750
Loss of USF2 promotes proliferation, migration and mitophagy in a redox-dependent manner
Abstract
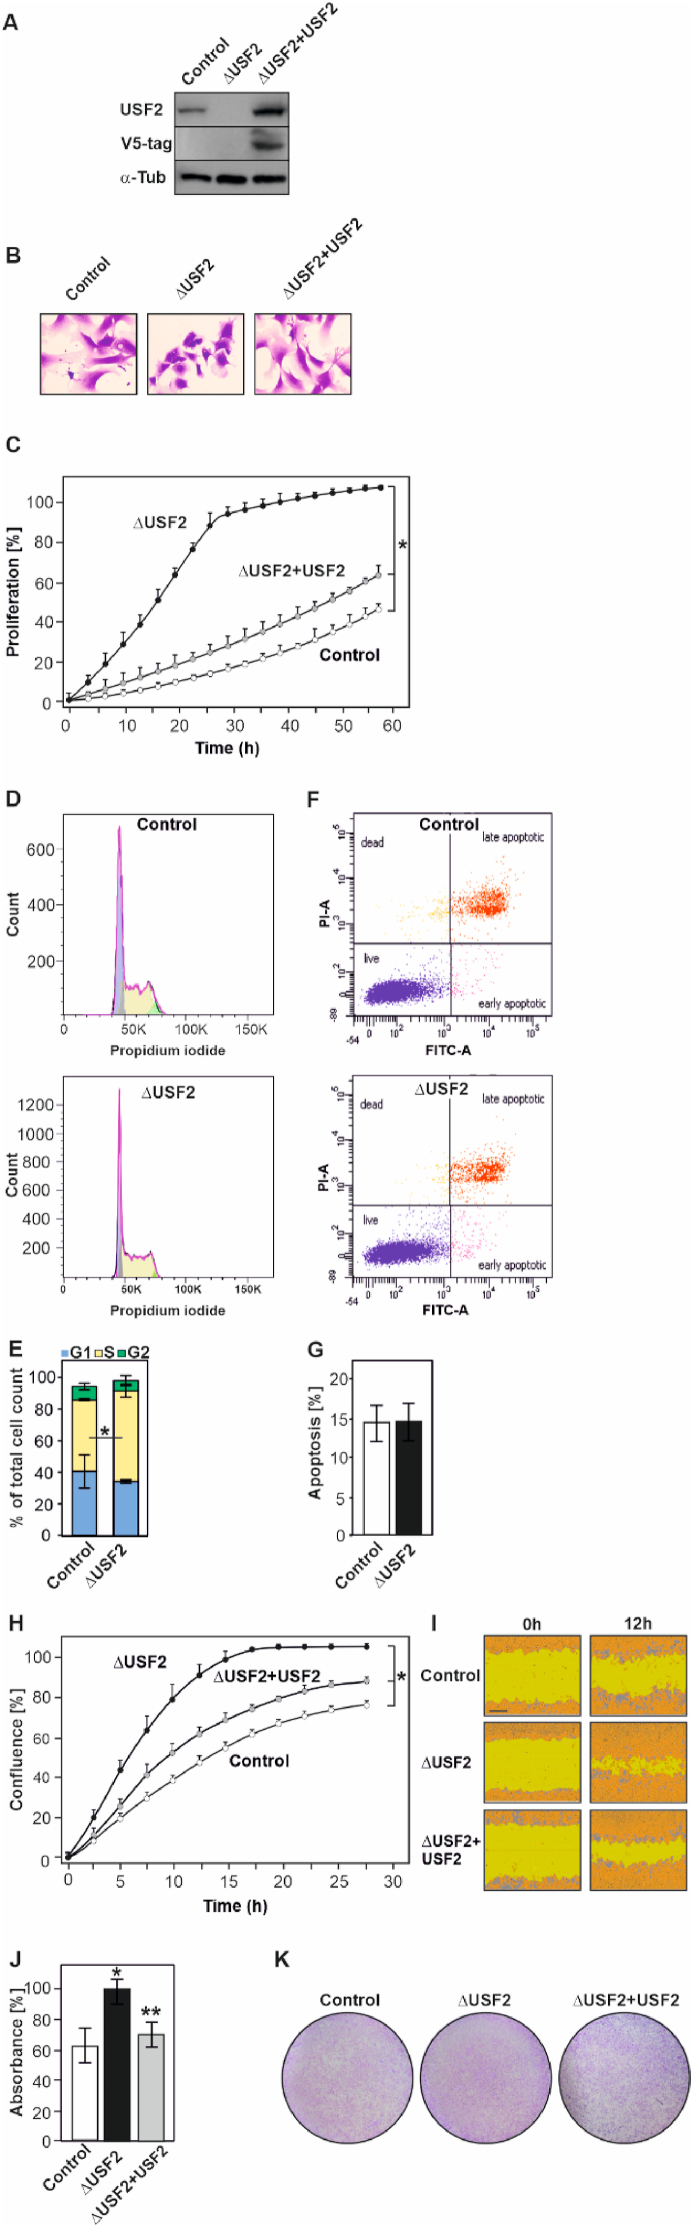
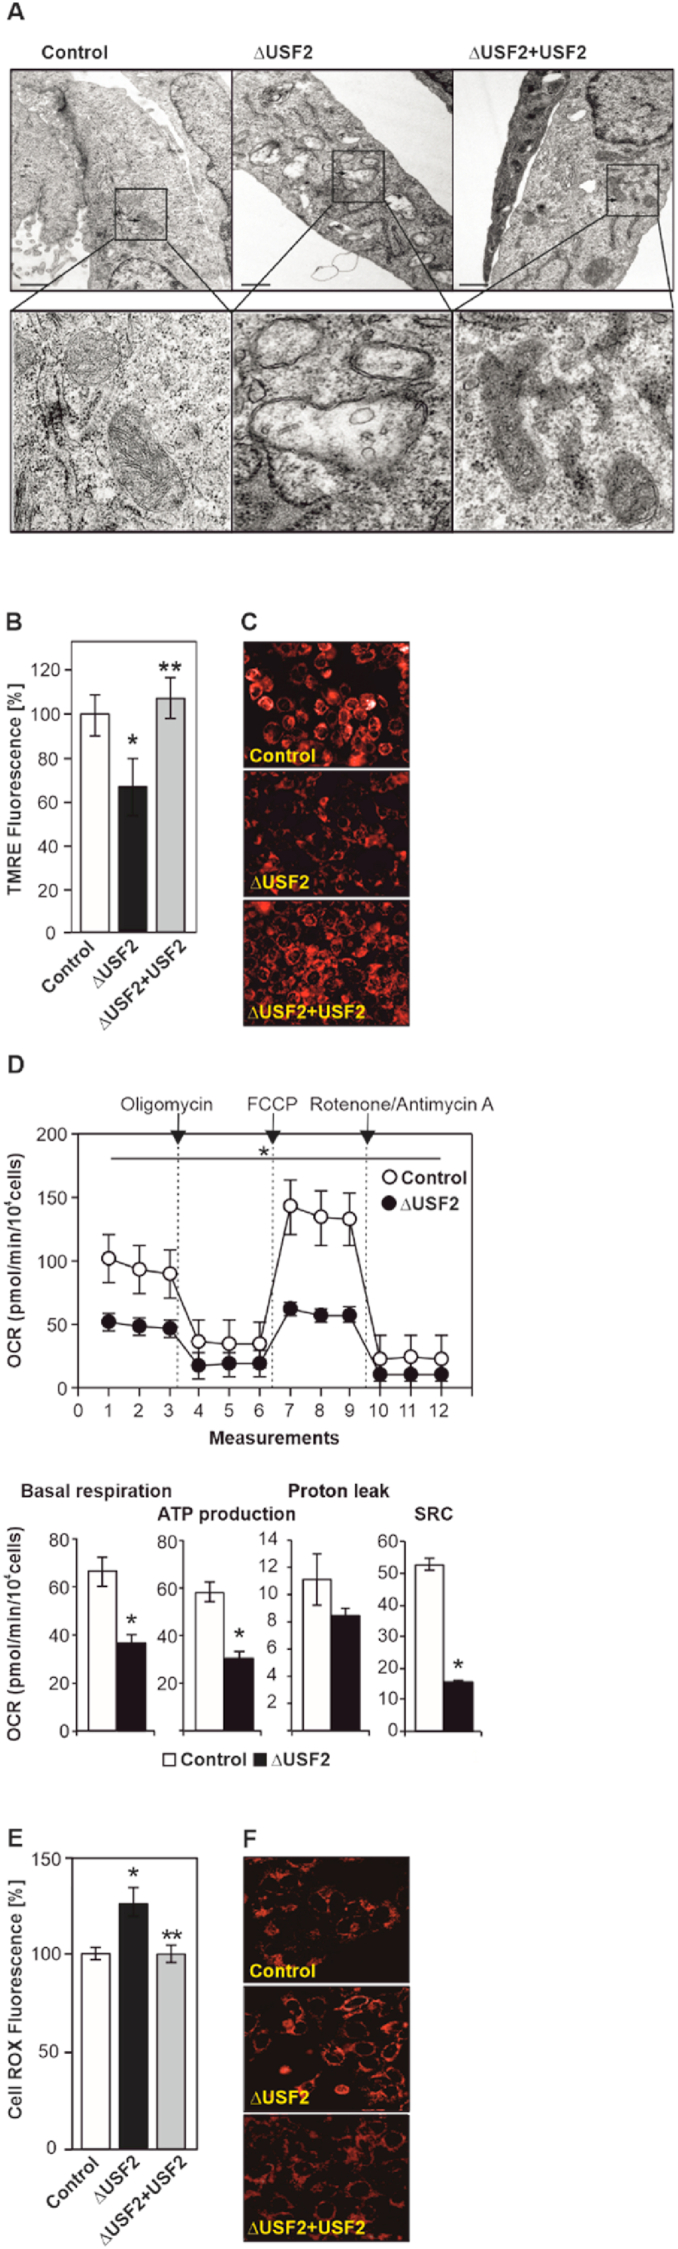
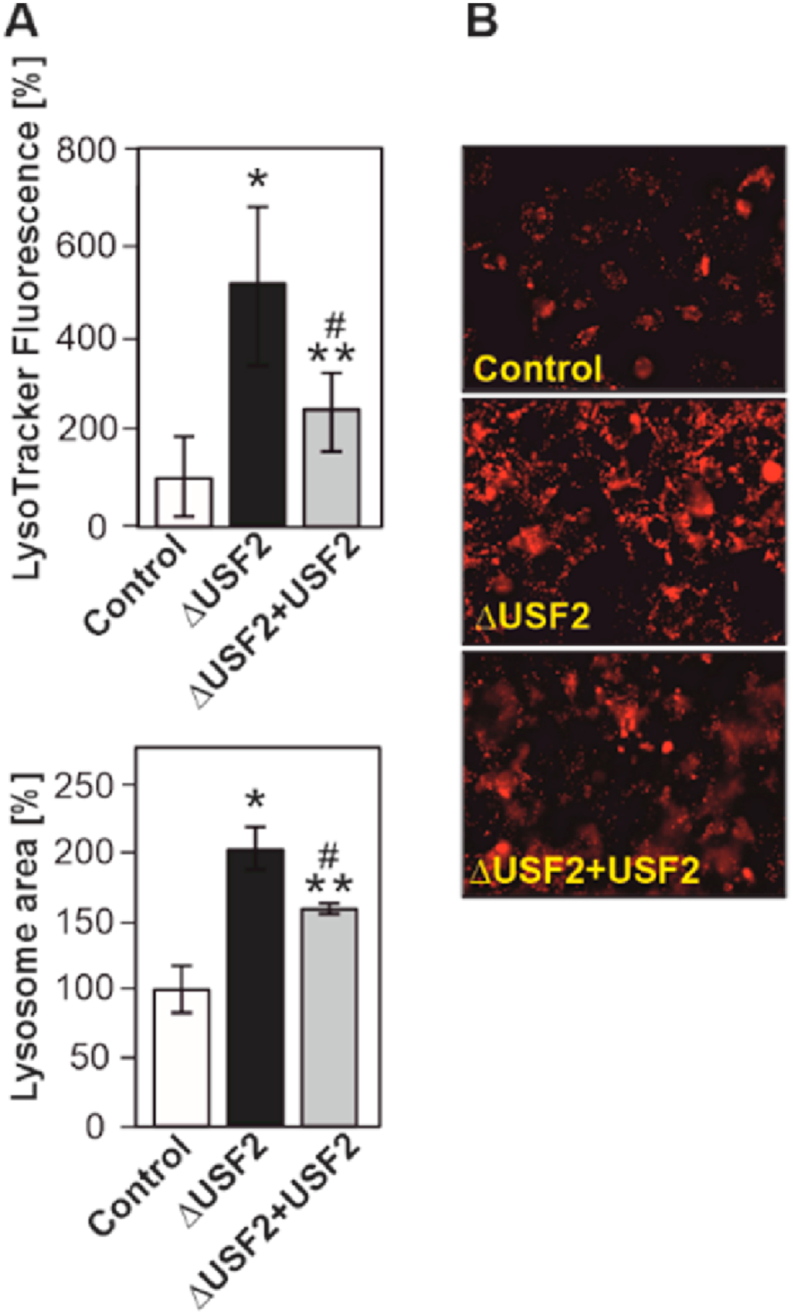
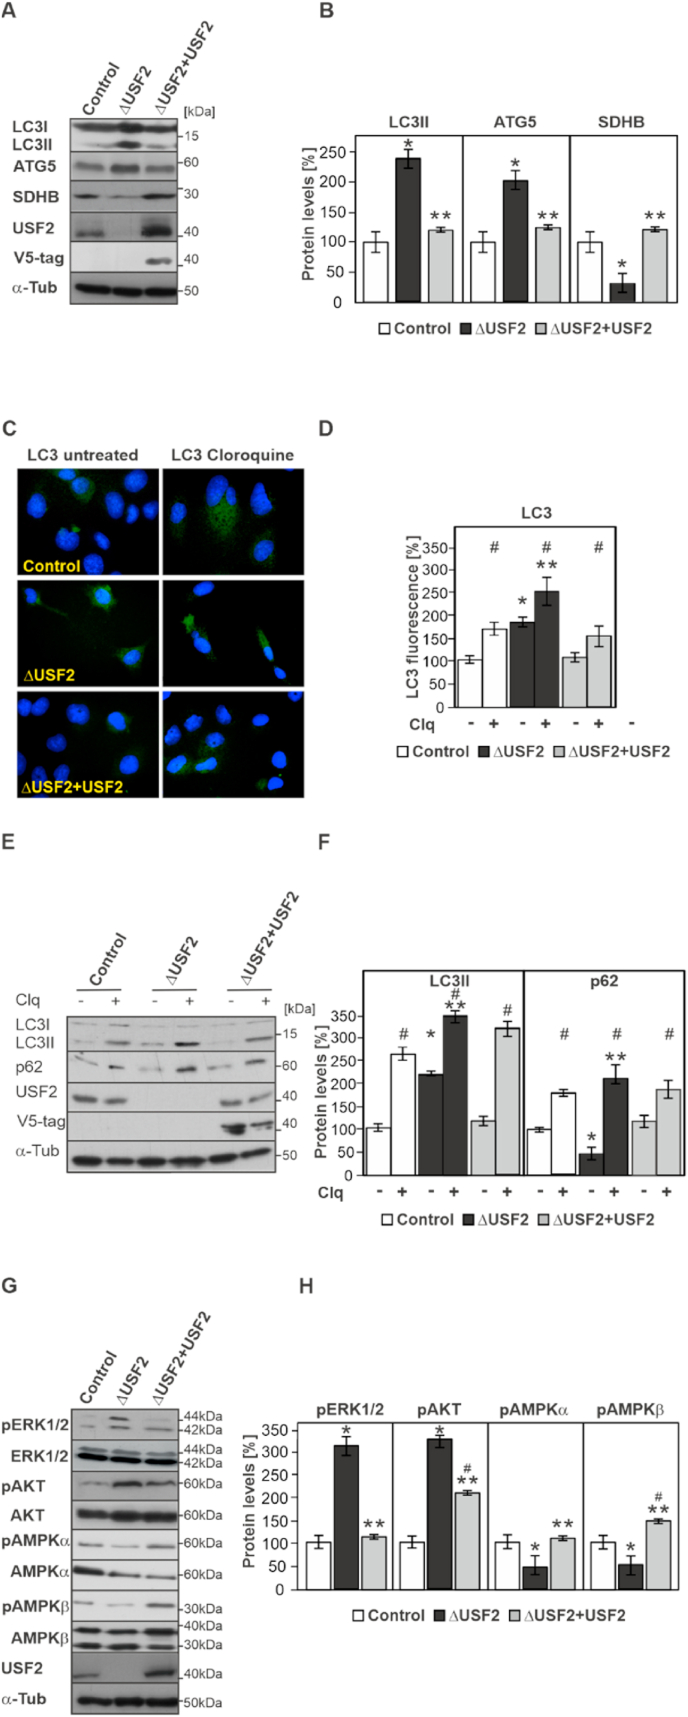
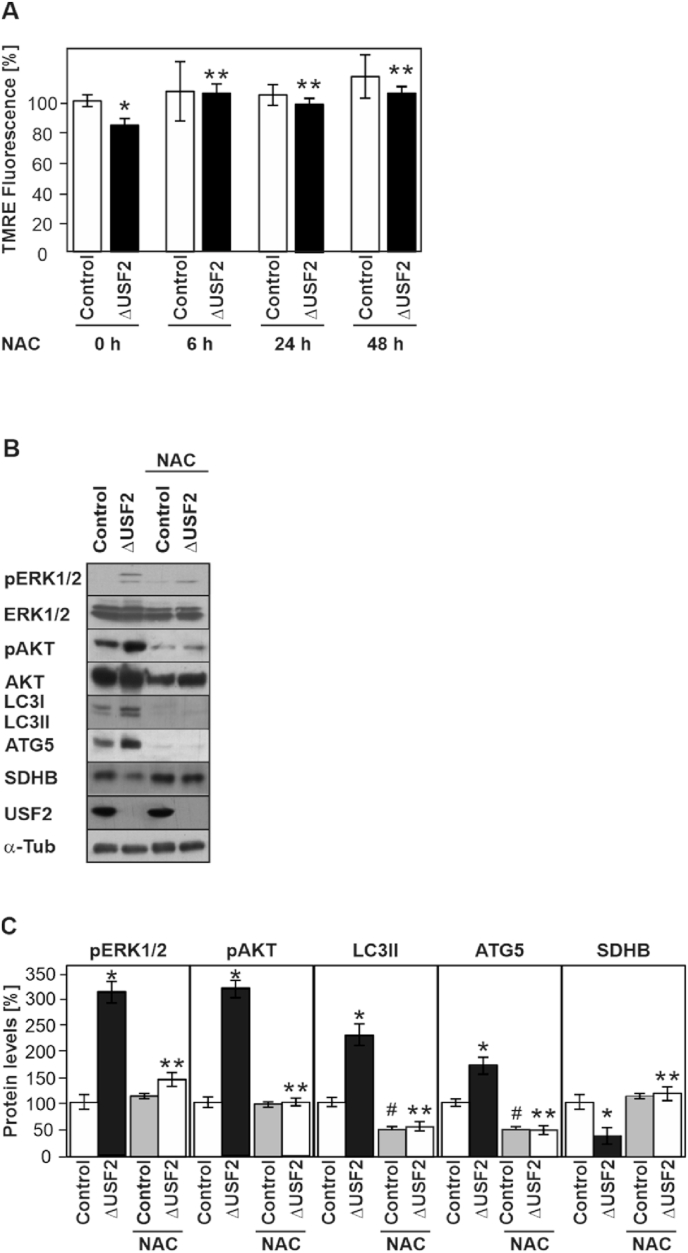
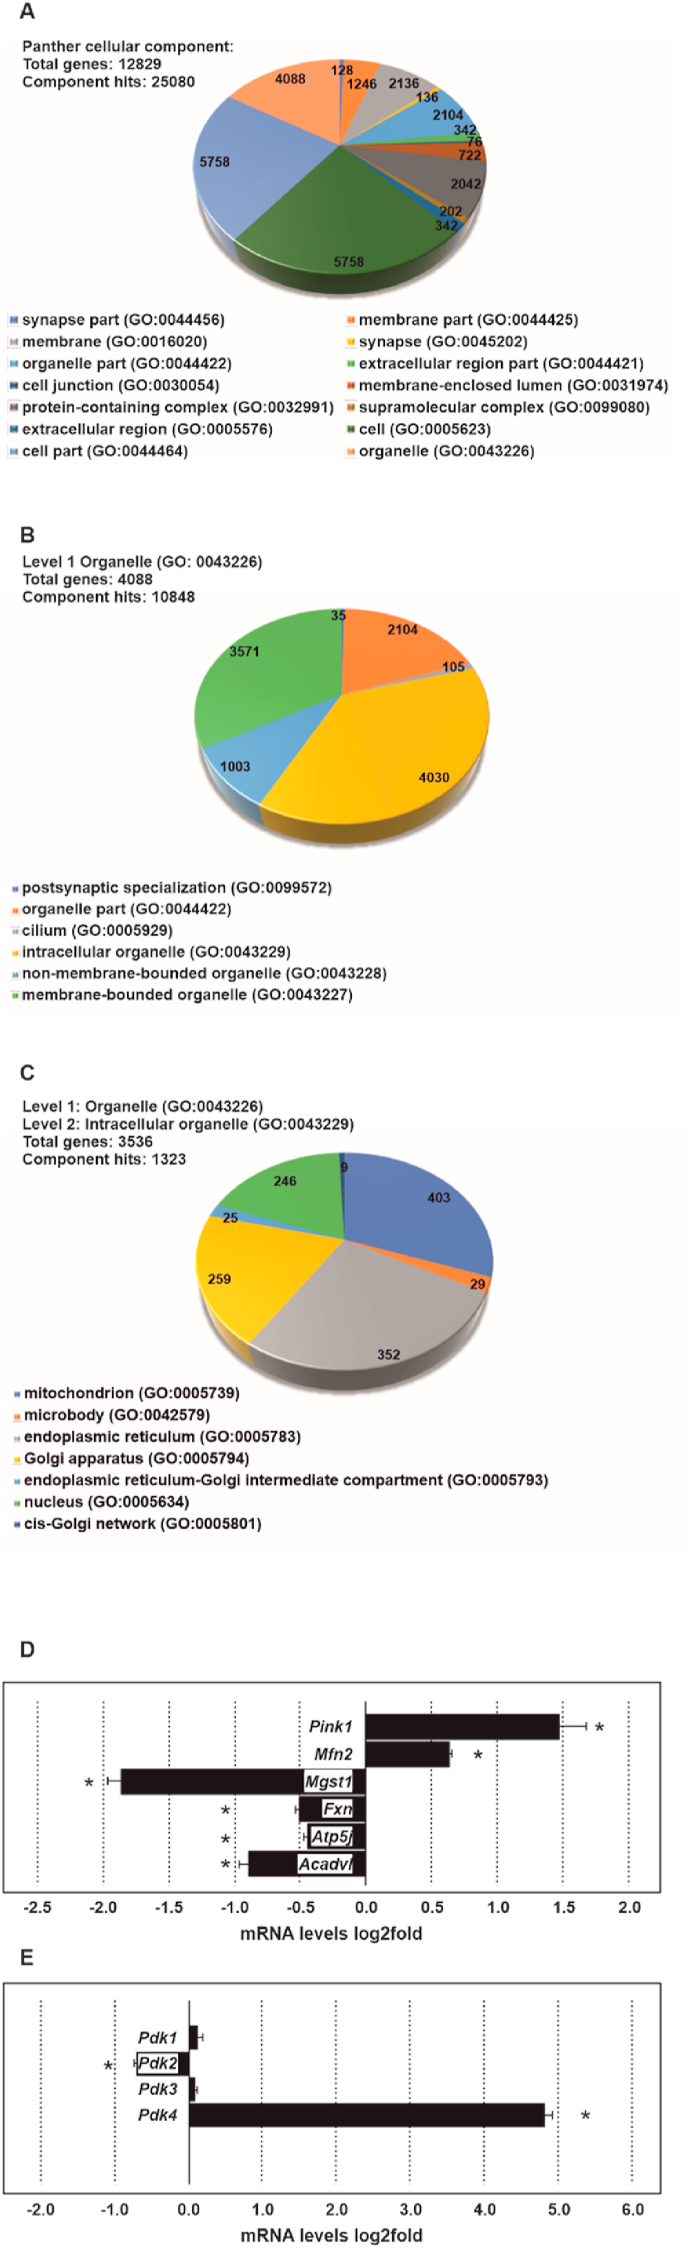
The upstream stimulatory factor 2 (USF2) is a transcription factor implicated in several cellular processes and among them, tumor development seems to stand out. However, the data with respect to the role of USF2 in tumor development are conflicting suggesting that it acts either as tumor promoter or suppressor. Here we show that absence of USF2 promotes proliferation and migration. Thereby, we reveal a previously unknown function of USF2 in mitochondrial homeostasis. Mechanistically, we demonstrate that deficiency of USF2 promotes survival by inducing mitophagy in a ROS-sensitive manner by activating both ERK1/2 and AKT. Altogether, this study supports USF2's function as tumor suppressor and highlights its novel role for mitochondrial function and energy homeostasis thereby linking USF2 to conditions such as insulin resistance, type-2 diabetes mellitus, and the metabolic syndrome.
Keywords: Compromised mitochondria; Migration; Mitophagy; Proliferation; Upstream stimulatory factor 2 (USF2).
Copyright © 2020 The Author(s). Published by Elsevier B.V. All rights reserved.
Conflict of interest statement
The authors declare that there is no conflict of interest-
Figures
Similar articles
-
Cyclin-Dependent Kinase 5 (CDK5)-Mediated Phosphorylation of Upstream Stimulatory Factor 2 (USF2) Contributes to Carcinogenesis.Cancers (Basel). 2019 Apr 12;11(4):523. doi: 10.3390/cancers11040523. Cancers (Basel). 2019. PMID: 31013770 Free PMC article.
-
Regulation of the nuclear gene that encodes the alpha-subunit of the mitochondrial F0F1-ATP synthase complex. Activation by upstream stimulatory factor 2.J Biol Chem. 1997 Apr 18;272(16):10538-42. doi: 10.1074/jbc.272.16.10538. J Biol Chem. 1997. PMID: 9099698
-
Tumor-suppression function of transcription factor USF2 in prostate carcinogenesis.Oncogene. 2006 Jan 26;25(4):579-87. doi: 10.1038/sj.onc.1209079. Oncogene. 2006. PMID: 16186802
-
Emerging role of transcription factor EB in mitochondrial quality control.Biomed Pharmacother. 2020 Aug;128:110272. doi: 10.1016/j.biopha.2020.110272. Epub 2020 May 22. Biomed Pharmacother. 2020. PMID: 32447212 Review.
-
Redox homeostasis, oxidative stress and mitophagy.Mitochondrion. 2020 Mar;51:105-117. doi: 10.1016/j.mito.2020.01.002. Epub 2020 Jan 20. Mitochondrion. 2020. PMID: 31972372 Free PMC article. Review.
Cited by
-
Usf2 Deficiency Promotes Autophagy to Alleviate Cerebral Ischemia-Reperfusion Injury Through Suppressing YTHDF1-m6A-Mediated Cdc25A Translation.Mol Neurobiol. 2024 May;61(5):2556-2568. doi: 10.1007/s12035-023-03735-8. Epub 2023 Nov 2. Mol Neurobiol. 2024. PMID: 37914905
-
Molecular regulation of mitophagy signaling in tumor microenvironment and its targeting for cancer therapy.Cytokine Growth Factor Rev. 2025 Jan 17:S1359-6101(25)00004-8. doi: 10.1016/j.cytogfr.2025.01.004. Online ahead of print. Cytokine Growth Factor Rev. 2025. PMID: 39880721 Review.
-
Transcription factors ASCL1 and OLIG2 drive glioblastoma initiation and co-regulate tumor cell types and migration.Nat Commun. 2024 Nov 28;15(1):10363. doi: 10.1038/s41467-024-54750-9. Nat Commun. 2024. PMID: 39609428 Free PMC article.
-
Integrated bioinformatics combined with machine learning to analyze shared biomarkers and pathways in psoriasis and cervical squamous cell carcinoma.Front Immunol. 2024 May 28;15:1351908. doi: 10.3389/fimmu.2024.1351908. eCollection 2024. Front Immunol. 2024. PMID: 38863714 Free PMC article.
-
Stromal architecture and fibroblast subpopulations with opposing effects on outcomes in hepatocellular carcinoma.Cell Discov. 2025 Jan 28;11(1):1. doi: 10.1038/s41421-024-00747-z. Cell Discov. 2025. PMID: 39870619 Free PMC article.
References
-
- Sawadogo M., Roeder R.G. Interaction of a gene-specific transcription factor with the adenovirus major late promoter upstream of the TATA box region. Cell. 1985;43:165–175. - PubMed
-
- Yan S., Sloane B.F. Isolation of a novel USF2 isoform: repressor of cathepsin B expression. Gene. 2004;337:199–206. 199-206. - PubMed
-
- Viollet B., Lefrançois-Martinez A.M., Henrion A. Immunochemical characterization and transacting properties of upstream stimulatory factor isoforms. J. Biol. Chem. 1996;271:1405–1415. - PubMed
-
- Galibert M.D., Boucontet L., Goding C.R. Recognition of the E-C4 element from the C4 complement gene promoter by the upstream stimulatory factor-1 transcription factor. J. Immunol. 1997;159:6176–6183. - PubMed
Publication types
MeSH terms
LinkOut - more resources
Full Text Sources
Miscellaneous
