. 2021 Nov 2;73(9):e3398-e3408.
doi: 10.1093/cid/ciaa1562.

Immune Profiling Enables Stratification of Patients With Active Tuberculosis Disease or Mycobacterium tuberculosis Infection

Collaborators, Affiliations

Immune Profiling Enables Stratification of Patients With Active Tuberculosis Disease or Mycobacterium tuberculosis Infection

Darragh Duffy et al. Clin Infect Dis. .

Abstract

Background: Tuberculosis (TB) is caused by Mycobacterium tuberculosis (Mtb) infection and is a major public health problem. Clinical challenges include the lack of a blood-based test for active disease. Current blood-based tests, such as QuantiFERON (QFT) do not distinguish active TB disease from asymptomatic Mtb infection.

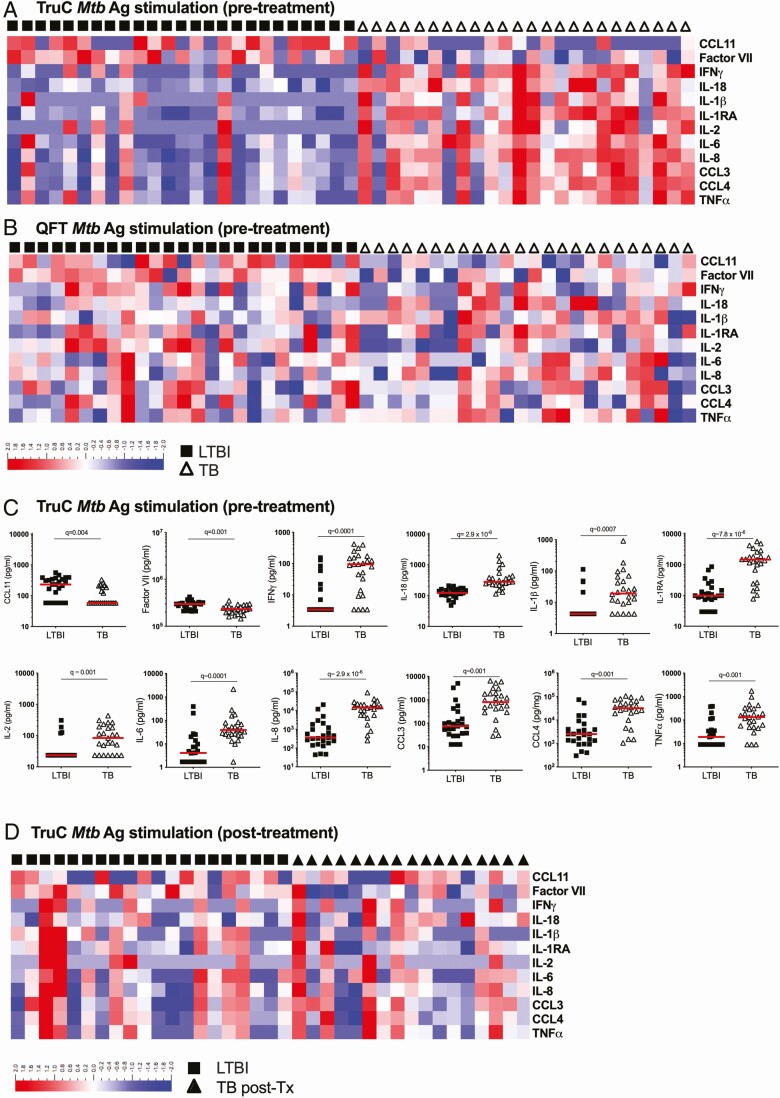
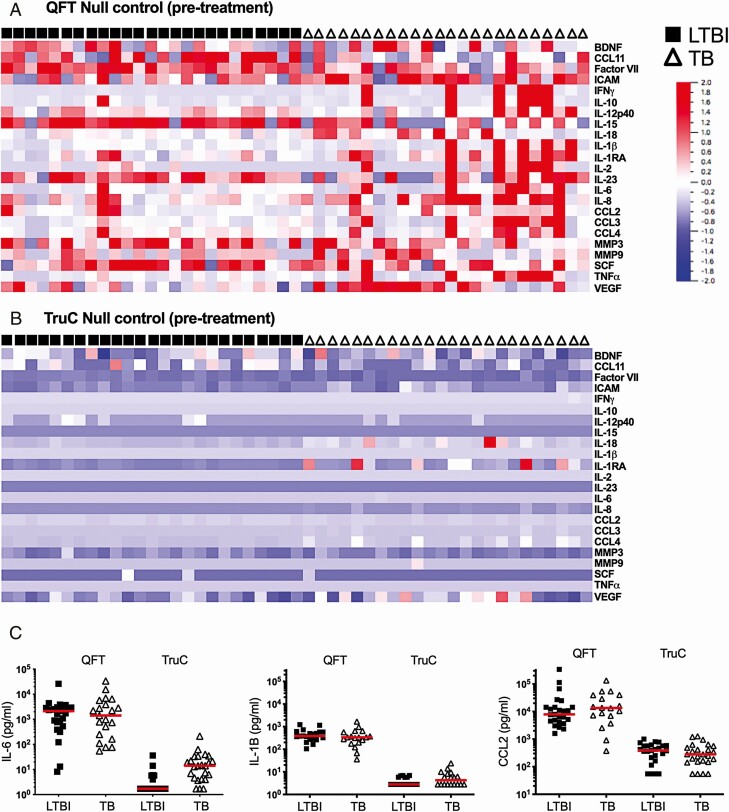
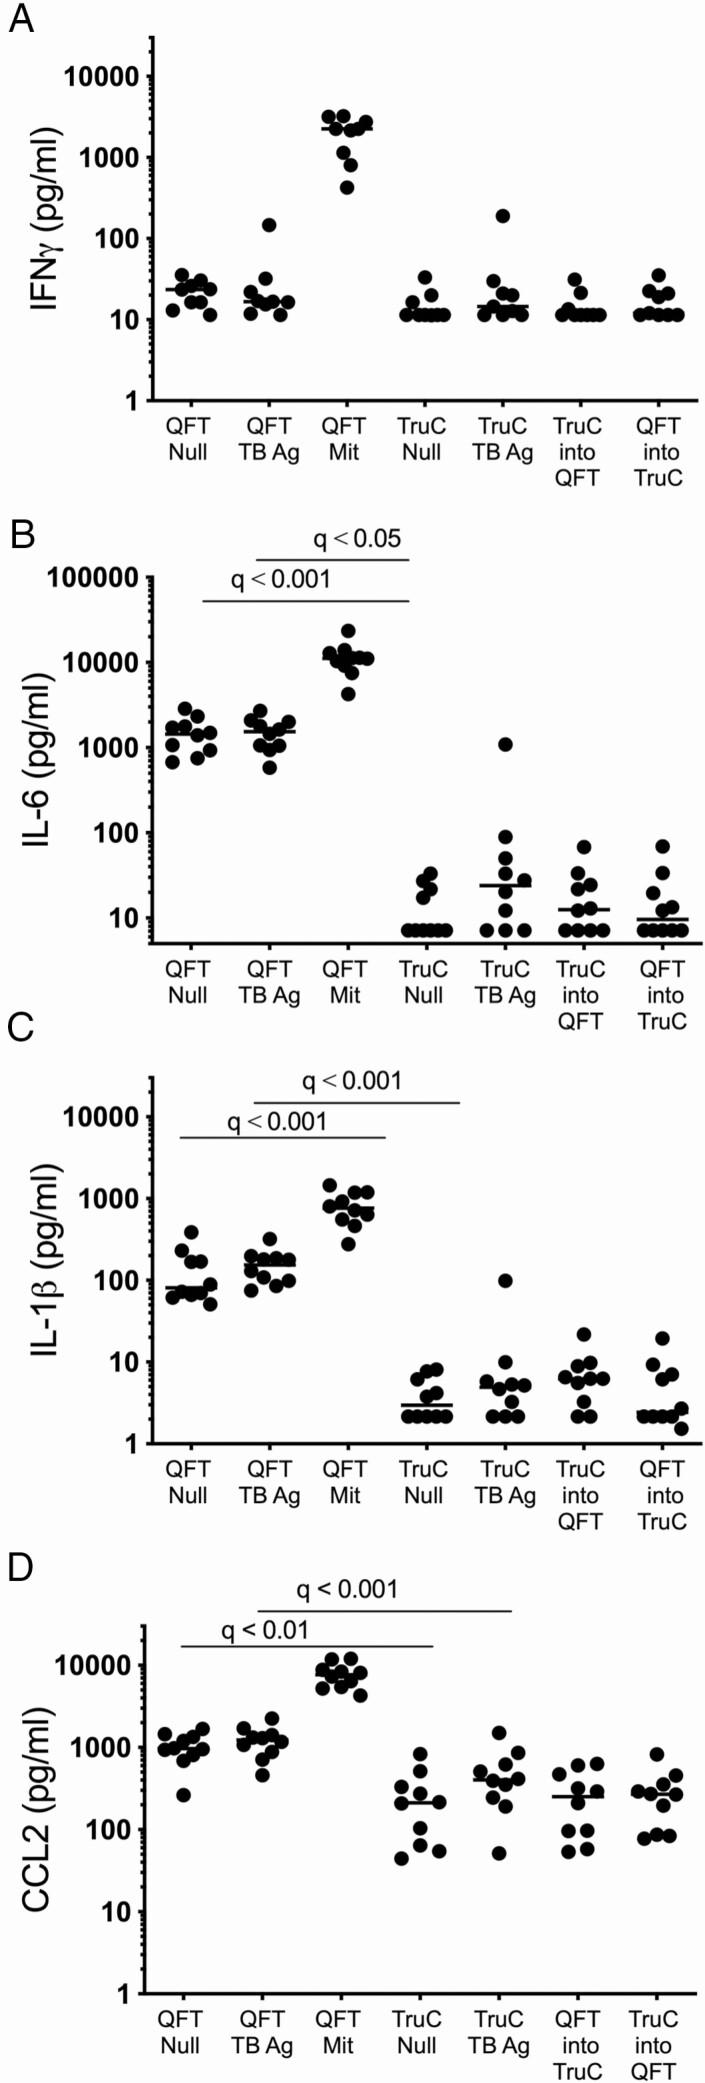
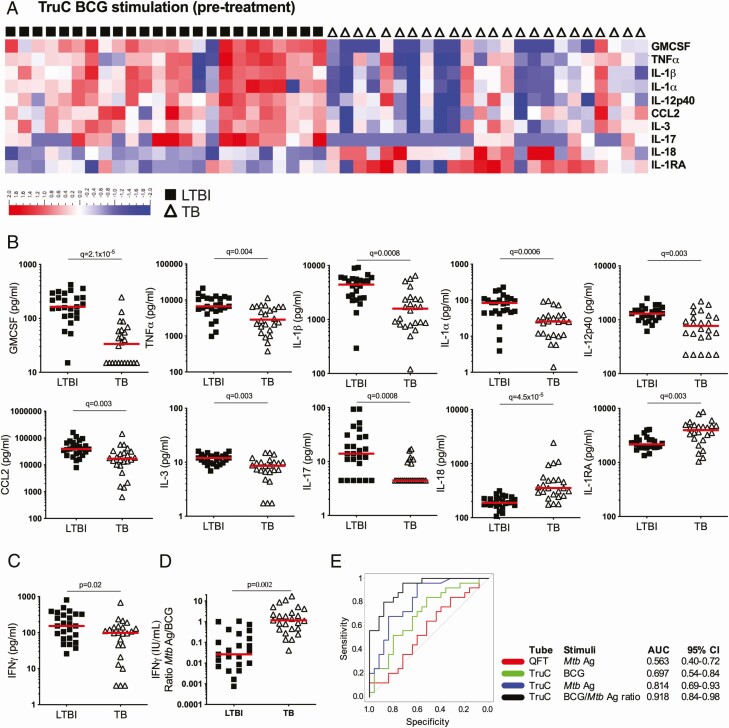
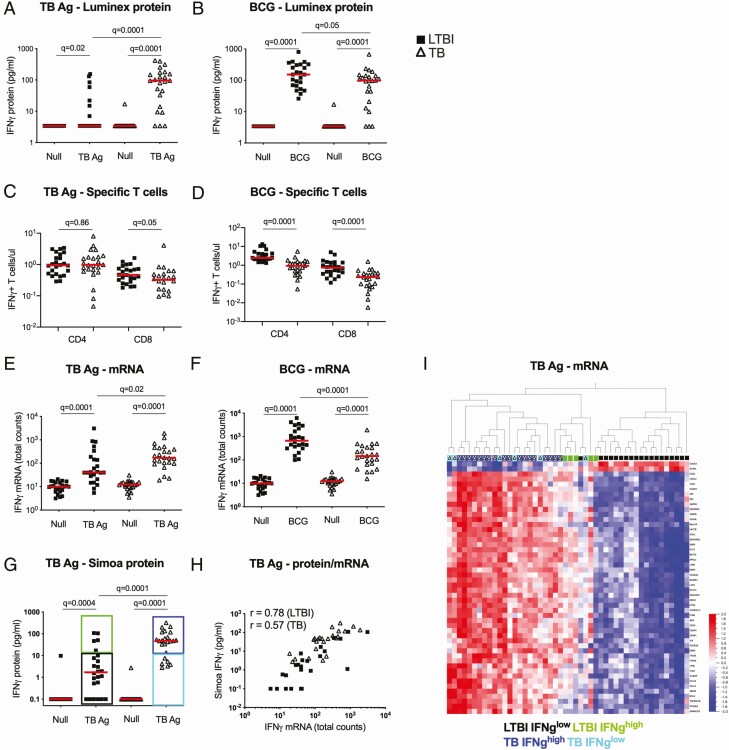
Methods: We hypothesized that TruCulture, an immunomonitoring method for whole-blood stimulation, could discriminate active disease from latent Mtb infection (LTBI). We stimulated whole blood from patients with active TB and compared with LTBI donors. Mtb-specific antigens and live bacillus Calmette-Guérin (BCG) were used as stimuli, with direct comparison to QFT. Protein analyses were performed using conventional and digital enzyme-linked immunosorbent assay (ELISA), as well as Luminex.

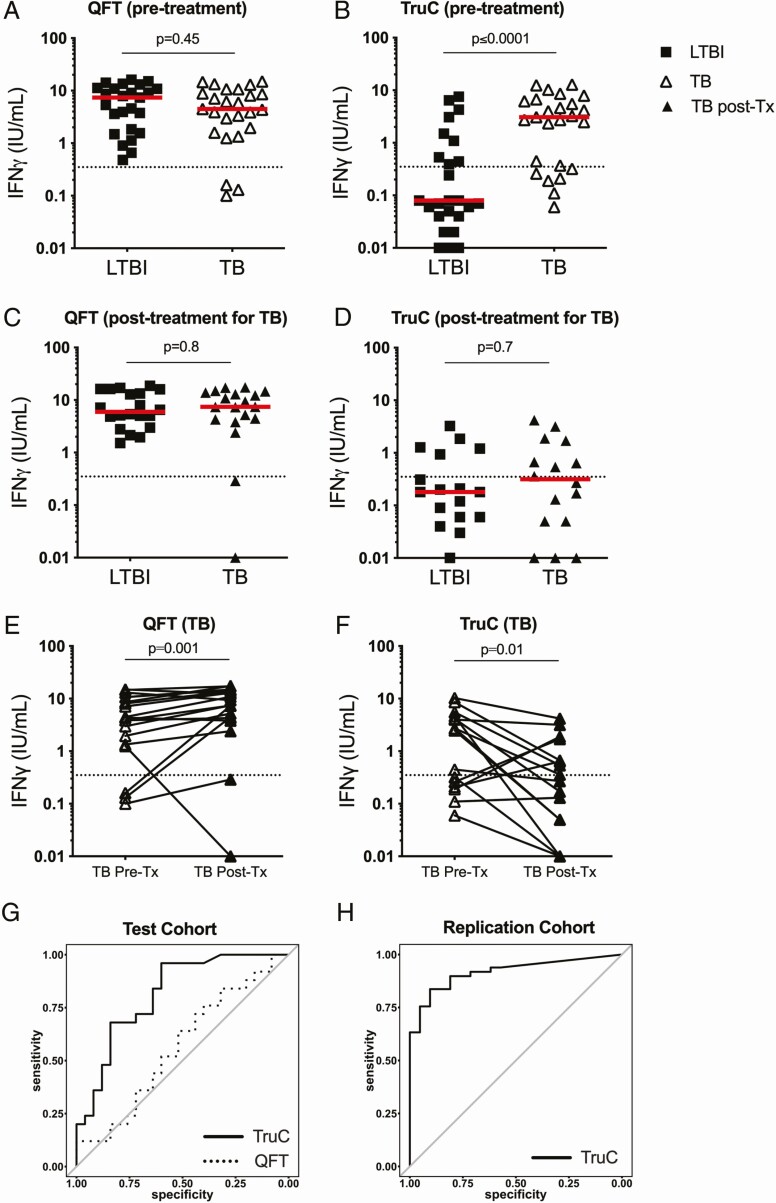
Results: TruCulture showed discrimination of active TB cases from LTBI (P < .0001, AUC = .81) compared with QFT (P = .45, AUC = .56), based on an interferon γ (IFNγ) readout after Mtb antigen (Ag) stimulation. This result was replicated in an independent cohort (AUC = .89). In exploratory analyses, TB stratification could be further improved by the Mtb antigen to BCG IFNγ ratio (P < .0001, AUC = .91). Finally, the combination of digital ELISA and transcriptional analysis showed that LTBI donors with high IFNγ clustered with patients with TB, suggesting the possibility to identify subclinical disease.

Conclusions: TruCulture offers a next-generation solution for whole-blood stimulation and immunomonitoring with the possibility to discriminate active and latent infection.

Keywords: biomarkers; cytokines; immune profiling; patient stratification; tuberculosis.


Figures

Figure 1.
Figure 1.
IFNγ Mtb Ag response. IFNγ response following Mtb Ag stimulation and subtraction of the null control in patients with LTBI and TB in QFT tubes pretreatment (A), TruC tubes pretreatment (B), QFT tubes after successful antibiotic treatment in patients with TB (C), and TruC tubes after successful antibiotic treatment in patients with TB (D). a, b: n = 25/25; c, d: n = 19/18 LTBI/TB, Mann Whitney; bars represent the median values, the dotted line is the QFT positive cutoff at 0.35 IU/mL. Paired IFNγ responses following Mtb Ag stimulation and subtraction of the null control in patients with TB pre- and posttreatment in QFT tubes (E) and TruC tubes (F) (paired t test). G, ROC curve analysis of the IFNγ response to classify active disease following Mtb Ag stimulation in TruC (black lines) or QFT (dashed lines) tubes in the initial cohort; H, ROC curve analysis of the IFNγ response to classify active disease following Mtb Ag stimulation in TruC in a blinded independent replication study (n = 80). TB: black squares; LTBI: open triangles; TB post-treatment: black triangles. Abbreviations: Ag, antigen; IFNγ, interferon γ; LTBI, latent Mycobacterium tuberculosis infection; Mtb, Mycobacterium tuberculosis; post-Tx, post-treatment; QFT, QuantiFERON; ROC, receiver operating characteristic; TB, tuberculosis; TruC, TruCulture.
Figure 2.
Figure 2.
Differential cytokine responses in Mtb infection versus TB disease. Heatmaps of relative expression levels for 12 differential cytokines (LTBI vs TB groups, Mann-Whitney q < 0.01) segregated by patient group (LTBI: black squares; TB: open triangles) after Mtb Ag stimulation in TruC (A) or QFT (B) tubes prior to treatment, and (D) TruC Mtb Ag stimulation after successful antibiotic treatment of the TB patient group (TB post-treatment: closed triangles). C, Dot plot representations of the differential cytokine concentrations between LTBI and TB groups (q < 0.01) in TruC tubes prior to treatment. a, b, c: n = 25/25; e: n = 19/18 latent/active; bars represent the median values, q value: FDR-corrected Mann-Whitney test). Abbreviations: Ag, antigen; FDR, false discovery rate; IFNγ, interferon γ; IL, interleukin; LTBI, latent Mycobacterium tuberculosis infection; Mtb, Mycobacterium tuberculosis; post-Tx, post-treatment; QFT, QuantiFERON; TB, tuberculosis; TNFɑ, tumor necrosis factor ɑ; TruC, TruCulture.
Figure 3.
Figure 3.
Differential cytokines in QFT and TruC null tubes. Heatmaps of relative cytokine expression levels segregated by patient group (LTBI: black squares; TB: open triangles) in QFT (A) and TruC null tubes (B) for 22 out of 32 cytokines measured, selected based on variance (σ/σ max = 0.138). C, Concentrations of IL-6, IL-1β, and CCL2 in QFT and TruC null tubes in patients with LTBI and TB. n = 25/25; bars represent the median values. Abbreviations: BDNF, brain derived neurotrophic factor; ICAM, intercellular adhesion molecule IFNγ, interferon γ; IL, interleukin; LTBI, latent Mycobacterium tuberculosis infection; MMP, matrix metallopeptidase; QFT, QuantiFERON; TB, tuberculosis; SCF, stem cell factor; TNFɑ, tumor necrosis factor ɑ; TruC, TruCulture; VEGF, vascular endothelial growth factor.
Figure 4.
Figure 4.
Cytokine responses in donors from a nonendemic TB region. Concentrations of IFNγ (A), IL-6 (B), IL-1β (C), and CCL2 (D) in QFT null, QFT TB Ag, QFT Mit, TruC null, TruC TB Ag, TruC BCG, and mixed cultures of TruC-QFT and QFT-TruC null conditions in healthy donors from a nonendemic region (n = 10; bars represent the median values, Friedman test with Dunn’s multiple-comparison test). Abbreviations: Ag, antigen; BCG, bacillus Calmette-Guérin; IFNγ, interferon γ; IL, interleukin; Mit, Mitogen; QFT, QuantiFERON; TB, tuberculosis; TruC, TruCulture.
Figure 5.
Figure 5.
BCG-induced immune responses in Mtb infection versus TB disease. A, Heatmap of relative cytokine expression levels segregated by patient group (LTBI: black squares; TB: open triangles) after BCG TruC stimulation, and identification of differential proteins after FDR-adjusted Mann-Whitney tests between LTBI and TB groups. B, Dot plot representations of the cytokine concentrations of differential proteins between LTBI and TB groups: GMCSF, TNFα, IL-1β, IL-1α, IL-12p40, CCL2, IL-3, IL-17, IL-18, IL-1RA. (C) IFNγ BCG response and (D) ratio (IU/mL) of Mtb Ag/BCG stimulation for patients with LTBI and TB. E, ROC curve analysis of IFNγ ratio to Mtb Ag/BCG stimulation (black), IFNγ concentrations of TruC Mtb Ag (blue), TruC BCG (green), and QFT Mtb Ag (red) stimulations. n = 25/25; bars represent the median values; q value: FDR-corrected Student’s t test). Abbreviations: Ag, antigen; AUC, area under the receiver operating characteristic curve; BCG, bacillus Calmette-Guérin; CI, confidence interval; CCL, chemokine (C-C motif) ligand; FDR, false discovery rate; GMCSF, granulocyte-macrophage colony-stimulating factor; IFNγ, interferon γ; IL, interleukin; LTBI, latent Mycobacterium tuberculosis infection; Mtb, Mycobacterium tuberculosis; QFT, QuantiFERON; ROC, receiver operating characteristic; TB, tuberculosis; TNFɑ, tumor necrosis factor ɑ; TruC, TruCulture.
Figure 6.
Figure 6.
Differential IFNγ responses to TB Ag and BCG stimulations. IFNγ protein levels measured by Luminex in TruCulture supernatants after TB Ag (A) and BCG (B) stimulations. Total numbers of IFNγ+ CD4+ and IFNγ+ CD8+ T cells measured by flow cytometry in TB Ag (C) and BCG-stimulated whole blood (D). IFNγ mRNA levels measured by nanostring in TruCulture cell pellets after TB Ag (E) and BCG (F) stimulations. G, IFNγ levels measured by Simoa digital ELISA in TruCulture supernatants after TB Ag stimulation. Classification in 4 different groups according to disease status and IFNγ levels: LTBI IFNγ low (black), LTBI IFNγ high (green), TB IFNγ high (dark blue) and TB IFNlow (light blue). H, Correlation plot between IFNγ protein levels measured by Simoa and IFNγ mRNA total counts measured by nanostring, after TB Ag stimulation (Pearson correlation). I, Heatmap showing the 50 most differentially expressed genes between TB and LTBI for the TB Ag stimulation (unsupervised hierarchical clustering). Individuals are coded according to disease status and levels of IFNγ secretion, as illustrated in panel G. Solid lines depict medians. Comparisons of LTBI/TB groups within the same stimulation were performed using unpaired Mann-Whitney tests; comparisons between null and stimulated conditions within the LTBI/TB groups were performed using a Wilcoxon test. Correction for multiple comparisons was then applied. LTBI: black squares; TB: open triangles. Abbreviations: Ag, antigen; BCG, bacillus Calmette-Guérin; ELISA, enzyme-linked immunosorbent assay; IFNγ, interferon γ; LTBI, latent Mycobacterium tuberculosis infection; TB, tuberculosis.

References

    1. World Health Organization. Global tuberculosis report 2018. Geneva, Switzerland, World Health Organization, 2018.
    1. Houben RM, Dodd PJ. The global burden of latent tuberculosis infection: a re-estimation using mathematical modelling. PLoS Med 2016; 13:e1002152. - PMC - PubMed
    1. O’Garra A, Redford PS, McNab FW, Bloom CI, Wilkinson RJ, Berry MP. The immune response in tuberculosis. Annu Rev Immunol 2013; 31:475–527. - PubMed
    1. Banaei N, Gaur RL, Pai M. Interferon gamma release assays for latent tuberculosis: what are the sources of variability? J Clin Microbiol 2016; 54:845–50. - PMC - PubMed
    1. Nemes E, Rozot V, Geldenhuys H, et al. ; C-040-404 Study Team and the Adolescent Cohort Study Team . Optimization and interpretation of serial QuantiFERON testing to measure acquisition of Mycobacterium tuberculosis infection. Am J Respir Crit Care Med 2017; 196:638–48. - PMC - PubMed

Publication types

Substances