

Comparison of Dynamic Contrast-Enhancement Parameters between Gadobutrol and Gadoterate Meglumine in Posttreatment Glioma: A Prospective Intraindividual Study
- PMID: 33060100
- PMCID: PMC7658849
- DOI: 10.3174/ajnr.A6792
Comparison of Dynamic Contrast-Enhancement Parameters between Gadobutrol and Gadoterate Meglumine in Posttreatment Glioma: A Prospective Intraindividual Study
Abstract
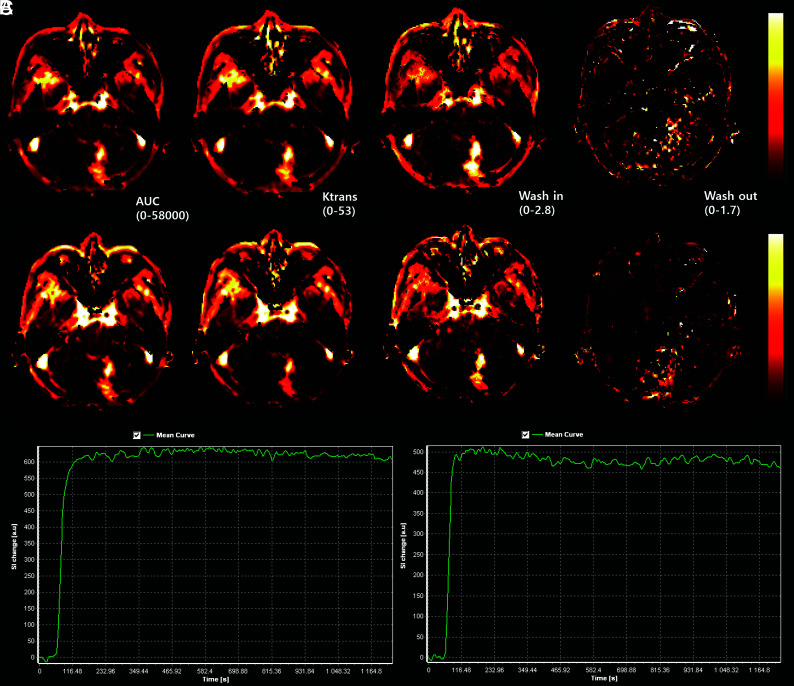
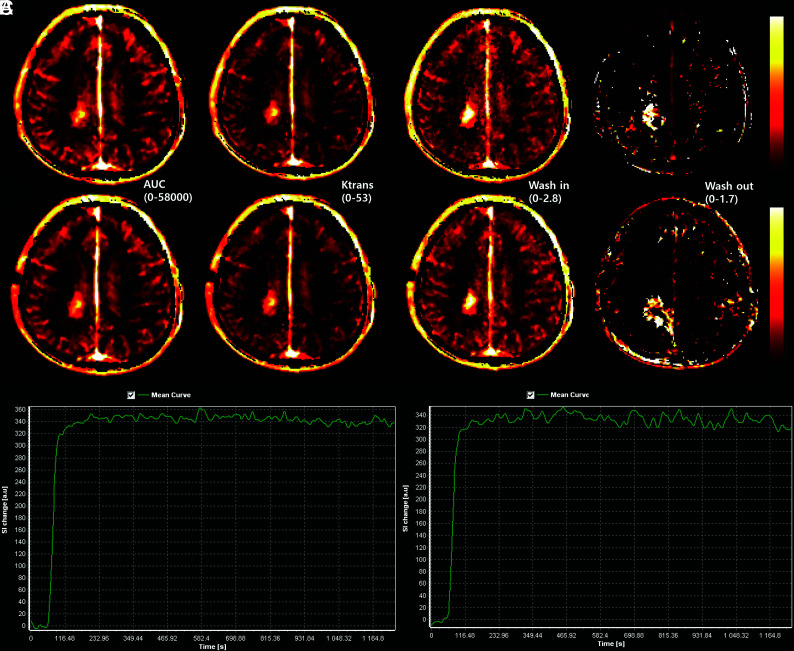
Background and purpose: Differences in molecular properties between one-molar and half-molar gadolinium-based contrast agents are thought to affect parameters obtained from dynamic contrast-enhanced imaging. The aim of our study was to investigate differences in dynamic contrast-enhanced parameters between one-molar nonionic gadobutrol and half-molar ionic gadoterate meglumine in patients with posttreatment glioma.
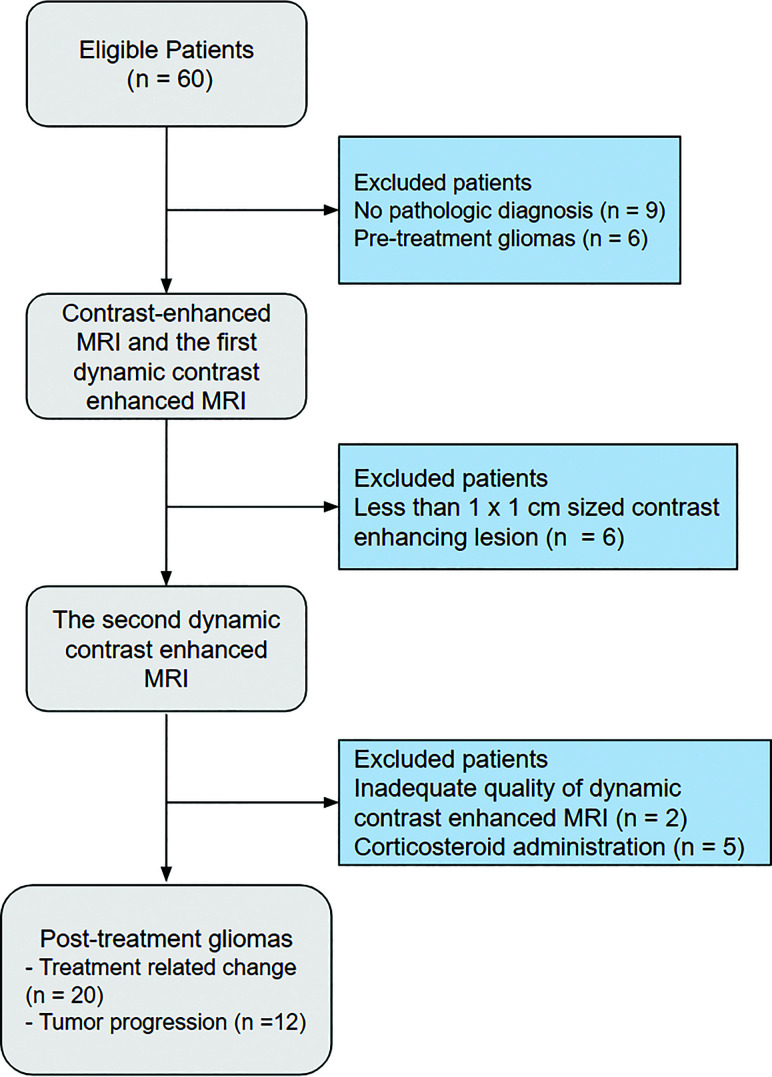
Materials and methods: This prospective study enrolled 32 patients who underwent 2 20-minute dynamic contrast-enhanced examinations, one with gadobutrol and one with gadoterate meglumine. The model-free parameter of area under the signal intensity curve from 30 to 1100 seconds and the Tofts model-based pharmacokinetic parameters were calculated and compared intraindividually using paired t tests. Patients were further divided into progression (n = 12) and stable (n = 20) groups, which were compared using Student t tests.
Results: Gadobutrol and gadoterate meglumine did not show any significant differences in the area under the signal intensity curve or pharmacokinetic parameters of K trans, Ve, Vp, or Kep (all P > .05). Gadobutrol showed a significantly higher mean wash-in rate (0.83 ± 0.64 versus 0.29 ± 0.63, P = .013) and a significantly lower mean washout rate (0.001 ± 0.0001 versus 0.002 ± 0.002, P = .02) than gadoterate meglumine. Trends toward higher area under the curve, K trans, Ve, Vp, wash-in, and washout rates and lower Kep were observed in the progression group in comparison with the treatment-related-change group, regardless of the contrast agent used.
Conclusions: Model-free and pharmacokinetic parameters did not show any significant differences between the 2 gadolinium-based contrast agents, except for a higher wash-in rate with gadobutrol and a higher washout rate with gadoterate meglumine, supporting the interchangeable use of gadolinium-based contrast agents for dynamic contrast-enhanced imaging in patients with posttreatment glioma.
© 2020 by American Journal of Neuroradiology.
Figures
Similar articles
-
Comparison of gadobutrol and meglumine gadoterate for dynamic contrast-enhanced MRI of pituitary macroadenomas.Sci Rep. 2025 Jul 21;15(1):26419. doi: 10.1038/s41598-025-10702-x. Sci Rep. 2025. PMID: 40691479 Free PMC article. Clinical Trial.
-
Dynamic contrast-enhanced MR imaging of the prostate: intraindividual comparison of gadoterate meglumine and gadobutrol.Eur Radiol. 2019 Dec;29(12):6982-6990. doi: 10.1007/s00330-019-06321-6. Epub 2019 Jul 1. Eur Radiol. 2019. PMID: 31264013
-
Evaluation of gadobutrol, a macrocyclic, nonionic gadolinium chelate in a brain glioma model: comparison with gadoterate meglumine and gadopentetate dimeglumine at 1.5 T, combined with an assessment of field strength dependence, specifically 1.5 versus 3 T.J Magn Reson Imaging. 2010 Mar;31(3):549-55. doi: 10.1002/jmri.22089. J Magn Reson Imaging. 2010. PMID: 20187196
-
Dynamic and static magnetic resonance angiography of the supra-aortic vessels at 3.0 T: intraindividual comparison of gadobutrol, gadobenate dimeglumine, and gadoterate meglumine at equimolar dose.Invest Radiol. 2013 Mar;48(3):121-8. doi: 10.1097/RLI.0b013e31827752b4. Invest Radiol. 2013. PMID: 23211552 Free PMC article. Clinical Trial.
-
Gadoterate.2024 Dec 15. Drugs and Lactation Database (LactMed®) [Internet]. Bethesda (MD): National Institute of Child Health and Human Development; 2006–. 2024 Dec 15. Drugs and Lactation Database (LactMed®) [Internet]. Bethesda (MD): National Institute of Child Health and Human Development; 2006–. PMID: 29999679 Free Books & Documents. Review.
Cited by
-
Implementation and evaluation of a dynamic contrast-enhanced MR perfusion protocol for glioblastoma using a 0.35 T MRI-Linac system.Phys Med. 2024 Mar;119:103316. doi: 10.1016/j.ejmp.2024.103316. Epub 2024 Feb 9. Phys Med. 2024. PMID: 38340693 Free PMC article.
-
Comparison of gadobutrol and meglumine gadoterate for dynamic contrast-enhanced MRI of pituitary macroadenomas.Sci Rep. 2025 Jul 21;15(1):26419. doi: 10.1038/s41598-025-10702-x. Sci Rep. 2025. PMID: 40691479 Free PMC article. Clinical Trial.
-
Time optimization of gadobutrol-enhanced brain MRI for metastases and primary tumors using a dynamic contrast-enhanced imaging.BMC Med Imaging. 2022 Oct 17;22(1):180. doi: 10.1186/s12880-022-00909-z. BMC Med Imaging. 2022. PMID: 36253718 Free PMC article.
-
The TRUTH confirmed: validation of an intraindividual comparison of gadobutrol and gadoteridol for imaging of glioblastoma using quantitative enhancement analysis.Eur Radiol Exp. 2021 Oct 12;5(1):46. doi: 10.1186/s41747-021-00240-2. Eur Radiol Exp. 2021. PMID: 34635965 Free PMC article.
References
-
- Chung SR, Choi YJ, Kim HS, et al. . Tumor vascular permeability pattern is associated with complete response in immunocompetent patients with newly diagnosed primary central nervous system lymphoma: retrospective cohort study. Medicine (Baltimore) 2016;95:e2624 10.1097/MD.0000000000002624 - DOI - PMC - PubMed
Publication types
MeSH terms
Substances
LinkOut - more resources
Full Text Sources
Medical