. 2020 Nov 1;34(21-22):1520-1533.
doi: 10.1101/gad.340190.120. Epub 2020 Oct 15.

PRIM1 deficiency causes a distinctive primordial dwarfism syndrome

Collaborators, Affiliations

PRIM1 deficiency causes a distinctive primordial dwarfism syndrome

David A Parry et al. Genes Dev. .

Abstract

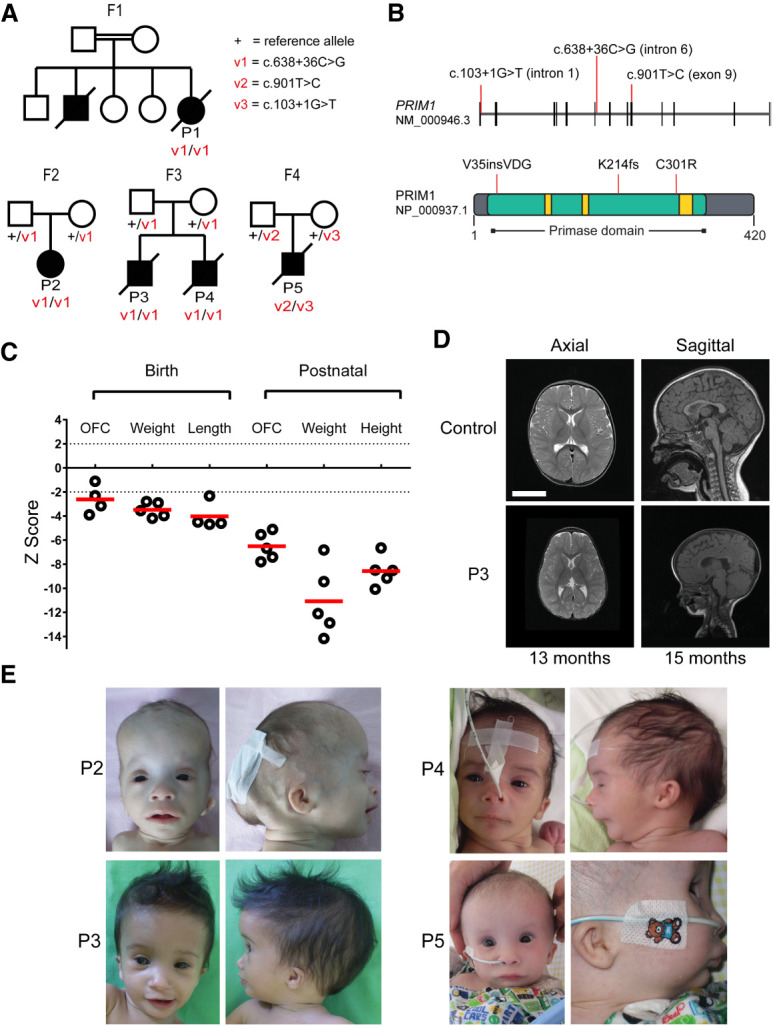
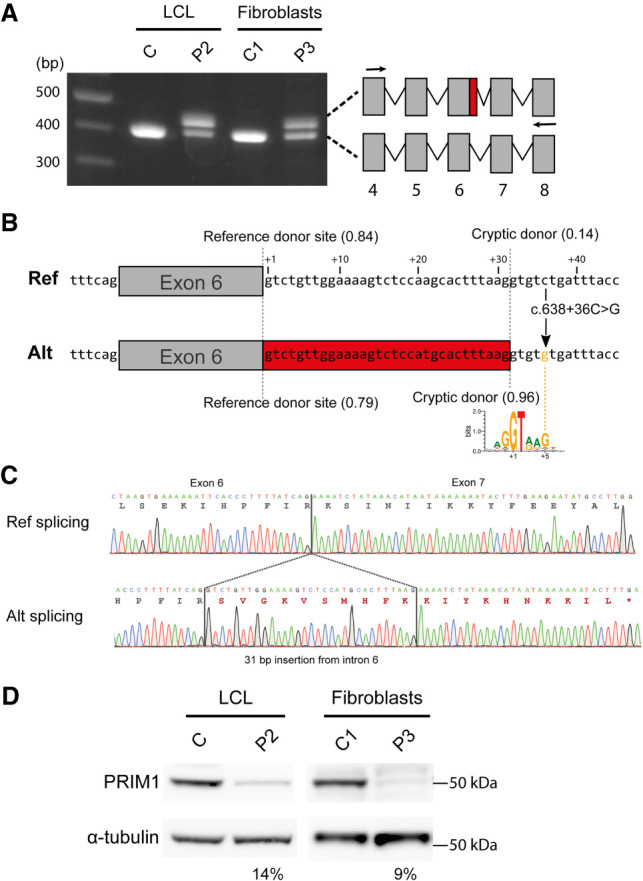
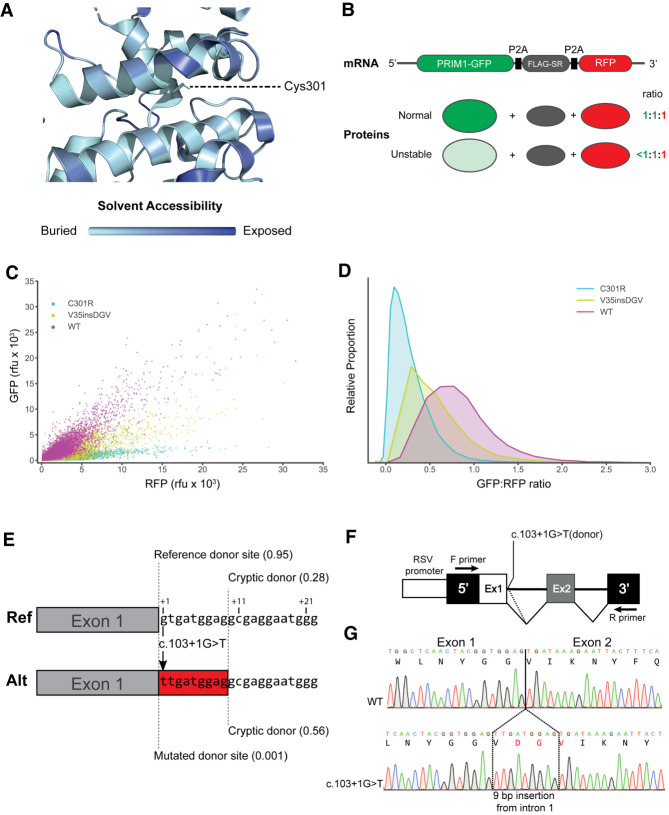
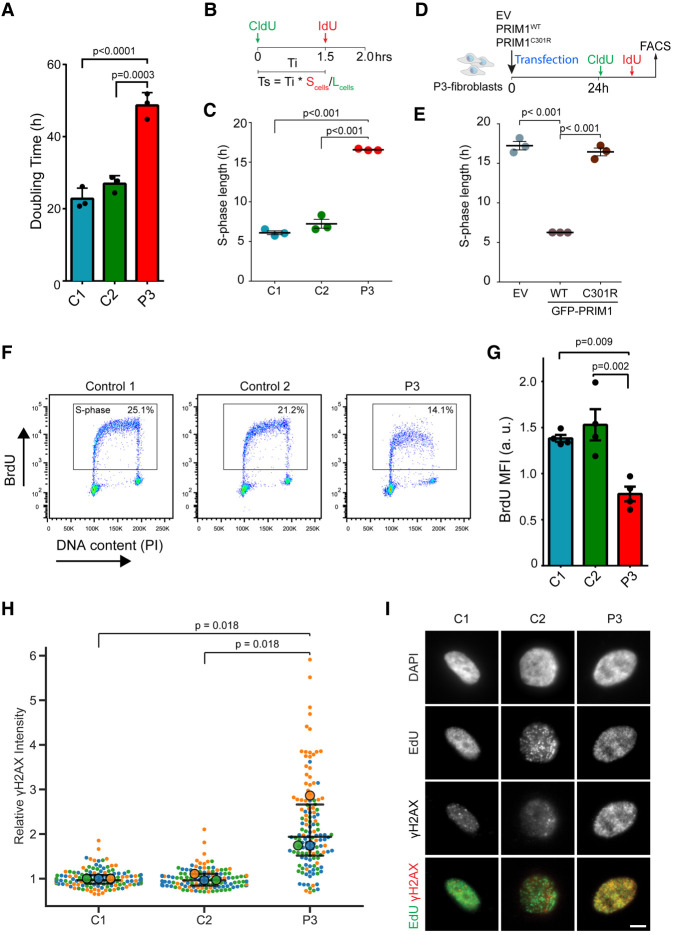
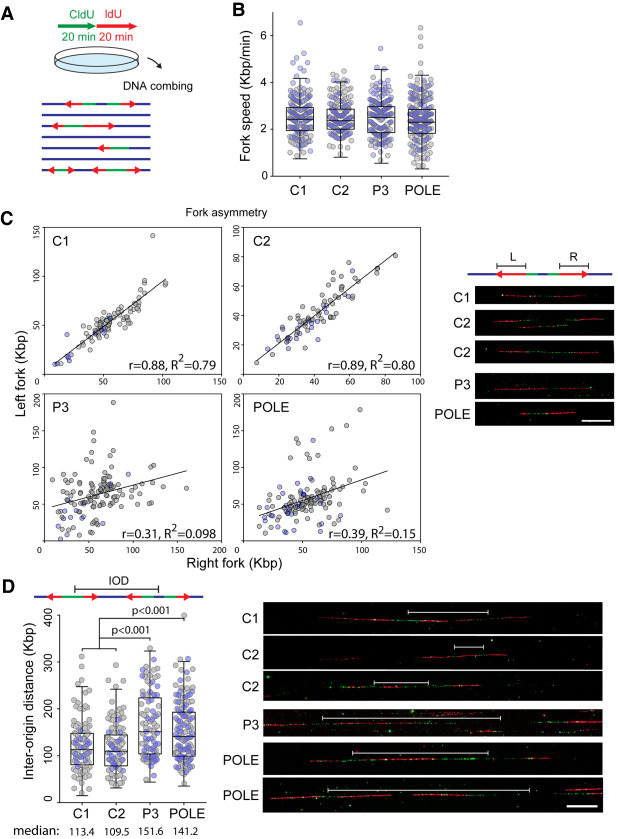
DNA replication is fundamental for cell proliferation in all organisms. Nonetheless, components of the replisome have been implicated in human disease, and here we report PRIM1 encoding the catalytic subunit of DNA primase as a novel disease gene. Using a variant classification agnostic approach, biallelic mutations in PRIM1 were identified in five individuals. PRIM1 protein levels were markedly reduced in patient cells, accompanied by replication fork asymmetry, increased interorigin distances, replication stress, and prolonged S-phase duration. Consequently, cell proliferation was markedly impaired, explaining the patients' extreme growth failure. Notably, phenotypic features distinct from those previously reported with DNA polymerase genes were evident, highlighting differing developmental requirements for this core replisome component that warrant future investigation.

Keywords: DNA replication; genome stability; growth disorders; human genetics; rare disease.


Figures

Figure 1.
Figure 1.
Individuals with biallelic PRIM1 variants have primordial dwarfism. (A) Family pedigrees with segregation of PRIM1 variants as indicated. (Square) male; (circle) female; (filled symbols) individuals with primordial dwarfism, (strike through) deceased. (B) Schematic of PRIM1 transcript and protein. (Vertical black lines) exons. Locations of variants are indicated by red lines. (Green) Primase domain (NCBI CDD cd04860), (yellow) nucleotide-binding residues. (C) Growth parameters of individuals with PRIM1 deficiency. Z scores (standard deviations from population mean for age and sex). Dashed lines indicate 95% confidence interval for general population. (Circles) individual subject data points, (red bars) mean values. (D) MRI neuroimaging of P3 demonstrates microcephaly with simplified gyri. Axial T2; Sagittal T1. Comparison with age-matched healthy controls. Scale bar, 5 cm. (E) Photographs of individuals P2–P5. (P2) 8 mo, (P3) 7 mo, (P4) newborn, (P5) 7 mo. Written consent was obtained from families for photography.
Figure 2.
Figure 2.
The c.638+36C>G variant creates a cryptic splice donor site, resulting in markedly reduced cellular PRIM1 protein levels. (A) The c.638+36C>G variant alters PRIM1 splicing by creating a cryptic splice donor site in intron 6. RT-PCR of PRIM1 transcripts from lymphoblastoid cells from P2 and primary fibroblasts from P3. Arrows in schematic indicate the position of primers. (Gray boxes) exons, (red box) retained sequence resulting from missplicing. (B) Schematic depicting the effect of the c.638+36C>G variant on splicing of intron 6 of PRIM1. The reference and alternate sequences of intron 6 shown with positions of reference and cryptic splice donor sites marked by dotted lines. SpliceAI scores for the donor sites are in brackets. Thirty-one nucleotides included as a result of the c.638 + 36C > G variant are shown on a red background. A sequence logo created with 100,000 randomly selected human U2 splice donor sites from Ensembl (v83) (Cunningham et al. 2015) using WebLogo (Crooks et al. 2004) illustrates how the c.638+36C>G substitution creates a strong splice consensus sequence by providing a G at the +5 position. (C) Representative Sanger sequencing traces of splice products relating, respectively, to the lower band in A (“ref splicing”) and the alternatively spliced upper band (“alt splicing”). (D) PRIM1 protein levels are markedly reduced in cells from individuals P2 and P3, homozygous for the c.638+36C>G variant. Immunoblots of total cell extracts from lymphoblastoid cells (P2) and primary fibroblasts (P3). α-tubulin, loading control. (C) lymphoblastoid, (C1) fibroblast cell lines from control subjects. Quantification of PRIM1 protein levels for P2 and P3 cells relative to C and C1 controls, respectively (normalized to α-tubulin loading control), is shown below each blot.
Figure 3.
Figure 3.
The c.103+1G>T and C301R variants reduce PRIM1 protein levels. (A) Cysteine 301, substituted to arginine in P5, lies in a buried hydrophobic region. DNA primase dimer crystal structure (PDB: 4BPU) with residues shaded according to solvent accessibility. (B) Schematic of the FACS-based dual-reporter stability assay. Expression vector expresses an mRNA encoding PRIM1-GFP-P2A-FLAG-SR-P2A-RFP. Intervening P2A “self-cleaving” peptide sequences produce PRIM1-EGFP, FLAG-SR, and RFP polypeptides in equimolar amounts. PRIM1-GFP (wild type and mutants) and RFP levels are assayed in individual cells by flow cytometry. PRIM1-GFP and FLAG-SR levels can be independently assessed by immunoblotting (see Supplemental Fig. S3D). (C) GFP-RFP scatter plot for wild-type, C301R, and V35insDGV dual reporter constructs. n = WT, 27,027; C301R, 44,863; V35insDGV 46,441 cells respectively. (rfu) Relative fluorescence units. (D) Kernel density estimation plot of GFP:RFP ratios from C. (E) Schematic depicting the consequence of the c.103+1G>T variant on splicing. Reference and alternate sequences of intron 1 are shown with positions of the reference and cryptic splice donor sites marked by dotted lines. SpliceAI scores for splice donor sites in brackets. (Red box) Nine nucleotides of intron 6 included as a result of activation of the cryptic splice donor variant. (F) Schematic assaying the effect of the c.103+1G>T variant. Minigene assay. DNA spanning exon 1 (Ex1) and exon 2 (Ex2) of PRIM1 was cloned into the minigene. (Arrows) Position of PCR primers, (dotted line) splicing from cryptic splice donor. (G) Representative cDNA Sanger sequence traces from wild-type (WT) and c.103+1G>T variant minigene constructs. The three-amino-acid (DGV) insertion from the c.103+1G>T variant marked in red.
Figure 4.
Figure 4.
Reduced cell proliferation and impaired DNA replication in PRIM1-deficient primary fibroblasts. (A) Cell doubling time plotted for three independent experiments on P3 and two unrelated control C1 and C2 primary fibroblast cell lines. Bars indicate the mean. Error bars indicate SD. (B) Schematic of CldU/IdU double-pulse experiment used to determine S-phase time. Cells were labeled with CldU at t = 0, followed by IdU after 1.5 h. Cells leaving S phase (Lcells) are labeled with CldU only, while cells remaining in S phase (Scells) are labeled with both CldU and IdU. (Ts) S-phase length, the product of interval between pulses (Ti) and the proportion of Scells to Lcells (Martynoga et al. 2005). (C) S-phase time is substantially increased in P3 fibroblasts compared with controls. Mean ± SEM, N = 3 experiments. (D) Schematic of rescue experiment. P3 fibroblast transfected with either empty vector (EV), wild-type (WT) or C301R-PRIM1-GFP as indicated and after 24 h S-phase time determined as in B for GFP + ve cells. (E) Complementation with WT PRIM1-GFP rescues slow S-phase progression in P3 fibroblasts. S-phase length plotted for n = 3 experiments. Mean ± SEM. (F) DNA content and BrdU flow cytometry scatter plots, representative of four independent experiments on control (C1 and C2) and P3 primary fibroblast cell lines. (G) BrdU incorporation is reduced in PRIM1-deficient cells during S-phase. Quantification of BrdU mean fluorescence intensity (MFI) from control and patient-derived fibroblasts according to S-phase gate in F. (a.u.) Arbitrary units. (H) γ-H2AX is increased in S-phase P3 fibroblasts. Mean γ-H2AX intensity calculated for EdU-positive nuclei from C1, C2, and P3 cells. n = 3 experiments. Data points are colored by experiment. (Filled circles) Mean values for each replicate, (bars) median and interquartile range (all values). Values were normalized for each experiment relative to C1 mean value. (P-values) Repeat measures ANOVA with Tukey multiple comparison test. (I) Representative immunofluorescence images of S-phase nuclei quantified in H. Scale bar, 5 µm. Statistics in A, C, E, and G are one-way ANOVA with Tukey multiple comparison test.
Figure 5.
Figure 5.
PRIM1 deficiency causes fork asymmetry and increased interorigin distances, consistent with replication fork stalling and decreased replication initiation. (A) Schematic depicting DNA combing experiments. Sequential 20 min CldU and IdU pulses were performed on cultured primary fibroblasts, which were then harvested, with DNA combing performed to characterize DNA replication at the single-molecule level. (B) DNA fork speed, kilobases per minute, in primary fibroblasts from two unrelated control individuals (C1 and C2), a PRIM1-deficient individual (P3), and a POLE-deficient individual. (BD) Gray and blue dots represent measurements from n = 2 respective independent experiments. (C) PRIM1-deficient cells exhibit fork asymmetry, similar to POLE-deficient cells. Left (L) versus right (R) fork ratio scatter plots. (r) Pearson correlation coefficient. (Right) Representative images of bidirectional forks. Scale bar, 20 µm. (D) Interorigin distance (IOD) in control, PRIM1-deficient, and POLE-deficient primary fibroblasts; box plots were graphed according to Tukey method (B,D). P-values, Kruskal–Wallis test. (Right) Representative images of IODs. Scale bar, 20 µm.

References

    1. Bellelli R, Borel V, Logan C, Svendsen J, Cox DE, Nye E, Metcalfe K, O'Connell SM, Stamp G, Flynn HR, et al. 2018. Polɛ instability drives replication stress, abnormal development, and tumorigenesis. Mol Cell 70: 707–721.e7. 10.1016/j.molcel.2018.04.008 - DOI - PMC - PubMed
    1. Bicknell LS, Bongers EMHF, Leitch A, Brown S, Schoots J, Harley ME, Aftimos S, Al-Aama JY, Bober M, Brown PAJ, et al. 2011a. Mutations in the pre-replication complex cause Meier-Gorlin syndrome. Nat Genet 43: 356–359. 10.1038/ng.775 - DOI - PMC - PubMed
    1. Bicknell LS, Walker S, Klingseisen A, Stiff T, Leitch A, Kerzendorfer C, Martin C-A, Yeyati P, Al Sanna N, Bober M, et al. 2011b. Mutations in ORC1, encoding the largest subunit of the origin recognition complex, cause microcephalic primordial dwarfism resembling Meier-Gorlin syndrome. Nat Genet 43: 350–355. 10.1038/ng.776 - DOI - PubMed
    1. Blake JA, Bult CJ, Kadin JA, Richardson JE, Eppig JT. 2011. The Mouse Genome Database (MGD): premier model organism resource for mammalian genomics and genetics. Nucleic Acids Res 39: D842–D848. 10.1093/nar/gkq1008 - DOI - PMC - PubMed
    1. Burrage LC, Charng WL, Eldomery MK, Willer JR, Davis EE, Lugtenberg D, Zhu W, Leduc MS, Akdemir ZC, Azamian M, et al. 2015. De novo GMNN mutations cause autosomal-dominant primordial dwarfism associated with Meier-Gorlin syndrome. Am J Hum Genet 97: 904–913. 10.1016/j.ajhg.2015.11.006 - DOI - PMC - PubMed

Publication types