. 2020 Nov 1;34(21-22):1439-1451.
doi: 10.1101/gad.343186.120. Epub 2020 Oct 15.

p53 directly represses human LINE1 transposons

Affiliations

p53 directly represses human LINE1 transposons

Bhavana Tiwari et al. Genes Dev. .

Abstract

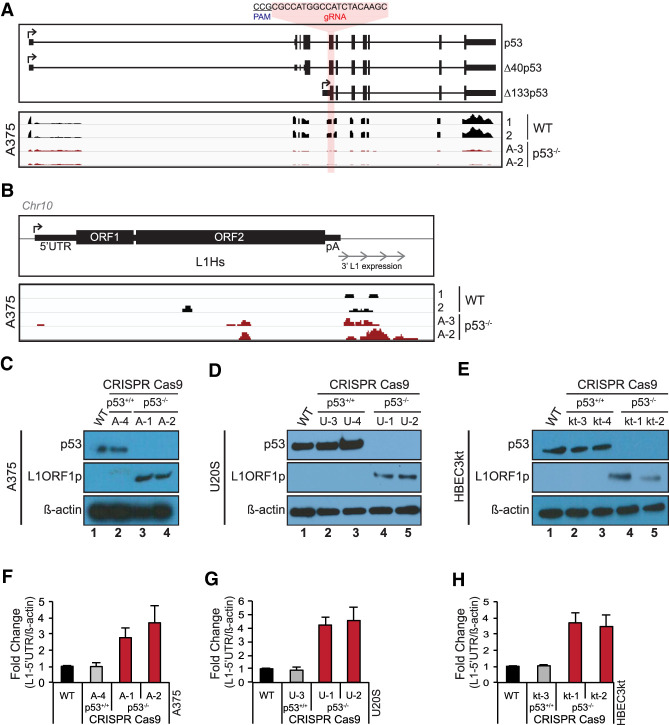
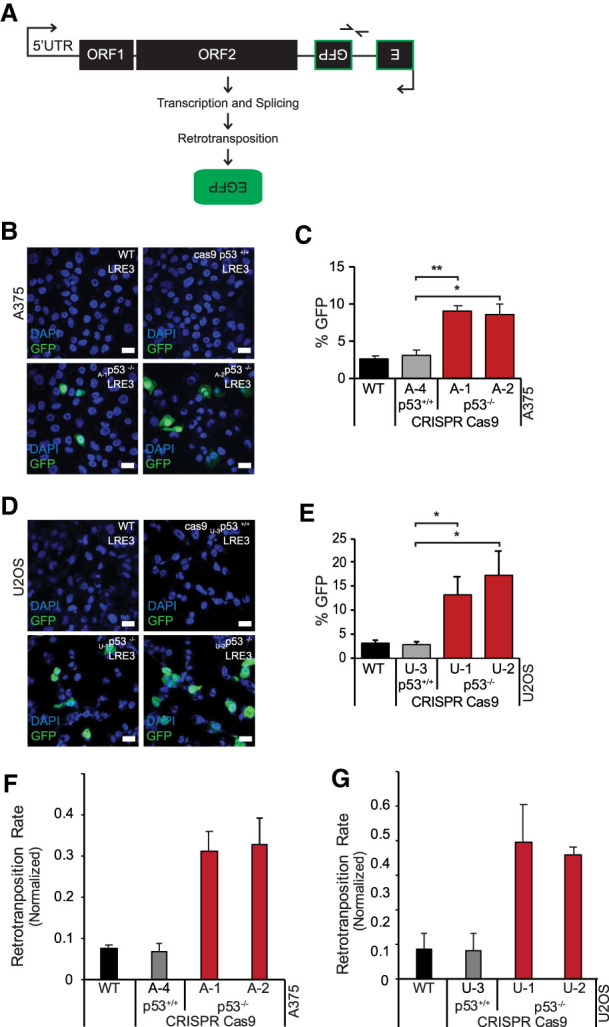
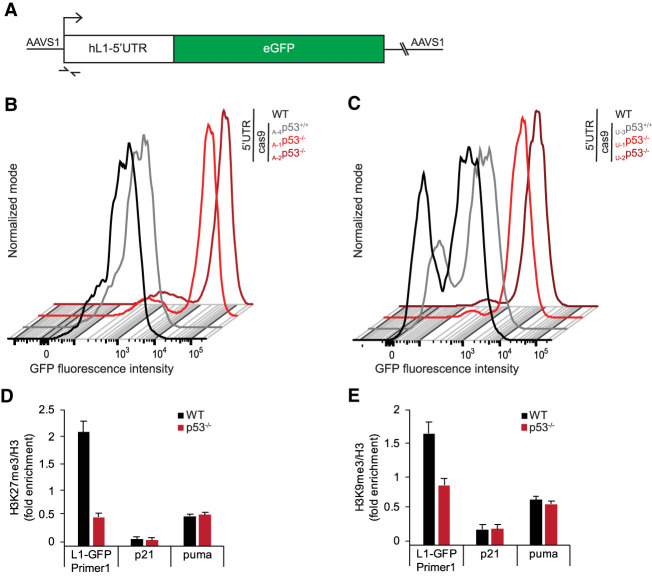
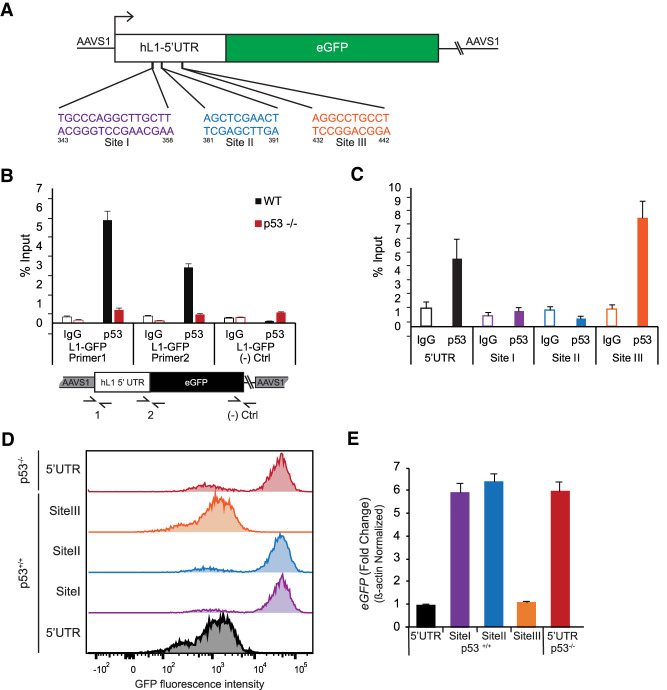
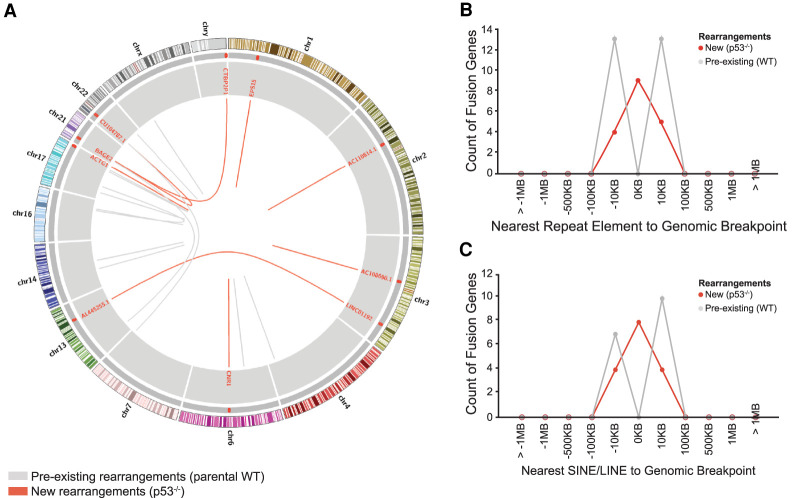
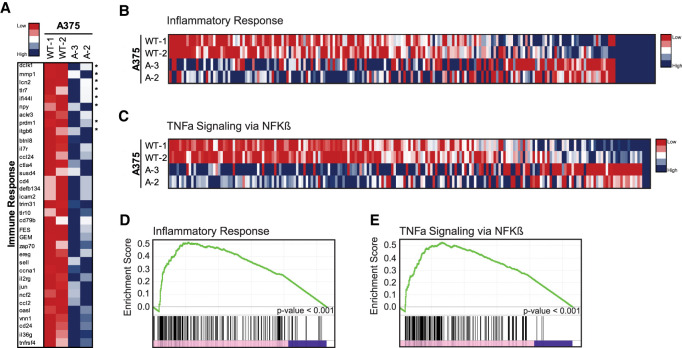
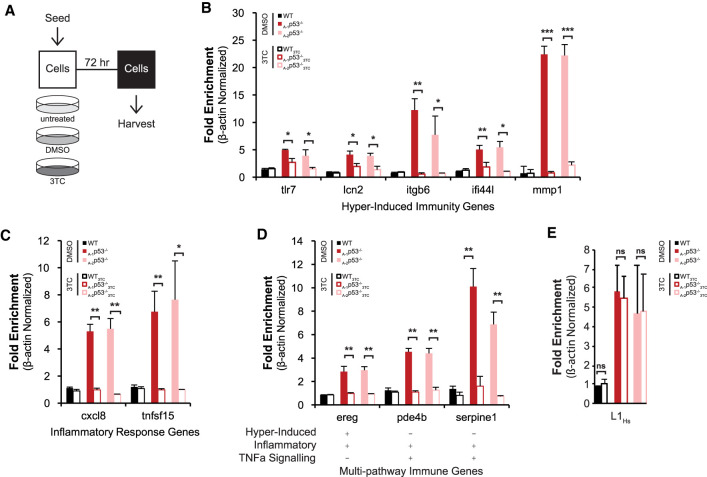
p53 is a potent tumor suppressor and commonly mutated in human cancers. Recently, we demonstrated that p53 genes act to restrict retrotransposons in germline tissues of flies and fish but whether this activity is conserved in somatic human cells is not known. Here we show that p53 constitutively restrains human LINE1s by cooperatively engaging sites in the 5'UTR and stimulating local deposition of repressive histone marks at these transposons. Consistent with this, the elimination of p53 or the removal of corresponding binding sites in LINE1s, prompted these retroelements to become hyperactive. Concurrently, p53 loss instigated chromosomal rearrangements linked to LINE sequences and also provoked inflammatory programs that were dependent on reverse transcriptase produced from LINE1s. Taken together, our observations establish that p53 continuously operates at the LINE1 promoter to restrict autonomous copies of these mobile elements in human cells. Our results further suggest that constitutive restriction of these retroelements may help to explain tumor suppression encoded by p53, since erupting LINE1s produced acute oncogenic threats when p53 was absent.

Keywords: LINE1; p53; transrepression; tumor suppressors.


Figures

Figure 1.
Figure 1.
p53 loss provokes human L1 expression. The p53 gene was mutated using a CRISPR guide RNA targeting the first common exon found in all annotated p53 isoforms, as illustrated in the top panel of A. In A and B, two independently edited p53−/− lines, designated A-3 and A-2, were analyzed. In C and F, independently edited p53−/− lines A-1 and A-2 were analyzed. In the bottom panel of A, normalized RNA sequencing expression levels from wild-type (WT; black) and p53−/− A375 cells (red) are shown. (B) Normalized expression of readthrough transcription from a single, uniquely identifiable L1Hs element in wild-type and p53−/− A375 cells. Western blot in WT, cas9-treated control and p53−/− A375 human melanoma (C), U2OS osteosarcoma (D), and HBEC3kt immortalized normal human lung (E) cells lines for p53 (top panels) and L1ORF1p (middle panels). (Bottom panels) β-Actin is presented as a loading control. Normalized L1-5′UTR mRNA levels in WT, cas9-treated control and two independent p53−/− A375 (F), U2OS (G), and HBEC3kt (H) cell lines assessed by ddPCR. L1-5′UTR transcript levels were normalized to β-actin and relative fold change was calculated with respect to parental wild type. Bar graphs are the average of three independent experiments (n = 3) with error bars representing the standard deviation. p53−/− samples were significantly different from parental wild type (two-tailed t-test P-value < 0.05) and cas9-treated controls (P-value < 0.05).
Figure 2.
Figure 2.
p53 loss is permissive for human L1 de novo retrotransposition. (A) Schematic depiction of the 99-gfp-LRE3 retrotransposition indicator. eGFP fluorescence indicates a complete retrotransposition cycle. Representative confocal images (obtained at 63×; scale bars, 20 μm) of GFP fluorescence in stable wild-type, cas9-treated control, and p53−/− A375 (B) and U2OS (D) 99-gfp-LRE3 integrant cell populations counterstained with DAPI. Quantification (n = 3) of the percentage of GFP-positive cells by flow cytometry for A375 (C) and U2OS (E) cells, error bars represent the standard error of the mean. (*) P-value ≤ 0.05, (**) P-value < 0.005. Droplet digital PCR (ddPCR) quantification (n = 2) of de novo LINE1 integration events in A375 (F) and U2OS (G) cells, normalized to single-copy gene puma abundance. Primer pair 2 (barbed arrows shown in A) specifically detects spliced GFP (indicating a complete retrotransposition life cycle) in genomic DNA. Bar graphs are averages of two biological replicates and error bars are the standard deviation.
Figure 3.
Figure 3.
p53-mediated suppression of LINE1s operates at the level of transcription through the 5′UTR. (A) The integrated L1 reporter construct, L1-5′UTR-eGFP, is detectable with primers indicated (barbed arrows). Flow cytometry of GFP in WT, cas9-treated control, and p53−/− A375 (B) or U2OS (C) cells containing the L1-5′UTR-eGFP exposes bright GFP-positive subpopulations in p53−/− cells (see Supplemental Tables S2, S3 for gating parameters). Additional biological replicates are shown in Supplemental Tables S2 and S3; for unstained controls, see Supplemental Figure S3, F and G. ChIP results (D,E) showing H3 normalized H3K27me3 (D) and H3K9me3 (E) ratios at the L1-5′UTR, p21, and puma in wild-type (black) and p53−/− (red) cells. Note that changes in H3K27me3 and H3K9me enrichment are specific to the 5′ UTR of the L1-5′UTR-eGFP and p53 dependent. Error bars represent 95% confidence intervals.
Figure 4.
Figure 4.
p53 physically binds to repress the L1-5′UTR The schematic in A shows empirically and computationally defined p53 binding sites in the 5′UTR of L1-5′UTR-eGFP. Note that site I, site II, and site III were independently targeted for deletion. (B) ChIP for p53 and control IgG performed with illustrated primer pairs (1 and 2) that uniquely detect binding at the L1 reporter. Note the absence of signal in p53−/− cells and at the L1-GFP negative control region spanning vector-derived sequences (Ctrl primer pair). Error bars represent 95% confidence intervals. (C) ChIP testing of p53-binding site deletions indicated in A along with the intact wild-type 5′UTR interval. Note, site I and site II contribute to p53 binding, but site III had no effect. Error bars represent 95% confidence intervals. In D, flow cytometry was used to detect for GFP intensities in the intact and mutant L1-5′UTR-eGFP reporters in A375 cells. Note that sites I and site II are required for p53 repression of the L1 expression reporter (see Supplemental Fig. S4L for another biological replicate). (E) Shows that corresponding eGFP mRNA transcript levels mirror GFP intensities seen in these same cells. Bar graphs are averages of three biological replicates. Error bars represent standard error of the mean.
Figure 5.
Figure 5.
De novo rearrangements detected after p53 loss are associated with retroelements. (A) Circos plot of genomic rearrangements in A375 cells. Genomic rearrangements emerging after p53 loss are indicated (red lines) along with pre-existing rearrangements in the parental A375 cell line (gray lines). Repeat element proximity is indicated by red tiles (outer gray ring) along with annotations for rearrangement junctions (inner gray ring). (B) Genomic rearrangements occur at repeat elements in p53 knockout (n = 9 of 18 breakpoints) but not wild-type (n = 0 of 26 breakpoints) cells. (C) p53 knockout associated genomic rearrangements are commonly associated with LINE and SINE (n = 8 of 18 breakpoints), but not LTR or DNA repeat elements (n = 1 of 18 breakpoints).
Figure 6.
Figure 6.
Immunity associated gene expression programs are induced upon p53 loss. RNA sequencing data sets from two wild-type (WT-1 and WT-2) and two p53 knockout (A-2 and A-3) A375 cell lines were analyzed. The heat map in A displays genes more than fourfold induced in p53 nulls compared with WT controls. Heat maps in B and C similarly represent inflammatory response (B) and TNFα signaling (C) GSEA gene sets, as indicated. Gene set enrichment plots show highly significant enrichments scores for the inflammatory response (D) and TNFα signaling (E) gene sets in p53 knockout A375 cell lines (P < 0.001).
Figure 7.
Figure 7.
A LINE1 antagonist, 3TC, prevents the inflammatory program triggered by p53 loss (A) Schematic of the experimental workflow. Expression of selected immunity (B) and inflammation response (C) genes was quantified using RT-ddPCR. Likewise, targets with overlapping immune pathway designations (D) and 5′ intact L1Hs (E) were similarly analyzed by RT-ddPCR. Wild-type and two p53 knockout lines treated in parallel with vehicle, DMSO, only (filled bars) or 3TC (open bars). Transcript levels were normalized to β-actin and their fold change was calculated relative to their wild-type values (see Supplemental Fig. S6). For BD, bar graphs plot the average of three biological replicates and error bars represent SEM. For Figure E, bar graphs represent the average of three biological replicates and error bars indicate the standard deviation. Two tailed t-tests were performed for all samples. (*) P-value < 0.05, (**) P-value < 0.005, (***) P-value < 0.0005, (ns) not significant. Note that treatment with the reverse transcriptase inhibitor, 3TC, prevented induction of immune and inflammatory gene sets but did not impact L1Hs RNAs.

References

    1. Alexandrova EA, Olovnikov IA, Malakhova GV, Zabolotneva AA, Suntsova MV, Dmitriev SE, Buzdin AA. 2012. Sense transcripts originated from an internal part of the human retrotransposon LINE-1 5′ UTR. Gene 511: 46–53. 10.1016/j.gene.2012.09.026 - DOI - PubMed
    1. Anders S, Pyl PT, Huber W. 2015. HTSeq–a Python framework to work with high-throughput sequencing data. Bioinformatics 31: 166–169. 10.1093/bioinformatics/btu638 - DOI - PMC - PubMed
    1. Babaian A, Thompson IR, Lever J, Gagnier L, Karimi MM, Mager DL. 2019. LIONS: analysis suite for detecting and quantifying transposable element initiated transcription from RNA-seq. Bioinformatics 35: 3839–3841. 10.1093/bioinformatics/btz130 - DOI - PubMed
    1. Bannister AJ, Kouzarides T. 2011. Regulation of chromatin by histone modifications. Cell Res 21: 381–395. 10.1038/cr.2011.22 - DOI - PMC - PubMed
    1. Banuelos-Sanchez G, Sanchez L, Benitez-Guijarro M, Sanchez-Carnerero V, Salvador-Palomeque C, Tristan-Ramos P, Benkaddour-Boumzaouad M, Morell S, Garcia-Puche JL, Heras SR, et al. 2019. Synthesis and characterization of specific reverse transcriptase inhibitors for mammalian LINE-1 retrotransposons. Cell Chem Biol 26: 1095–1109.e14. 10.1016/j.chembiol.2019.04.010 - DOI - PubMed

Publication types

MeSH terms