. 2020 Nov 4;40(45):8652-8668.
doi: 10.1523/JNEUROSCI.1636-20.2020. Epub 2020 Oct 15.

The γ-Protocadherins Regulate the Survival of GABAergic Interneurons during Developmental Cell Death

Affiliations

The γ-Protocadherins Regulate the Survival of GABAergic Interneurons during Developmental Cell Death

Candace H Carriere et al. J Neurosci. .

Abstract

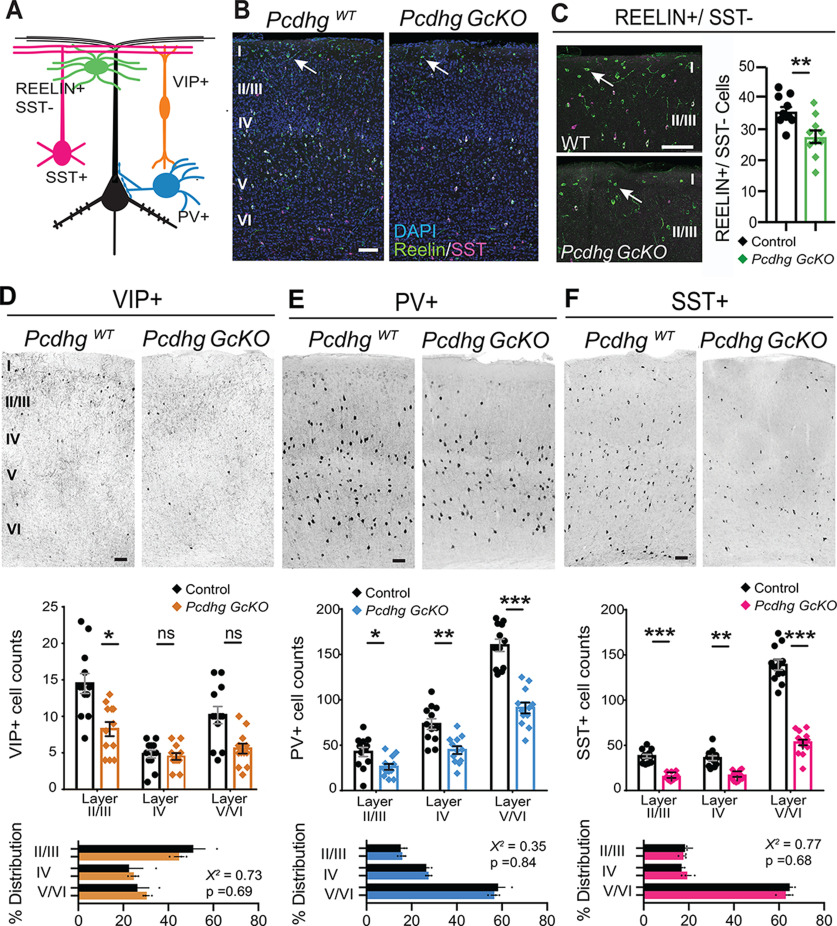
Inhibitory interneurons integrate into developing circuits in specific ratios and distributions. In the neocortex, inhibitory network formation occurs concurrently with the apoptotic elimination of a third of GABAergic interneurons. The cell surface molecules that select interneurons to survive or die are unknown. Here, we report that members of the clustered Protocadherins (cPCDHs) control GABAergic interneuron survival during developmentally-regulated cell death. Conditional deletion of the gene cluster encoding the γ-Protocadherins (Pcdhgs) from developing GABAergic neurons in mice of either sex causes a severe loss of inhibitory populations in multiple brain regions and results in neurologic deficits such as seizures. By focusing on the neocortex and the cerebellar cortex, we demonstrate that reductions of inhibitory interneurons result from elevated apoptosis during the critical postnatal period of programmed cell death (PCD). By contrast, cortical interneuron (cIN) populations are not affected by removal of Pcdhgs from pyramidal neurons or glial cells. Interneuron loss correlates with reduced AKT signaling in Pcdhg mutant interneurons, and is rescued by genetic blockade of the pro-apoptotic factor BAX. Together, these findings identify the PCDHGs as pro-survival transmembrane proteins that select inhibitory interneurons for survival and modulate the extent of PCD. We propose that the PCDHGs contribute to the formation of balanced inhibitory networks by controlling the size of GABAergic interneuron populations in the developing brain.SIGNIFICANCE STATEMENT A pivotal step for establishing appropriate excitatory-inhibitory ratios is adjustment of neuronal populations by cell death. In the mouse neocortex, a third of GABAergic interneurons are eliminated by BAX-dependent apoptosis during the first postnatal week. Interneuron cell death is modulated by neural activity and pro-survival pathways but the cell-surface molecules that select interneurons for survival or death are unknown. We demonstrate that members of the cadherin superfamily, the clustered γ-Protocadherins (PCDHGs), regulate the survival of inhibitory interneurons and the balance of cell death. Deletion of the Pcdhgs in mice causes inhibitory interneuron loss in the cortex and cerebellum, and leads to motor deficits and seizures. Our findings provide a molecular basis for controlling inhibitory interneuron population size during circuit formation.

Keywords: GABAergic interneuron; Protocadherins; apoptosis; cortical development; inhibitory neurons; programmed cell death.


Figures

Figure 1.
Figure 1.
Mice with pan-GABAergic deletion of Pcdhgs exhibit neurologic deficits and seizures. A, Schematic of the LoxP-targeted Pcdhg locus, Pcdhgfcon3. Distinct PCDHG isoforms are assembled by splicing one of 22 variable exons, encoding the extracellular and transmembrane (TM) regions unique to each isoform, to three constant exons encoding the intracellular constant region (ICR) shared by all 22 PCDHGs. B, Weights of control PcdhgWT; Gad2-Cre (black) and Pcdhgf/f; Gad2-Cre (herein referred to Pcdhg GcKO, red) mice; Data points show mean ± SEM *p < 0.05, ***p < 0.001. C, left, P28 WT sibling. Right, Pcdhg GcKO mutant displays forelimb and hindlimb clasping. D, Total time immobile of four Pcdhg GcKO mice recorded by EEG and video during 25-min sessions (left, percent time immobile) was analyzed and categorized as seizure events according to the Racine scale, and reported as percent length and events. E, Examples of EEG waveforms of cortical baseline activities recorded with bipolar electrodes in WT and Pcdhg GcKO mice (N = 4 per genotype).
Figure 2.
Figure 2.
Pcdhg GcKO mutants have reduced brain volumes and PV-expressing populations. A, MRI quantification of absolute brain volumes of PcdhgWT (control, black) and Pcdhg GcKO (red) mutants at P28. Data show mean volume ± SEM from 12 animals per genotype; p < 0.00001, unpaired Student's t test. B, Coronal examples of whole-brain MRI data highlight regional reductions in Pcdhg GcKO brains, expressed as percent reduction from control brains. Regions coded in blue are significantly reduced in volume compared with the mean whole-brain reduction (−20.4%) and those coded in red-yellow are less severely affected, with significance exceeding FDR threshold at p = 0.05. C, Volumes of selected regions of control (black) and Pcdhg GcKO (red) brains. D, MRI volume changes are negatively correlated with spatial E18.5 Gad2 mRNA expression obtained from the Allen Brain Institute Developing Mouse Brain ISH dataset (t statistic = −4.10, p = 0.000144). Each point corresponds to a segmented brain structure, and plotted for volume changes computed from MRI measurements and spatial Gad2 gene expression. E, left, Quantifications of PV-expressing (PV+) cells in the Pcdhg GcKO GP (p = 0.0087), BLA (p = 0.0042), somatosensory cortex SIBF Layer IV (p = 0.011), V1 Layer IV (p = 0.016), and Gad2-Cre; Ai14-TdTomato-labeled neurons in SIBF Layer IV (p = 0.00002; all three to four animals per genotype). Right, Quantifications of PV+ MLIs (p < 0.00001) and Purkinje cells (PCs; p = 0.08) at P25 (five to seven animals per genotype) and at P75 (three animals per genotype). Bars show means from Pcdhg GcKO mice normalized as percentage from control counts, with % SEM, unpaired t test. F, G, Inverted immunofluorescence images of PV-expressing (PV+) cells in GP (F) and visual cortex (G) in control and Pcdhg GcKO mice. H, left, Immunostaining of PV+ MLIs (green) and PV+/calbindin+ PCs in cerebellar cortex. Right, Soma labeling by NeuroTrace. MLI density (white arrow) is reduced but PC density is unchanged (yellow arrow) in Pcdhg GcKO cerebella. *p < 0.05, **p < 0.01, ***p < 0.001. Scale bars: 500 μm (F), 200 μm (G), and 25 μm (H).
Figure 3.
Figure 3.
Cardinal classes of cortical GABAergic interneurons are reduced in Pcdhg GcKO mutants. A, Schematic depicting cortical pyramidal neuron (black) and markers used to distinguish four interneuron (cIN) types. B–F, Coronal sections through somatosensory cortex (SSC; SIBF) and quantifications of cIN types at P28 of PcdhgWT and Pcdhg GcKO animals. Scatter bar plots summarize data, mean ± SEM from 12 sections, three animals per genotype. B, Immunostaining for Reelin (green) and SST (magenta) marks Reelin+/SST– population residing in Layer I (white arrow). C, Labeling and quantification of Reelin+/SST– cINs in defined area from Layers I–III; p = 0.0073 Mann–Whitney (MW) U test. D, Inverted immunofluorescence image (top), quantifications of immunolabeled cells (middle), and layer-specific distribution as a percentage of the total population (bottom). VIP-expressing cINs. Layers II–III: p = 0.016; IV: p = 0.99; V–VI: p = 0.30, two-way ANOVA with Sidak's multiple comparisons. χ2 of layer distribution, p = 0.69. E, PV-expressing cINs. Layers II–III: p = 0.028; IV: p = 0.0029; V–VI: p = 0.000026, two-way ANOVA with Sidak's multiple comparisons. χ2, p = 0.84. F, SST-expressing cINs. Layers II–III: p = 0.00025; IV: p = 0.0017; V–VI: p < 0.00001, two-way ANOVA with Sidak's multiple comparisons. χ2, p = 0.68; *p < 0.05, **p < 0.01, ***p < 0.001. Scale bars: 100 μm.
Figure 4.
Figure 4.
Deletion of the Pcdhgs does not affect cIN migration or intrinsic membrane properties. A, Coronal sections of E14.5 embryonic PcdhgWT or Het and Pcdhg f/f Gad2-Cre; Ai14-TdTomato brains. Top, TdTomato+ Cre reporter labeling (red) confirms Gad2-Cre recombination in the subventricular and mantle zones in the ganglionic eminence, presumptive striatum, and along the interneuron migratory stream. Bottom, Insets from top panels show migratory streams of cINs. MZ, marginal zone. CP, cortical plate. IZ, intermediate zone. SVZ, subventrical zone. B, Quantifications of TdTomato+ migratory interneurons in boxed ROIs, as shown in A. Scatter bar plots summarize data from three animals per genotype, mean ± SEM p = 0.67, unpaired t test. C, Representative traces show the voltage responses of TdTomato+ Layer V interneurons in the visual cortex (cIN) in PcdhgWT or Het and Pcdhg GcKO; Ai14-TdTomato mice (upper traces) following current injection (lower traces). All experiments were performed in slices prepared from P13–P15 mice and in the presence of AMPA-receptor, NMDA-receptor, and GABAa-receptor blockers (AP-5, 50 μm, NBQX, 10 μm, picrotoxin, 100 μm, respectively). D, Summary plots of the Vrest (left panel, Vrest: control, n = 14 cells/8 animals; Pcdhg GcKO, n = 15 cells/10 animals; p = 0.8412, df = 27, unpaired t test); Rin (middle panel, Rin: control, n = 15 cells/8 animals; Pcdhg GcKO, n = 16 cells/10 animals; p = 0.9709, df = 29, unpaired t test,); and action potential firing frequencies, showing no significant differences between the control and Pcdhg GcKO mice (right panel, AP firing: control, n = 15 cells/8 animals; Pcdhg GcKO, n = 16 cells/10 animals; +50–500 pA current steps, p = 0.7405–0.8609; Mann–Whitney test). Data summarize mean ± SEM. Scale bar: 200 μm.
Figure 5.
Figure 5.
cIN loss in Pcdhg GcKO mutants is the result of accentuated developmental cell death. A, FISH of Gad1 mRNA (magenta) and Pcdhg mRNA encoding constant exons common to all Pcdhg isoforms (green) in P7 SSC cortex. Right, Inset shows Pcdhg expression in Gad1+ (arrow) and in Gad1- cells (arrowhead). B, Quantification of cIN density in somatosensory cortex (SSC) through development in PcdhgWT or Het control (gray) and Pcdhg GcKO (red). cINs are marked by Gad2-Cre; Ai14-TdTomato. Box plots (with minimum and maximum values) show data from 12 sections, three animals per genotype. P2, p = 0.028; P5, p = 0.66; P8, p < 0.00001; P10, p = 0.0003; P14, p < 0.00001, Mann–Whitney U test. C, Coronal section of control and Pcdhg GcKO SSC at P2 and P10 with labeling of nuclei (DAPI, cyan) and TdTomato+ cINs (red). Inverted fluorescent images of TdTomato+ cINs are on right. D, Graphs show data of TdTomato+ cIN densities from B, normalized to densities at P2 for control (black) and Pcdhg GcKO (red). P2, p > 0.99; P5, p = 0.096; P8, p = 0.001; P10, p = 0.0027; P14, p = 0.00097, Mann–Whitney U test. E, top, Apoptotic TdTomato+ cINs (red) co-labeled with cleaved Caspase-3 and Caspase-9 (CC3/9 green; white arrows). Bottom, Quantifications of TdTomato/CC3/9+ cells in P7 cortical sections. Box plots show data from 31 sections, three animals per genotype; p = 0.00095, Mann–Whitney U test. F, top left, Onset of PV-Cre activity occurs after the peak of cIN PCD. Bottom left, PV+ densities in SSC at P28 are indistinguishable between control (gray bars) and Pcdhg f/f; PV-Cre animals (white). Bars show mean ± SEM from three animals per genotype. p = 0.46, unpaired t test. Right, Coronal sections with PV+ labeling of SSC of control and Pcdhg f/f; PV-Cre animals; *p < 0.05, **p < 0.01, ***p < 0.001. Scale bars: 50 μm (A), 100 μm (C–E), and 200 μm (F).
Figure 6.
Figure 6.
Genetic blockade of apoptosis by Bax deletion rescues cIN loss in Pcdhg GcKO mutants. A, Immunostaining for PV+ (magenta) and Reelin+ (green) cINs in S1BF of P28 Pcdhg control Gad2-Cre; Bax+ (WT or Het), Pcdhg control Gad2-Cre;Baxf/f; Pcdhg f/f;Gad2-Cre; Bax+ mutant; and Pcdhg f/f;Gad2-Cre;Bax f/f double mutant animals. Inverted images of PV+ in center, and Reelin+ on right. Reelin labels CGE-derived Reelin+/SST– in LI–III, and MGE-derived cINs that overlap with SST+ in LII–LVI. B, Quantifications of total PV+ and Reelin+ cINs across layers, and Reelin+/SST– in LI–III. Scatter bar plots show data, mean ± SEM, from three to four three to four animals per genotype. One-way ANOVA, PV+: F = 24.8 p = 0.00002. Reelin+: F = 30.5 p < 0.00001. Reelin+/SST–: F = 30.9 p = 0.00002 Holm–Sidak's pairwise comparisons: Pcdhg+;Gad2-Cre;Bax+ versus Pcdhg+;Gad2-Cre;Baxf/f: PV+ p = 0.018; Reelin+ p = 0.0059; LI–III R+/SST– p = 0.0019. Pcdhg f/f;Gad2-Cre; Bax+ versus Pcdhg f/f;Gad2-Cre;Bax f/f: PV+ p = 0.00004; Reelin+, p = 0.00002; LI–III R+/SST– p = 0.00007. Pcdhg+;Gad2-Cre;Baxf/f versus Pcdhg f/f;Gad2-Cre;Bax f/f: PV+ p = 0.52; Reelin+ p = 0.47; LI–III R+/SST– p = 0.67, *p <0.05, **p < 0.01, ***p < 0.001. Scale bars: 200 μm.
Figure 7.
Figure 7.
Akt-FoxO3A signaling is diminished in Pcdhg GcKO mutants. A, Schematic of experimental design for FACS-immunoblot (data in B) and flow cytometry analysis (data in C) of pAKT signals in cINs dissociated from P7 cortices. B, Immunoblots of AKT (top) and pAKT-Ser473 (middle; bottom, overexposure) following AKT-mediated immunoprecipitation of FACS-sorted Gad2-Cre; TdTomato+ cortical cells isolated from P7 PcdhgHet and Pcdhg GcKO brains. Positive control is a validated sample. Two animals per genotype. Equal numbers of TdTomato+ cells from FACS were assayed. Sup, supernatant. C, Cytometric measure of pAKT-immunolabeled Tdtomato+ cortical cells isolated from Pcdhg GcKO (red) and heterozygous Pcdhg control (blue). Left, pAKT+ (530-A) versus TdTom+ (575-A) events from GcKO and Het samples. Black box = pAKT+ event gate; black dots = isotype control. Middle, Distribution of pAKT+ events TdTom+ population; black line = pAKT+ event gate. Mean TdTom+ events: 9949.6 ± 310.4, Het = 10 115 ± 368.7; p = 0.75. Mean pAKT+ events: GcKO = 6502 ± 138, Het = 9650.3 ± 321; p = 0.0008, from three independent experiments. Right, pAKT+ events plotted as percentage of TdTom+ cell population. p = 0.0046, unpaired t test; six brains per genotype. D, Schematic of AKT-dependent inhibition of FoxO3A translocation from cytoplasmic (top) to nuclear (bottom) compartments. E, Immunostaining of P7 cortex shows translocation of FoxO3A (green) in Gad2Cre-TdTomato+ cINs (red) from a predominantly cytoplasmic localization in control (top, yellow arrowheads) to nuclear enrichment in Pcdhg GcKO mutants (bottom, yellow arrows). Right, High magnification of inset. F, Cumulative distribution plot of nuclear to cytoplasmic ratios of FoxO3A fluorescence intensities quantified in control (black) and Pcdhg GcKO (red) TdTomato+ cINs across Layers II–VI. N = 3 animals per genotype, p < 0.00001, KS test; **p < 0.01, ***p < 0.001. Scale bar: 25 μm.
Figure 8.
Figure 8.
cIN survival does not require the Pcdhgs in other cortical populations. A–E, Test for Pcdhgs in pyramidal population: Emx1-Cre deletes Pcdhgs from pyramidal and glial cells, leaving the Pcdhgs intact in cINs. B, Inverted fluorescent image of PV+ cINs in control and Pcdhg f/f;Emx1-Cre mutants at P28. C, Quantifications show that PV+ (p = 0.89, unpaired t test) and SST+ cINs (p = 0.29) are not significantly different (ns) in Pcdhg f/f;Emx1-Cre mutants compared with control. D, Inverted image of Layer I CGE-Reelin+ cINs in control and Pcdhg f/f;Emx1-Cre mutants. E, Quantifications of Reelin+/SST– cINs in Layers I–III in control and Pcdhg f/f;Emx1-Cre mutants (shaded green). Data in C, E show mean ± SEM from three to four animals per genotype, p = 0.78, unpaired t test. F–I, Test for non-autonomous role in CGE-derived Reelin+/SST– (green), using Nkx2.1-Cre to delete Pcdhgf/f from MGE-derived PV+ (blue) and SST+ (pink) cINs. G, Inverted fluorescent images of TdTomato+ (left) and PV+ (right) cINs of control and Pcdhg f/f;Nkx2.1Cre; Ai14-TdTomato animals. H, Quantifications of MGE-derived Tomato+ (p = 0.00019), PV+ (p = 0.0097), and SST+ (p = 0.00005, unpaired t test) populations in control (gray bar) and Pcdhg f/f;Nkx2.1-Cre mutants (outlined bar). I, Quantifications of CGE-derived Reelin+/SST– cINs (green) in Layers I–III (p = 0.58) and Layers V–VI (p = 0.93, unpaired t test); and VIP+ cINs (orange) in Layers I–IV (p = 0.20) and Layers V–VI (p = 0.52, unpaired t test). Data in H, I show mean ± SEM from three to four animals per genotype; **p < 0.01, ***p < 0.001. Scale bars: 200 μm.
Figure 9.
Figure 9.
Pcdhgs promote the survival of GABAergic cerebellar interneurons during PCD. A, MLIs labeled by Gad2-Cre; Ai14-TdTomato in control and Pcdhg GcKO cerebellar cortex at P7 (top) and P15 (bottom). Numbers of MLIs (yellow arrows) increase postnatally in the molecular layer (ML). TdTomato+ soma of Purkinje cells are located in the Purkinje cell layer (PCL). B, Quantification of MLIs in the ML in control (gray) and Pcdhg GcKO mutants (red), marked by TdTomato (P5, P7, P15), or PAX2+ and PV+ (P11, P25). Bars show data, mean ± SEM from three to five animals per genotypes (two for P15 GcKO). P5 p = 0.98; P7 p = 0.48; P11 p = 0.1; P15 p = 0.021; P15, p = 0.008, Mann–Whitney U test. C, MLI density over time, represented by MLI counts normalized by the numbers of PCs. P5 p = 0.34; P7 p = 0.67; P11 p = 0.35; P15 p = 0.04; P25, p < 0.00001, unpaired t test with Welch's correction. D, Left, Immunostaining of TdTomato+ MLIs (red) with anti-CC3 and anti-CC9 (cyan) in control and Pcdhg GcKO cerebellar cortex at P10. Right, Quantifications of CC3/9+/TdTomato+ MLIs. Box plots show data from eight sections per animal, four animals per Pcdhg control or GcKO group; p < 0.00001, Mann–Whitney U test. E, PV-Cre;Ai14-TdTomato recombination pattern at P12 shows TdTomato+ MLIs (magenta, yellow filled arrowhead) co-labeled with anti-PV (green) in the lower ML, and TdTomato-negative MLIs in the upper ML (yellow outline arrowhead). F, Quantifications of cerebellar PV+/NT+ interneurons in Pcdhg PV-Cre animals. Bars show data, mean ± SEM from three animals per genotypes p = 0.31, unpaired t test with Welch's correction. G, MLIs marked by PV (magenta) and NeuroTrace (green) from P35 Pcdhg;Gad2-Cre animals crossed to constitutive BaxKO allele. H, Quantifications of PV+/NT+ MLIs in the ML. Bars show mean ± SEM and counts from four animals per genotype. ANOVA, F = 27.3 p = 0.000012. Post hoc Tukey's pairwise comparison tests: Pcdhg+;Gad2-Cre;Bax+ versus Pcdhg+;Gad2-Cre;BaxKO: p = 0.04. Pcdhg f/f;Gad2-Cre;Bax+ versus Pcdhg f/f;Gad2-Cre;BaxKO: p = 0.000022. Pcdhg+;Gad2-Cre;BaxKO versus Pcdhg f/f;Gad2-Cre;BaxKO: p = 0.99, *p < 0.05, **p < 0.01, ***p < 0.001. Scale bars: 50 μm (A, D, G) and 25 μm (F).

References

    1. Allemang-Grand R, Ellegood J, Spencer Noakes L, Ruston J, Justice M, Nieman BJ, Lerch JP (2017) Neuroanatomy in mouse models of Rett syndrome is related to the severity of Mecp2 mutation and behavioral phenotypes. Mol Autism 8:32. 10.1186/s13229-017-0138-8 - DOI - PMC - PubMed
    1. Ambacher KK, Pitzul KB, Karajgikar M, Hamilton A, Ferguson SS, Cregan SP (2012) The JNK- and AKT/GSK3β- signaling pathways converge to regulate Puma induction and neuronal apoptosis induced by trophic factor deprivation. PLoS One 7:e46885. 10.1371/journal.pone.0046885 - DOI - PMC - PubMed
    1. Anitha A, Thanseem I, Nakamura K, Yamada K, Iwayama Y, Toyota T, Iwata Y, Suzuki K, Sugiyama T, Tsujii M, Yoshikawa T, Mori N (2013) Protocadherin α (PCDHA) as a novel susceptibility gene for autism. J Psychiatry Neurosci 38:192–198. 10.1503/jpn.120058 - DOI - PMC - PubMed
    1. Asai H, Ohkawa N, Saitoh Y, Ghandour K, Murayama E, Nishizono H, Matsuo M, Hirayama T, Kaneko R, Muramatsu SI, Yagi T, Inokuchi K (2020) Pcdhβ deficiency affects hippocampal CA1 ensemble activity and contextual fear discrimination. Mol Brain 13:7. 10.1186/s13041-020-0547-z - DOI - PMC - PubMed
    1. Avants B, Duda JT, Kim J, Zhang H, Pluta J, Gee JC, Whyte J (2008) Multivariate analysis of structural and diffusion imaging in traumatic brain injury. Acad Radiol 15:1360–1375. 10.1016/j.acra.2008.07.007 - DOI - PMC - PubMed

Publication types

MeSH terms

LinkOut - more resources