. 2020 Oct 26;7(5):ENEURO.0022-20.2020.
doi: 10.1523/ENEURO.0022-20.2020. Print 2020 Sep/Oct.

Controlling Horizontal Cell-Mediated Lateral Inhibition in Transgenic Zebrafish Retina with Chemogenetic Tools

Affiliations

Controlling Horizontal Cell-Mediated Lateral Inhibition in Transgenic Zebrafish Retina with Chemogenetic Tools

Billie Beckwith-Cohen et al. eNeuro. .

Abstract

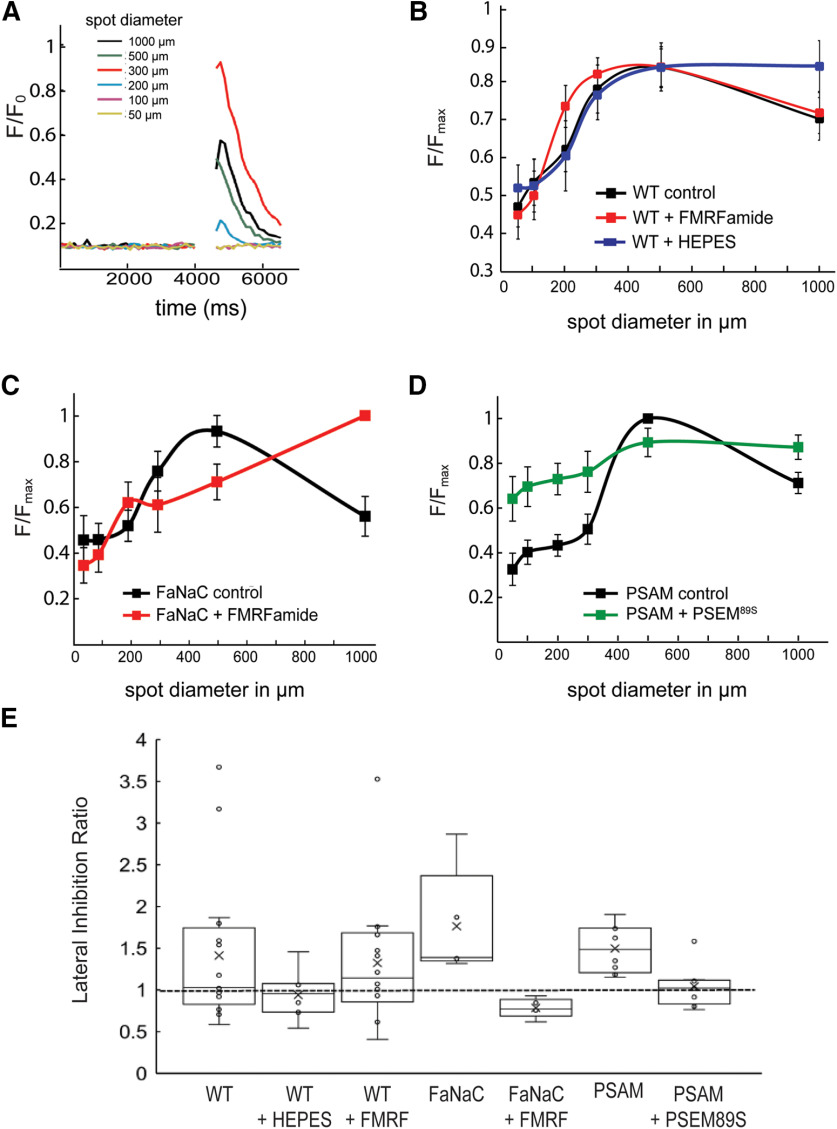
Horizontal cells (HCs) form reciprocal synapses with rod and cone photoreceptors, an arrangement that underlies lateral inhibition in the retina. HCs send negative and positive feedback signals to photoreceptors, but how HCs initiate these signals remains unclear. Unfortunately, because HCs have no unique neurotransmitter receptors, there are no pharmacological treatments for perturbing membrane potential specifically in HCs. Here we use transgenic zebrafish whose HCs express alien receptors, enabling cell-type-specific control by cognate alien agonists. To depolarize HCs, we used the Phe-Met-Arg-Phe-amide (FMRFamide)-gated Na+ channel (FaNaC) activated by the invertebrate neuropeptide FMRFamide. To hyperpolarize HCs we used a pharmacologically selective actuator module (PSAM)-glycine receptor (GlyR), an engineered Cl- selective channel activated by a synthetic agonist. Expression of FaNaC or PSAM-GlyR was restricted to HCs with the cell-type selective promoter for connexin-55.5. We assessed HC-feedback control of photoreceptor synapses in three ways. First, we measured presynaptic exocytosis from photoreceptor terminals using the fluorescent dye FM1-43. Second, we measured the electroretinogram (ERG) b-wave, a signal generated by postsynaptic responses. Third, we used Ca2+ imaging in retinal ganglion cells (RGCs) expressing the Ca2+ indicator GCaMP6. Addition of FMRFamide significantly decreased FM1-43 destaining in darkness, whereas the addition of PSAM-GlyR significantly increased it. However, both agonists decreased the light-elicited ERG b-wave and eliminated surround inhibition of the Ca2+ response of RGCs. Taken together, our findings show that chemogenetic tools can selectively manipulate negative feedback from HCs, providing a platform for understanding its mechanism and helping to elucidate its functional roles in visual information processing at a succession of downstream stages.

Keywords: feedback inhibition; fluorescent protein; horizontal cell; lateral inhibition; photoreceptor; retina.


Figures

Figure 1.
Figure 1.
Strategy for chemogenetic manipulation of HC membrane potential. A, A bicistronic construct containing the molluscan FaNaC from H. aspersa and the red fluorescent protein mCherry, both under the control of the Cx55.5 promoter, were transgenically expressed in HCs of zebrafish causing red fluorescence specific to the HC layer. mCherry exhibits intrinsic fluorescence seen in confocal imaging of a fixed retinal section (left) and in two-photon imaging of a fresh retinal flat mount (right). Puncta with saturating expression of mCherry likely represent protein aggregates within the Golgi apparatus of HCs. A diagram illustrates how binding of the agonist FMRFamide causes Na+ influx thereby depolarizing the membrane potential. B, A bicistronic construct containing the PSAM-GlyR and the green fluorescent protein eGFP, both under the control of the Cx55.5 promoter, were transgenically expressed in HCs of zebrafish causing green fluorescence specific to the HC layer. eGFP was immunolabeled with Alexa Fluor 488 for confocal imaging of a fixed retinal section (left) and its intrinsic fluorescence is seen in two-photon imaging of a fresh retinal flat mount (right). A diagram illustrates how binding of the designer agonist PSEM89S causes Cl influx thereby clamping the membrane potential to ECl. Nuclei are stained with DAPI (blue). Scale bar: 20 μm.
Figure 2.
Figure 2.
Monitoring changes in membrane potential elicited by FMRFamide and PSEM89S. A, Voltage response to a 100-ms puff of PSEM89S (500 μm) in an isolated HC recorded with the gramicidin perforated patch configuration. A puff was delivered at the time indicated by the arrow. Although the concentration of PSEM89S was 500 μm in the pipette, the concentration of the drug is estimated to be diluted ∼50-fold at the cell (Firestein and Werblin, 1989), positioned ∼100 μm from the puffer pipette. B, Traces from three different HCs showing responses to 100-ms puffs of GABA (1 mm), chosen to highlight the variability of responses to GABA that were observed between cells. C, Response to 100-ms application of muscimol (100 μm), a GABAA receptor agonist. Responses were uniformly hyperpolarizing in all cells tested. D, Summary data showing the resting membrane potential, and the membrane potential at the peak of the response to PSEM89S. Large bolded symbols are the mean ± SEM for each condition (n = 6). E, Summary of the change in membrane potential evoked by puffs of GABA or muscimol. Small closed symbols are the responses of individual cells to GABA (n = 11). Open symbols are the responses to muscimol (n = 7). Open boxes are the mean ± SEM for hyperpolarizing responses, and the shaded box is the mean ± SEM for depolarizing responses. The mean amplitude of the responses evoked by muscimol was not significantly different from the amplitude of hyperpolarization evoked by GABA (p = 0.53, rank-sum test). F, Summary data for bath application of FMRFamide (30 μm). Large bolded symbols are the mean ± SEM for each condition (n = 7).
Figure 3.
Figure 3.
Chemogenetic activation of HCs alters vesicular release of FM1-43 from cone terminals. A, Schematic representation of the mechanisms of negative (–) and positive (+) feedback of HCs onto cone photoreceptors (PR). VGCCs are voltage-gated Ca2+ channels, green circles are FM1-43-filled synaptic vesicles, orange dots are glutamate molecules in the synaptic cleft, AMPARs are AMPA receptors. Negative feedback is mediated by changes in the membrane potential of HCs, whereas positive feedback is mediated by increased intracellular Ca2+ in HCs, owing to influx of Ca2+ through Ca2+-permeant AMPA receptors. ΔCai is the change in intracellular Ca2+; ΔVM is the change in HC membrane potential. B, Two-photon scanned images of the photoreceptor terminal layer in FaNaC zebrafish retinas. Retinas were pretreated with FM1-43 to load recycling synaptic vesicles and then treated for 20 min with the indicated receptor agonist. AMPA (20 μm) increased the rate of dye loss (destaining) and FMRFamide (10 μm) decreased destaining, but the AMPA-elicited increase was dominant when the two agonists were applied together. C, D, Time course of FM1-43 destaining in FaNaC fish. Without added agonists, cone terminals released FM1-43 at 0.87 ± 0.08% per minute (n = 10 retinas). Adding AMPA accelerated destaining rate (1.89 ± 0.13%, n = 9 retinas, p <1 × 10−5). Adding FMRFamide (10 μm) decelerated destaining (0.54 ± 0.07% n = 9 retinas, p =0.001). Adding AMPA and FMRFamide together resulted in a significant accelerated destaining rate from dark (p = 0.002), which was not significantly different from that with AMPA alone (1.96 ± 0.25%, n = 4, p = 0.88). Statistical differences were determined with one-way ANOVA (F(3,23) = 27.4, p =8.9 × 10−8). E, F, Time course of FM1-43 destaining in PSAM fish. Adding PSEM89S (30 μm) accelerated destaining (0.83 ± 0.19%, n = 9 retinas, p = 0.044). Adding AMPA accelerated destaining (2.19 ± 0.19%, n = 5 retinas, p =0.0002). Adding PSEM89S and AMPA together resulted in a destaining rate not significantly different from that with AMPA alone (2.05 ± 0.35%, n = 5, p =0.82). Analysis was performed with one-way ANOVA (F(3,24) = 14.69, p =1.2 × 10−5). For D and F open circles represent individual data points. Open boxes represent the interquartile range with whiskers. The mean is marked by x and the median by a line.
Figure 4.
Figure 4.
Chemogenetic manipulation of HCs modulates the bipolar cell light response. Application of FMRFamide had no effect on the ERG of WT zebrafish (A), but decreased the maximal b-wave amplitude in FaNaC zebrafish (B), reaching a maximum ∼40% decrease in the b-wave (C). Application of the buffer HEPES (pH 7.35) cancelled the effects of FMRFamide (C). FMRFamide response was dose dependent having an EC50 of 4.25 μm (D). Application of the agonist PSEM89S (30 μm) also caused a decrease in the maximal b-wave amplitude, but to a lesser degree (E, F).
Figure 5.
Figure 5.
Expression of GCaMP6f in chemogenetic zebrafish lines. A, Ex vivo retina of adult HuC-GCaMP6f zebrafish shows eGFP fluorescence in retinal flat mounts using two-photon imaging. B, Light response is easily measured in RGCs before (left) and after (right) a light flash. C, In vivo confocal imaging of eGFP in 1 dpf PTU-treated zebrafish larvae of HuC-GCaMP6f and FaNaC crossed transgenic fish. The optic nerve (ON) and the developing retina (RGC) show strong eGFP fluorescence. D, In vivo imaging of the same line of fish imaged in C showing that FaNaC-mCherry is easily visualized in HCs at 2 dpf zebrafish larvae. Some red autofluorescence is generated by scattered pigment cells on the ocular surface. RGC, retinal ganglion cell layer; IPL, inner plexiform layer; BC, bipolar cell layer; HC, horizontal cell layer.
Figure 6.
Figure 6.
Chemogenetic manipulation of HCs alters lateral inhibition in downstream RGCs. A, Light responses were measured in HuC::GCaMP6f fish with three light stimuli, delivered at six different spot diameters. Calcium transients were recorded using fluorescence imaging. B, WT RGCs responded with maximum change in fluorescence to a 500-μm spot of light, which decreased at 1000 μm, supporting lateral inhibition. This effect was blocked by HEPES, and was unchanged by applying 10 μm FMRFamide. C, Application of FMRFamide on FaNaC retinas perturbed normal RGC center surround response, (D) as did application of PSEM89S on PSAM- GlyR retinas. E, The LIR in various conditions shows that application of the cognate agonists to FaNaC and PSAM retina significantly disrupts lateral inhibition. Open circles represent individual data points. Open boxes represent the interquartile range with whiskers. The mean is marked by x and the median by a line.

Similar articles

Cited by

References

    1. Ashmore JF, Copenhagen DR (1980) Different postsynaptic events in two types of retinal bipolar cell. Nature 288:84–86. 10.1038/288084a0 - DOI - PubMed
    1. Atasoy D, Sternson SM (2018) Chemogenetic tools for causal cellular and neuronal biology. Physiol Rev 98:391–418. 10.1152/physrev.00009.2017 - DOI - PMC - PubMed
    1. Baden T, Berens P, Franke K, Román Rosón M, Bethge M, Euler T (2016) The functional diversity of retinal ganglion cells in the mouse. Nature 529:345–350. 10.1038/nature16468 - DOI - PMC - PubMed
    1. Baylor DA, Fuortes MG, O’Bryan PM (1971) Receptive fields of cones in the retina of the turtle. The Journal of physiology 214:265–294. - PMC - PubMed
    1. Beckwith-Cohen B, Holzhausen LC, Wang TM, Rajappa R, Kramer RH (2019) Localizing proton- mediated inhibitory feedback at the retinal horizontal cell-cone synapse with genetically-encoded pH probes. J Neurosci 39:651–662. 10.1523/JNEUROSCI.1541-18.2018 - DOI - PMC - PubMed