

Excess mortality in England and Wales during the first wave of the COVID-19 pandemic
- PMID: 33060194
- PMCID: PMC7892396
- DOI: 10.1136/jech-2020-214764
Excess mortality in England and Wales during the first wave of the COVID-19 pandemic
Abstract
Background: Deaths during the COVID-19 pandemic result directly from infection and exacerbation of other diseases and indirectly from deferment of care for other conditions, and are socially and geographically patterned. We quantified excess mortality in regions of England and Wales during the pandemic, for all causes and for non-COVID-19-associated deaths.
Methods: Weekly mortality data for 1 January 2010 to 1 May 2020 for England and Wales were obtained from the Office of National Statistics. Mean-dispersion negative binomial regressions were used to model death counts based on pre-pandemic trends and exponentiated linear predictions were subtracted from: (i) all-cause deaths and (ii) all-cause deaths minus COVID-19 related deaths for the pandemic period (week starting 7 March, to week ending 8 May).
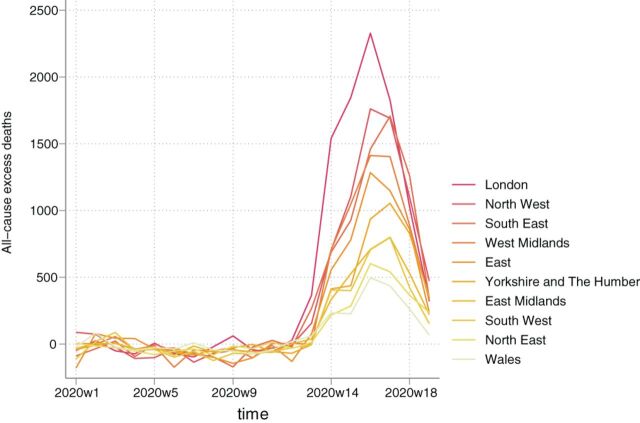
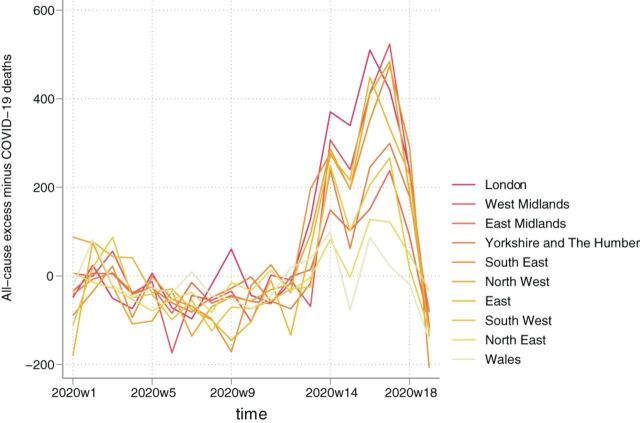
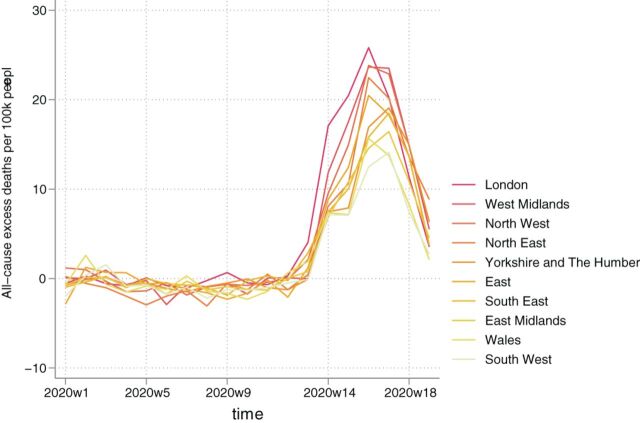
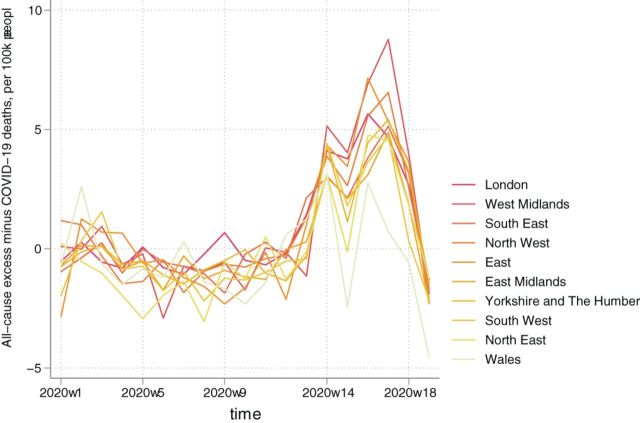
Findings: Between 7 March and 8 May 2020, there were 47 243 (95% CI: 46 671 to 47 815) excess deaths in England and Wales, of which 9948 (95% CI: 9376 to 10 520) were not associated with COVID-19. Overall excess mortality rates varied from 49 per 100 000 (95% CI: 49 to 50) in the South West to 102 per 100 000 (95% CI: 102 to 103) in London. Non-COVID-19 associated excess mortality rates ranged from -1 per 100 000 (95% CI: -1 to 0) in Wales (ie, mortality rates were no higher than expected) to 26 per 100 000 (95% CI: 25 to 26) in the West Midlands.
Interpretation: The COVID-19 pandemic has had markedly different impacts on the regions of England and Wales, both for deaths directly attributable to COVID-19 infection and for deaths resulting from the national public health response.
Keywords: Epidemiology; Infection; Mortality.
© Author(s) (or their employer(s)) 2021. Re-use permitted under CC BY-NC. No commercial re-use. See rights and permissions. Published by BMJ.
Conflict of interest statement
Competing interests: None declared.
Figures
References
-
- GOV.UK. Coronavirus(COVID-19) in the UK. 2020. Available https://coronavirus.data.gov.uk/
-
- Office for National Statistics Coronavirus (COVID-19)roundup. 2020. Available https://www.ons.gov.uk/peoplepopulationandcommunity/healthandsocialcare/...
-
- Office for National Statistics Deaths involving COVID-19by local area and socioeconomic deprivation: deaths occurring between 1 March and17 April 2020. 2020. Available https://www.ons.gov.uk/peoplepopulationandcommunity/birthsdeathsandmarri...
-
- Office for National Statistics Coronavirus (COVID-19) related deaths by ethnic group, England and Wales: 2 March 2020 to 10 April 2020. 2020. Available https://www.ons.gov.uk/peoplepopulationandcommunity/birthsdeathsandmarri...
-
- West D Virus persisting at higher rate in north of England. Health Serv J 2020. Available https://www.hsj.co.uk/coronavirus/exclusive-virus-persisting-at-higher-r... (accessed 20 May 2020)
MeSH terms
LinkOut - more resources
Full Text Sources
Medical