. 2020 Oct 16;370(6514):eabb2494.
doi: 10.1126/science.abb2494.

Behavioral state coding by molecularly defined paraventricular hypothalamic cell type ensembles

Affiliations

Behavioral state coding by molecularly defined paraventricular hypothalamic cell type ensembles

Shengjin Xu et al. Science. .

Abstract

Brains encode behaviors using neurons amenable to systematic classification by gene expression. The contribution of molecular identity to neural coding is not understood because of the challenges involved with measuring neural dynamics and molecular information from the same cells. We developed CaRMA (calcium and RNA multiplexed activity) imaging based on recording in vivo single-neuron calcium dynamics followed by gene expression analysis. We simultaneously monitored activity in hundreds of neurons in mouse paraventricular hypothalamus (PVH). Combinations of cell-type marker genes had predictive power for neuronal responses across 11 behavioral states. The PVH uses combinatorial assemblies of molecularly defined neuron populations for grouped-ensemble coding of survival behaviors. The neuropeptide receptor neuropeptide Y receptor type 1 (Npy1r) amalgamated multiple cell types with similar responses. Our results show that molecularly defined neurons are important processing units for brain function.


Conflict of interest statement

Competing interests: S.M.S., F.E.H., H.Y., and S.X. have filed a patent application on multiplexed FISH methods.

Figures

Fig. 1.
Fig. 1.. CaRMA imaging for investigating models of behavioral state coding by molecularly defined cell types.
(A to C) Models of multiple molecularly defined cell types encoding multiple behavioral states after processing diverse internal and external inputs (I). (A) Labeled-line coding uses a specialized cell type for a behavioral state in which individual members respond similarly, where the number of encoding cell types (m) is equal to the number of distinctly encoded behavioral states (n). (B) In a full-ensemble-coding model, molecularly defined cell types do not respond similarly, and behavioral state coding is independent of cell type. (C) Grouped-ensemble coding uses combinations of molecularly defined cell types in which individual molecularly defined cell types act as a coherent functional unit. (D) Schematic of the CaRMA imaging platform.
Fig. 2.
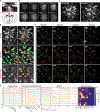
Fig. 2.. Molecular and spatial characterization of PVH neurons by multiplexed FISH with 12 marker genes.
(A) Maximum intensity projection image of multiplexed FISH with 12 marker genes in pPVH. Right, mRNA puncta pseudocolor legend. Solid white line is the contour of pPVH; dashed white line is the region in fig. S4B. (B) Percentages of cells expressing each marker gene in aPVH, mPVH, and pPVH. Error bars indicate mean ± SEM. Gray circles are sample data. *P < 0.05, **P < 0.01, ***P < 0.001. Statistics are provided in table S2. (C) Histogram of PVH cells coexpressing various number of marker genes. (D) Gene expression profiles of 13 molecularly defined PVH cell types from hierarchical clustering of normalized expression of 12 marker genes. (E) Mean expression pattern of marker genes in 13 cell types. (F) Cell types in (D) plotted by t-distributed stochastic neighbor embedding (tSNE). “Cell types” are transcriptional clusters denoted as Ci-xxx, where i is the cluster number in (D) and xxx is a highly expressed gene or “Low” (low expression for all probed genes). (G) Spatial organization of 13 molecularly defined cell types in pPVH (data are from four samples). Each symbol represents one neuron. PVH subregion boundaries are from reference (55). pv, periventricular; dp, dorsal parvicellular; lp, lateral parvicellular; mpv, medial parvicellular ventral zone; 3V, 3rd ventricle. (H) Normalized expression levels of marker genes from PVH neurons.
Fig. 3.
Fig. 3.. Ex vivo ↔ in vivo registration for CaRMA imaging.
(A) Top, head-fixed mouse during two-photon calcium imaging of PVH neurons through a GRIN lens. Bottom, schematic of GRIN lens targeting GCaMP-expressing PVH neurons. (B) Eight planes from a two-photon imaging volume during behavior. Upper left, distances between imaging planes and GRIN lens. Arrowheads mark the corresponding neurons in (C). Red or green asterisks indicate the imaging plane in Fig. 3C or fig. S9A, respectively. (C) Computational correction of optical aberrations from in vivo imaging. Arrowheads indicate neurons from deeper imaging planes in (B) because of field-of-view (FOV) curvature correction. (D) Example neurons showing the ex vivo registration to a substack of the in vivo image volume. Ex vivo image is overlay of z-projected confocal stacks from three consecutive 14-μm brain slices (pseudocolors: cyan, green, and red indicate top, middle, and bottom slices). White dashed line is the resolvable in vivo FOV. Dashed, thin, and thick contours are neurons from the top, middle, and bottom slices, respectively. (E) Four rounds of three-plex FISH from neurons in the bottom slice in (D). (F) Calcium dynamics of neurons in (E) across multiple behavioral states and their 12-plex gene expression profiles. t-auROC, transformed auROC (see the materials and methods); ID, neuron number from (D); ITI, intertrial interval (2 min). Scale bars in (D) and (E), 15 μm.
Fig. 4.
Fig. 4.. Screening for labeled-line neurons encoding multiple behavioral states.
(A) Dendrogram of neuron ensemble response similarities across 11 behavioral states. Dashed lines are thresholds for grouping state classes. (B) Mean response maps of the maximum number of labeled-line neurons in all 11-choose-k combinations of behavioral states. Bottom left, Activated labeled-line neuron sets. Top right, inhibited labeled-line neuron sets. Fisher’s exact test was used to evaluate whether neurons are significantly specialized for a behavioral state. (C) Number of labeled-line neurons depends on the number of behavioral states. (D) Number of labeled-line neurons depends on the number of behavioral state-classes [see (A)]. *, P < 0.05; 2*, P < 0.01; 3*, P < 0.001; 4*, P < 0.0001; 5*, P < 0.00001.
Fig. 5.
Fig. 5.. Calcium dynamics and gene expression profile of PVH neurons across 11 behavioral states.
(A) Calcium response dynamics of the same PVH neurons (319 cells) during multiple behaviors from three mice. Neurons are clustered by gene expression profiles in (B). Temporal scale bars, 1 min. (B) Gene expression profile (12-plex RNA-FISH) of neurons in (A). Molecularly defined cell types are clustered based on the expression of the first nine genes. Cluster 11 has two neurons with high Sst expression even though Sst was not used for clustering (excluded for later analysis because of low neuron count; see the materials and methods). (C) Cell types in (B) plotted by tSNE. “Molecular clusters” are denoted as MCi-xxx, where i is the cluster number in (B) and xxx is a highly expressed gene or “Low” (low expression for all probed genes). (D) Spatial distribution of these cell types in the three imaging FOVs (dashed circles). Colored arrowheads indicate the corresponding neurons in (E). (E) Fluorescence image of GCaMP-expressing example neurons within a FOV (dashed circle). Blue is DAPI and green is GCaMP. (F) Responses of MC5-Crh and MC8-Penk neurons during fear retrieval. Left, response traces of individual neurons. Middle, red shaded lines are the mean responses ± SEM across neurons; gray lines are purities. Right, instantaneous consistent-responses. (G) Different response temporal profiles of MC5-Crh and MC6-Pdyn neurons. Top, Mean responses aligned with food or water presentation. Bottom, Cumulative distribution of instantaneous response slopes of individual neurons from these cell types during the light-blue-shaded periods from the top panel (two-sample Kolmogorov-Smirnov test). (H) Temporal maximum for consistent-response and corresponding response and purity of PVH cell types defined by combinatorial gene expression profiles across 11 behavioral states.
Fig. 6.
Fig. 6.. Decoding behavioral states with neuron dynamics of molecularly defined PVH cell types.
(A) Schematic procedure for decoding behavioral states with the temporal dynamics from individual cell types or all neurons (All, disregards cell type). (B) Decoding accuracies for all behavioral states using the temporal dynamics of one cell type or All neurons (Chi-squared test followed by the Marascuillo procedure was used). (C) Normalized confusion matrix for behavioral state decoding using MC5-Crh neurons. (D) Response amplitude differences of MC5-Crh neurons across behavioral states. Blue lines are mean responses; error bars are SEM; gray connected circles are individual MC5-Crh neuron responses (one-way repeated-measures ANOVA followed by Tukey-Kramer test). (E) Schematic of procedure for decoding behavioral states with the combined temporal response profiles of the PVH cell types using one neuron from each cell type. (F) Average confusion matrix with the combined neuronal dynamics of 10 neurons using the procedure in (E). (G) Decoding accuracies with the combined neuronal dynamics of 10 neurons from 10 PVH cell types or from 10 dummy cell types that scramble cell type information (fig. S21B). Box plots show the median, interquartile range, and minimum to maximum values of the distributions of decoding accuracies (Wilcoxon rank-sum test). (H to K) Cell type ensemble response-decoding diagrams for homeostatic and hedonic eating, fear, and ghrelin injection. Diagrams with temporal maximum of consistent-response (proportional to line width) for each cell type and their decoding weights (proportional to arrowhead area) for hunger eating (H), hedonic eating (I), fear retrieval (J), and ghrelin injection (K). Behavioral state decoding is for all 11 behavioral states (also see fig. S24). *P < 0.05, **P < 0.01, ***P < 0.001. Statistics are provided in table S2.
Fig. 7.
Fig. 7.. Functional clustering of PVH neurons and differential enrichment of marker genes in 11 behavioral states.
(A and B) Hierarchical clustering of PVH neurons based on their responses while eating in a hunger state (A) and after ghrelin injection (B). Right, gene expression profiles of individual neurons. Blue bar marks the behavioral state. Temporal scale bar, 1 min. (C) Comparisons of expression-level distributions of Pdyn in Pdyn+ neurons (top), Crh in Crh+ neurons (middle), and Npy1r in Npy1r+ neurons (bottom) between FCs in (B) after ghrelin injection. (D) Enrichment of marker genes in the FCs across 11 behavioral states. Gene enrichments were ranked by –log10(P value). Gene identity is indicated by bar outline, and the bar fill color indicates the enriched FC. *P < 0.05, **P < 0.01, ***P < 0.001, ****P < 10−4, *****P < 10−5. Statistics are provided in table S2.
Fig. 8.
Fig. 8.. Gene expression predicts FCs in multiple behavioral states.
(A) Schematic of FCi prediction for each neuron solely using its gene expression profile (Gi). (B) Supervised learning schematic using logistic regression to predict FCs of PVH neurons by their gene expression profiles (see the materials and methods). (C) Predictive accuracies (blue scale) for functional classes using all marker genes (All) and the optimal marker gene set from SFFS1, with stacked bars showing the contribution of individual genes (color legend, right). Bottom subpanels show the average coefficients (red scale) of the SFFS1 genes (see the materials and methods). Stem plot colors indicate to which FC the expression of a gene is positively related. Bottom right panel shows that SFFS1 significantly improved predictive accuracy over using the full marker gene set (All) across all states. (D) Predictive accuracies of the optimal gene set for FC prediction ranked for 11 behavioral states (real, red circles) and their corresponding 95th percentile of shuffled accuracies (violin plots). Dashed line indicates 50% accuracy. (E) Optimal precision for FC prediction based on expression of a single gene in each behavioral state [first gene in SFFS1 from (C)]. Comparisons between using all neurons expressing that gene (orange) and using the subset of neurons above the optimal expression threshold of that gene (green). (F) Comparison of response purities from all neurons expressing the most predictive gene and the subset of neurons above the optimal expression threshold. Each datapoint is response purity in one behavioral state. (G) Example responses from predicted Inh-FC neurons after ghrelin injection using Npy1r+ neurons above the expression threshold for a subset of cells in fig. S32A. Neuron 8 is an example of misclassification by the model (i.e., it was activated despite high Npy1r expression). *P < 0.05, **P < 0.01, ***P < 0.001. Statistics are provided in table S2.
Fig. 9.
Fig. 9.. Gene expression profiles of individual PVH neurons predict their temporal responses in multiple behavioral states.
(A) Prediction performance (fraction of deviance explained, FDE) of neuronal response at each timestamp using expression levels of all marker genes, the optimal gene set, and the two most important genes measured by mSFFS. The optimal gene set was composed of the genes that provided the highest FDE from mSFFS at each timestamp. Significance level is the 95th percentile FDE after shuffling gene expression profiles. (B) Number of SFFS rounds with FDE above significance level in each timestamp. (C) Responses of PVH neurons ranked by FDE across behavioral states. (D) FDE ordered high to low of individual neurons for the entire time series across all behavioral states. (E and F) Gene expression profiles (E) and molecularly defined cell types (F) of the corresponding neurons in (D). Black or white lines in (C) to (F) indicate the boundary of the most highly predictive quartile.
Fig. 10.
Fig. 10.. Cooperative regulation of multiple cell types by neuromodulation.
(A) Diagram illustrating volume diffusion of a neuromodulator to selectively regulate subgroups of cell types expressing its receptor. (B) Schematic of modulated grouped-ensemble coding model for multiple behavioral states that includes the role of neuromodulation. Neuromodulator release cooperatively regulates multiple PVH cell types expressing its receptor. This coding configuration highlights the relationship between the hierarchical functional organization of PVH neurons and their molecular hierarchy.

References

    1. Stringer C et al., Spontaneous behaviors drive multidimensional, brainwide activity. Science 364, 255 (2019). doi: 10.1126/science.aav7893; pmid: 31000656 - DOI - PMC - PubMed
    1. Allen JE, Sutherland TE, Crystal-clear treatment for allergic disease. Science 364, 738–739 (2019). doi: 10.1126/science.aax6175; pmid: 31123126 - DOI - PubMed
    1. Gründemann J et al., Amygdala ensembles encode behavioral states. Science 364, eaav8736 (2019). doi: 10.1126/science.aav8736; pmid: 31000636 - DOI - PubMed
    1. Chen X et al., Brain-wide organization of neuronal activity and convergent sensorimotor transformations in larval zebrafish. Neuron 100, 876–890.e5 (2018). doi: 10.1016/j.neuron.2018.09.042; pmid: 30473013 - DOI - PMC - PubMed
    1. Lein ES et al., Genome-wide atlas of gene expression in the adult mouse brain. Nature 445, 168–176 (2007). doi: 10.1038/nature05453; pmid: 17151600 - DOI - PubMed

Publication types