. 2020 Oct 16;370(6514):eaba2894.
doi: 10.1126/science.aba2894.

The nucleus acts as a ruler tailoring cell responses to spatial constraints

Affiliations

The nucleus acts as a ruler tailoring cell responses to spatial constraints

A J Lomakin et al. Science. .

Abstract

The microscopic environment inside a metazoan organism is highly crowded. Whether individual cells can tailor their behavior to the limited space remains unclear. In this study, we found that cells measure the degree of spatial confinement by using their largest and stiffest organelle, the nucleus. Cell confinement below a resting nucleus size deforms the nucleus, which expands and stretches its envelope. This activates signaling to the actomyosin cortex via nuclear envelope stretch-sensitive proteins, up-regulating cell contractility. We established that the tailored contractile response constitutes a nuclear ruler-based signaling pathway involved in migratory cell behaviors. Cells rely on the nuclear ruler to modulate the motive force that enables their passage through restrictive pores in complex three-dimensional environments, a process relevant to cancer cell invasion, immune responses, and embryonic development.


Figures

Figure 1:
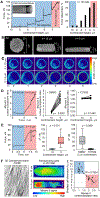
Figure 1:. Cells sense their own height and upregulate actomyosin contractility at a specific height.
A: Left, representative force curve in response to step-wise (1 μm-increment, 5 min-interval) confinement of a cell by the flat microcantilever. Right, percentage of cells displaying a sustained force increase (> 15 nN) as a function of height. B: 3D images (XZ views) of the same live HeLa-Kyoto cell expressing MYH9-GFP at indicated heights. C: Time-lapse image sequence of the same live cell (XY views; single, midplane confocal slices) at 10 μm (top) followed by height change to 5 μm (bottom). Scale bar, 10 μm. D: Left, representative graph of myosin cortex-to-cytoplasm ratio as a function of time in the same live cell upon 10 μm and subsequently 5 μm confinement. Middle and right, the same ratio measured in single live cells at 10 μm and subsequently 5 μm confinement in the presence of DMSO or the ROCK inhibitor Y27632 (n = 10 cells per condition; p value, paired t test). Measurements were done 5 minutes after application of each confinement height. E: Left, representative force response curve (ΔF, force increase) as a function of time in the same live cell upon 10 μm and subsequently 5 μm confinement. Middle, statistical analysis of force response (ΔF) in cells at 10 vs. 5 μm. Right, statistical analysis of force response (ΔF) to 5 μm confinement in cells treated with DMSO or Y27632. Measurements were done 5 minutes after application of the confinement. Data are from ≥ 2 experiments (mean ± SD; n = 10 cells per condition; p value, unpaired t test). F: Left, representative image of 3D dermal fibroblast cell-derived matrix (CDM) stained with a collagen I antibody. Middle, representative images of HT1080 cells expressing GFP-myosin light chain 2 (GFP-MLC2) in 3D CDM (XY views, single confocal slices) with the smallest cell dimension (h) measured as 10 and 5 μm. Right, self-imposed smallest cell dimensions plotted against corresponding values for myosin cortex-to-cytoplasm ratio in the cells within 3D CDM (n = 30 cells). Scale bar, 20 μm.
Figure 2:
Figure 2:. The height-specific contractile response is controlled by mechanisms associated with nuclear/ER membrane stretch.
A: Cortical myosin levels (left) and force response (ΔF, right) to 5 μm confinement of HeLa-Kyoto cells treated with drugs affecting PM tension and extracellular [Ca2+]out (blue) or ER/NE tension and intracellular [Ca2+]in (red). See Table S1 for drug target description and Materials and Methods for drug concentrations. Data are from ≥ 2 experiments (mean ± SD; n = 10 cells per perturbation; see Table S2 for statistics). B: 3D XZ views of the DAPI-stained nucleus at 20, 10, and 5 μm. C: Left, XY views of the nucleus at 10 and 5 μm. Middle and right, measurements of nuclear area and volume at 10 and subsequently 5 μm (n = 10 cells; p value, paired t test). Scale bar, 10 μm. D: Left top, images of the LAP2-GFP-labeled NE confined to 20-to-10-to-5 μm. Scale bar, 5 μm. Left bottom, zoom on a gradually opening nuclear fold. Sscale bar, 2.5 μm. Right, EOPNE at 10 and subsequently 5 μm (upper graph, n = 10 different cells; p value, paired t test) and statistics of EOPNE in cell populations at 20, 10, and 5 μm (lower graph, data are from ≥ 2 experiments; mean ± SD; n = 30 cells per height; p value, unpaired t test). E: Images of the LAP2-GFP-labeled NE and EOPNE quantifications in live cells confined to 5 μm and un-confined to 20 μm (n = 10 cells; p value, paired t test). Scale bar, 5 μm. F: NE fluctuation curves at various confinement heights (h) and quantifications of NE fluctuations at 10 and subsequently 5 μm (n = 10 cells; p value, paired t test) or in cell populations at 20, 10, and 5 μm (mean ± SD; n = 30 cells per height; p value, unpaired t test). G: Images of NUP107-GFP-labeled nuclear pores (NPs) and quantification of inter-NP (NP-NP) distance at 10 and subsequently 5 μm (n = 10 cells; p value, paired t test). Scale bar, 0.5 μm. H: Images of nuclear cPla2-mKate2 signal and quantification of its NE-to-nucleoplasm (NE/NPM) ratio at 10 and subsequently 5 μm (n = 10 cells; p value, paired t test). Scale bar, 1.5 μm.
Figure 3:
Figure 3:. The “Nuclear Ruler” working model.
A: Representative graph of temporal evolution of NE unfolding (EOPNE, blue) and PM blebbing (EOPPM, red) and time-lapse image sequence of the LAP2-GFP-labeled NE (blue) and Lifeact-mCherry-labeled F-actin (red) in the same live cell responding to the sequential confinement to 20-to-10-to-5 μm. Scale bar, 5 μm. B: Height for the onset of contractile force response as a function of the degree of NE folding (EOPNE) before confinement (n = 20 cells). C: Sketch of the working model: cells utilize the nucleus as an internal ruler for their height. When a cell deforms below the resting height (h1) of its nucleus, the nuclear surface area (S) increases while the nuclear volume (V) remains constant. At a critical height (h2), the NE fully expands and gets stretched increasing its tension (T). The increase in NE tension stimulates stretch-sensitive proteins whose activity promotes and/or reinforces cortical actomyosin contractility.
Figure 4:
Figure 4:. Correlation between nuclear stretching and cortical recruitment of myosin in experimentally deformed and spontaneously moving cells.
A: Left, representative images of DAPI-stained (magenta) HeLa-Kyoto cells microfluidically pushed into bottleneck PDMS constrictions. Color-coded nuclear outlines at different time points for a cell pushed into the constriction are shown at the bottom. Middle, representative image sequence of the nucleus (magenta) and MYH9-GFP-labeled myosin (green) in a live cell pushed into the constriction. Right top and bottom, images of the nucleus inside the bottleneck constriction reaching roundness equivalent to 10 and 5 μm confinement heights, and graph of the nuclear roundness index (magenta) and myosin cortical recruitment (green) in time representative of n = 30 cells. B: Left, representative images (XY views, single confocal slices) of RFP-NLS-labeled nuclei (top) and GFP-MLC2-labeled myosin in HT1080 cells within 3D CDM. Middle, smallest nuclear dimension plotted against corresponding values of EOPNE. Right, myosin cortex-to-cytoplasm ratio plotted against corresponding values of EOPNE (n = 30 cells). Scale bar, 5 μm.
Figure 5:
Figure 5:. Enucleated cells and cells regioselectively confined to avoid the nucleus do not trigger contractile responses at relevant heights.
A: Left, representative images (XY views) of a nucleated (DAPI (blue)-positive) cell and an enucleated (DAPI-negative) cytoplast. Right, XZ views of a cell and a cytoplast of similar height representative of those selected for analyses. Scale bar, 5 μm. B: Images (top) and quantifications (bottom) of myosin cortical accumulation (left) and force response (ΔF, right) in cells (n = 10) and cytoplasts (n = 10) confined to 10 vs. 5 μm. Data are from ≥ 2 experiments; mean ± SD; p value, unpaired t test. Scale bar, 10 μm. C: Regioselective confinement of the nuclear region (lower cell) vs. the nucleus-free lamella (upper cell). Cyan, DAPI nuclear stain; Red hot, myosin signal; Dashed squares, zoomed regions (right images). Scale bar, 10 μm. D: Quantifications of myosin cortical accumulation and force response (ΔF) upon nuclear (n = 10) and lamellar cortex (n = 10) confinement. Data are from ≥ 2 experiments; mean ± SD; p value, unpaired t test.
Figure 6:
Figure 6:. The nuclear ruler is defective in cells with altered nuclear envelope properties.
A: Top left, representative images of DAPI-stained nuclei in HeLa-Kyoto cells treated with control or LMNA siRNA. Top right, quantifications of NE fluctuations in LMNA siRNA-treated cells under 20, 10, and 5 μm confinement (data are from ≥ 2 experiments; mean ± SD; n = 20 cells per height; p value, unpaired t test). Bottom left, percentage of cells displaying nuclear rupture at 5 μm. Data are from ≥ 2 experiments; n = 15 cells per condition. Bottom right, force response (ΔF) to 5 μm confinement. Data are from ≥ 2 experiments; mean ± SD; n = 10 (Ctrl si) and 15 (LMNA si) cells; p value, unpaired t test. Scale bar, 10 μm. B: Top, representative images of NE in HeLa-Kyoto cells stably expressing LAP2-GFP or ectopically overexpressing (OE) LBR-GFP and corresponding EOPNE quantifications. Data are from ≥ 2 experiments; mean ± SD; n = 10 cells per condition; p value, unpaired t test). Bottom, force response (ΔF) to 5 μm confinement. Data are from ≥ 2 experiments; mean ± SD; n = 10 (LAP2) and 15 (LBR OE) cells; p value, unpaired t test. Scale bar, 10 μm.
Figure 7:
Figure 7:. The nuclear ruler function in immune cell migration.
A: Left and middle, cartoons illustrating primary culture of iDCs and their confinement between two parallel surfaces inducing a highly migratory DC phenotype. Right top, iDC velocity measured at 10 (n = 20 cells), 4 (n = 35 cells), and 3 (n = 35 cells) μm confinement height (h). Right bottom, cell velocity (vcell) measured at 3 μm confinement in control (DMSO and wild-type (WT)) vs. cPLA2-inhibited (AACOCF3/AA treatment) or Lmna knockout (KO) cells (n = 20 cells per condition). Data are from ≥ 2 experiments; mean ± SD; p value, unpaired t test. B: Top, temporal color-coded cell tracks from a representative time-lapse movie of control (Ctrl si) and cPLA2a-depleted (Pla2g4a si) LifeAct-GFP-expressing iDCs under 3 μm-confinement. Bottom, statistical analysis of cell velocity (vcell) for control and depleted cells at 4 vs. 3 μm. Data are from ≥ 2 experiments; mean ± SD; n = 20 cells per condition; p value, unpaired t test. Scale bar, 50 μm. C: Representative images of DAPI-stained nuclei (XY view, single confocal slices) and EOPNE quantifications in iDCs at 4 vs. 3 μm. Data are from ≥ 2 experiments; mean ± SD; n = 35 cells per condition; p value, unpaired t test. Scale bar, 5 μm. D: Representative images and quantifications of myosin cortical accumulation in control (Ctrl si) and cPLA2a-depleted (Pla2g4a si) MYH9-GFP-expressing iDCs at 4 and 3 μm. Data are from ≥ 2 experiments; mean ± SD; n = 20 cells per condition; p value, unpaired t test. Scale bar, 15 μm.
Figure 8:
Figure 8:. The nuclear ruler function in cancer cell migration.
A: Left, 3D light-sheet microscopy images of atelopeptide fibrillar bovine dermal collagen (1.7 mg ml−1) lattices. Right, quantifications of the percentage of human melanoma cells A375P able to chemotactically transmigrate through the lattice (1 mm thick) in the presence of the broad-spectrum matrix metalloproteinase inhibitor GM6001 in conditions affecting cell contractility (Y27, BBS, and ML7), NE properties (LMNA si and LBR OE), cPLA2 expression and activity (PLA2G4A si, AA, and PA), and stretch-sensitive calcium release (Gd3+, GsMTx4, 2APB, and Xesto). Data are from ≥ 2 experiments; mean ± SD; n ≥ 300 cells per condition. See Table S3 for drug target description and pairwise statistical comparisons, and Materials and Methods for drug concentrations. B: Scanning electron microscopy images of polycarbonate membranes with 12 (blue) and 8 (red) μm pores (scale bar, 10 μm), and quantifications of the percentage of A375P cells able to chemotactically transmigrate through the pores in the conditions specified in A. Data are from ≥ 2 experiments; mean ± SD; n ≥ 300 cells per condition. See Table S3 for drug target description and pairwise statistical comparisons, and Materials and Methods for drug concentrations. Dotted line in A and B, cell transmigration rate upon global perturbation of actomyosin contractility.

Comment in

References

    1. Eisenhoffer GT, Loftus PD, Yoshigi M, Otsuna H, Chien C-B, Morcos PA, Rosenblatt J, Crowding induces live cell extrusion to maintain homeostatic cell numbers in epithelia. Nature. 484, 546–549 (2012). - PMC - PubMed
    1. Renkawitz J, Kopf A, Stopp J, de Vries I, Driscoll MK, Merrin J, Hauschild R, Welf ES, Danuser G, Fiolka R, Sixt M, Nuclear positioning facilitates amoeboid migration along the path of least resistance. Nature. 568, 546–550 (2019). - PMC - PubMed
    1. Trappmann B, Gautrot JE, Connelly JT, Strange DGT, Li Y, Oyen ML, Cohen Stuart MA, Boehm H, Li B, Vogel V, Spatz JP, Watt FM, Huck WTS, Extracellular-matrix tethering regulates stem-cell fate. Nat. Mater 11, 642–649 (2012). - PubMed
    1. Vahey MD, Fletcher DA, The biology of boundary conditions: cellular reconstitution in one, two, and three dimensions. Curr. Opin. Cell Biol 26, 60–68 (2014). - PMC - PubMed
    1. Oria R, Wiegand T, Escribano J, Elosegui-Artola A, Uriarte JJ, Moreno-Pulido C, Platzman I, Delcanale P, Albertazzi L, Navajas D, Trepat X, García-Aznar JM, Cavalcanti-Adam EA, Roca-Cusachs P, Force loading explains spatial sensing of ligands by cells. Nature. 552, 219–224 (2017). - PubMed

Publication types