. 2020 Oct 15;11(1):5206.
doi: 10.1038/s41467-020-18871-1.

Health and disease markers correlate with gut microbiome composition across thousands of people

Affiliations

Health and disease markers correlate with gut microbiome composition across thousands of people

Ohad Manor et al. Nat Commun. .

Abstract

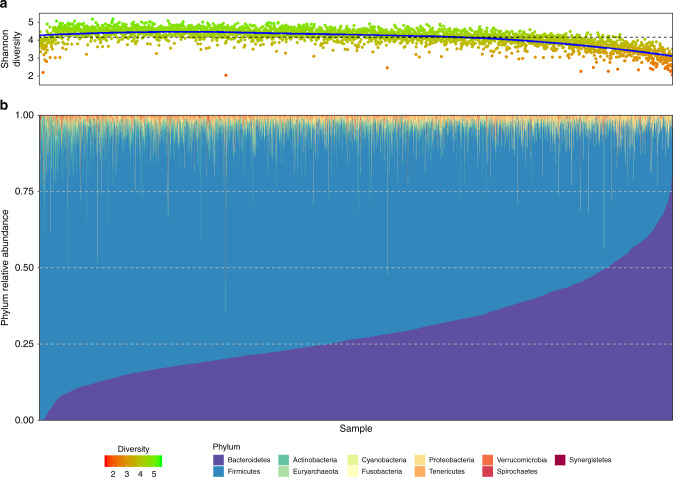
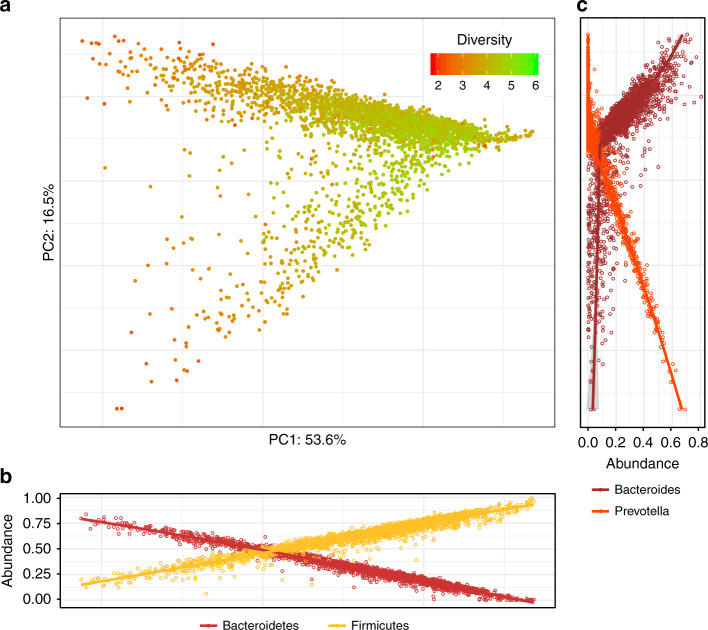
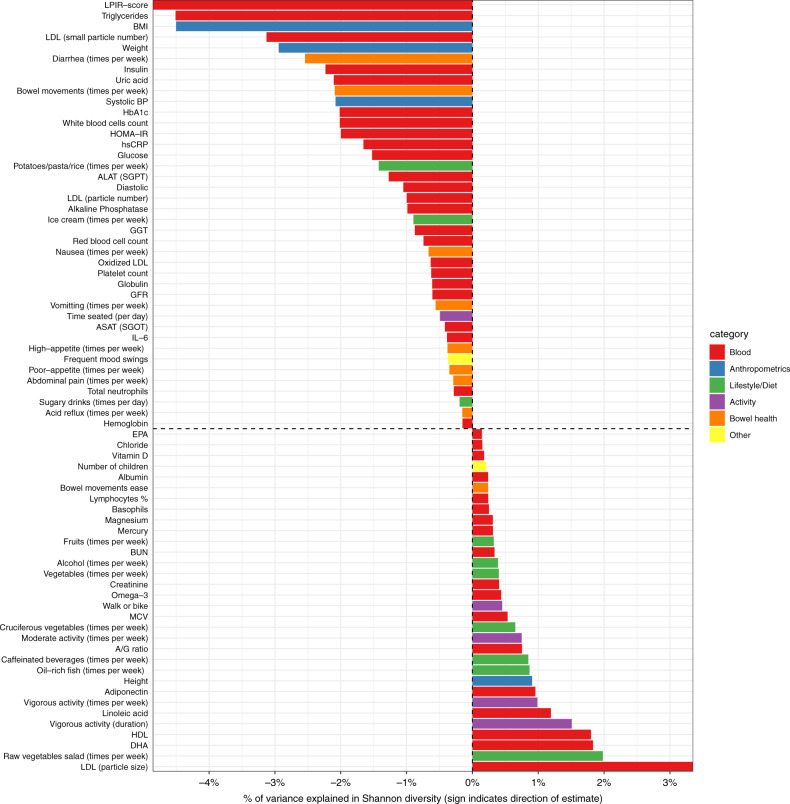
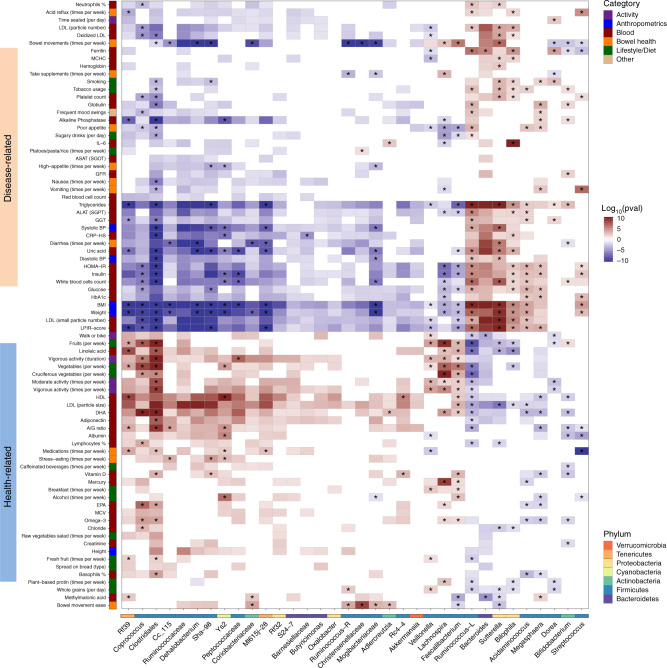
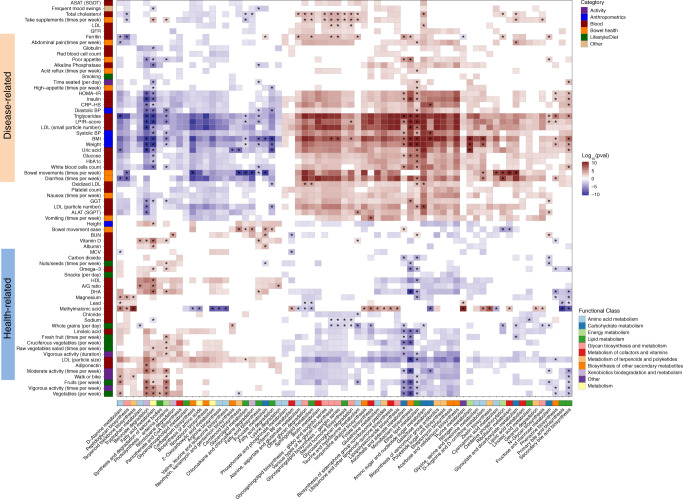
Variation in the human gut microbiome can reflect host lifestyle and behaviors and influence disease biomarker levels in the blood. Understanding the relationships between gut microbes and host phenotypes are critical for understanding wellness and disease. Here, we examine associations between the gut microbiota and ~150 host phenotypic features across ~3,400 individuals. We identify major axes of taxonomic variance in the gut and a putative diversity maximum along the Firmicutes-to-Bacteroidetes axis. Our analyses reveal both known and unknown associations between microbiome composition and host clinical markers and lifestyle factors, including host-microbe associations that are composition-specific. These results suggest potential opportunities for targeted interventions that alter the composition of the microbiome to improve host health. By uncovering the interrelationships between host diet and lifestyle factors, clinical blood markers, and the human gut microbiome at the population-scale, our results serve as a roadmap for future studies on host-microbe interactions and interventions.


Conflict of interest statement

O.M., C.L.D., S.A.K., B.S., J.C.L., and A.T.M. were all former employees and shareholders of Arivale. N.D.P. was a former shareholder of Arivale. Arivale is no longer a commercially operating company as of April 2019. The remaining author declares no competing interests.

Figures

Fig. 1
Fig. 1. Overall composition of the gut microbiome in participants.
Shown are the Shannon diversity index (a) and phyla relative abundances (b) across all participants’ samples. Each sample is represented by one stacked bar in the bottom panel (b) colored by phyla, and a corresponding point in the upper panel (a) indicating the microbial diversity.
Fig. 2
Fig. 2. Principal component analysis of the taxonomic composition of the gut microbiome.
a Shown is the principal component analysis (PCA) plot generated by applying edgePCA to the OTU-level counts data. Each point represents one sample, and the samples are colored by their Shannon diversity index. The percent of variation explained by each principal component is depicted on each axis. b + c Shown are scatter plots of the relative abundances of the phyla Bacteroidetes and Firmicutes (b) and the genera Bacteroides and Prevotella (c) across the corresponding principal component. For each sample in (a), there are two corresponding points in (b) and two corresponding points in (c). Lines indicate the loess regression fit and the shaded area represents the 95% confidence interval. N = 3409 biologically independent samples in all panels.
Fig. 3
Fig. 3. Significant associations between microbiome diversity and multiple factors.
Shown is a bar plot representing the percent of variance explained (x-axis) in Shannon diversity across all available samples by each factor (y-axis). Positive values indicate positive associations while negative values indicate negative associations with diversity. Each factor is colored by the category to which it belongs. For each analyte (e.g., lifestyle, diet, clinical test), associations were tested by fitting linear regression models (see Methods) and only factors that passed the FDR multiple hypothesis correction with p < 0.05 are shown.
Fig. 4
Fig. 4. Host factors show different patterns of association with microbiome diversity across taxonomic clusters.
Shown are boxplots of Shannon diversity (adjusted for confounding factors) for clinical ranges of fasting insulin (a; N = 2754) and daily intake of vegetables (b; N = 2583) across the reference cluster (Firmicutes), and the Firmicutes-rich (FR), Bacteroides-rich (BR), and Prevotella-rich (PR) clusters. Boxes denote the interquartile range (IQR) between the first and third quartiles with the black line inside each box denoting the median. Whiskers extend to the lowest and highest values within 1.5 times IQR.
Fig. 5
Fig. 5. Significant associations between microbial genera and multiple factors.
Shown is a heatmap of the microbial genera (x-axis) that were found to be significantly associated with different factors (y-axis) using generalized linear models adjusted for confounding factors (see Methods). Only genera that had at least 20 significant associations are shown in the plot, along with factors that had at least ten associations with them (see full list of associations in Supplementary Data 3). For each analyte (e.g., lifestyle, diet, clinical test), associations were tested by fitting generalized linear models (see Methods). The significant heatmap cells (after correcting for multiple hypotheses with FDR-corrected p < 0.05) are represented by the significance of the p value (indicated by saturation, e.g., values of 10 or −10 indicate that p value = 1−10) and the direction of association (indicated by color, e.g., red is positively associated). Each factor is colored by the category to which it belongs, and each genus is colored by the phylum to which it belongs. Associations that are still significant after adjusting for microbiome diversity are marked with an asterisk.
Fig. 6
Fig. 6. Significant associations between microbial pathways and multiple factors.
Shown is a heatmap of the microbial pathways (x-axis) that were found to be significantly associated with different factors (y-axis) using generalized linear models adjusted for confounding factors (see Methods). Only metabolic pathways that had at least 20 significant associations are shown in the plot, along with factors that had at least 15 associations with them (see full list of associations in Supplementary Data 4). For each analyte (e.g., lifestyle, diet, clinical test), associations were tested by fitting generalized linear models (see Methods). The significant heatmap cells (after correcting for multiple hypotheses with FDR-corrected p < 0.05) are represented by the significance of the p value (indicated by saturation, e.g., values of 10 or −10 indicate that p value = 1−10) and the direction of association (indicated by color, e.g., red is positively associated). Each factor is colored by the category to which it belongs, and each genus is colored by the phylum to which it belongs. Associations that are still significant after adjusting for microbiome diversity are marked with an asterisk.

References

    1. Joossens M, et al. Dysbiosis of the faecal microbiota in patients with Crohn’s disease and their unaffected relatives. Gut. 2011;60:631–637. doi: 10.1136/gut.2010.223263. - DOI - PubMed
    1. Morgan XC, et al. Dysfunction of the intestinal microbiome in inflammatory bowel disease and treatment. Genome Biol. 2012;13:R79. doi: 10.1186/gb-2012-13-9-r79. - DOI - PMC - PubMed
    1. Mottawea W, et al. Altered intestinal microbiota-host mitochondria crosstalk in new onset Crohn’s disease. Nat. Comms. 2016;7:13419. doi: 10.1038/ncomms13419. - DOI - PMC - PubMed
    1. Kootte RS, et al. Improvement of insulin sensitivity after lean donor feces in metabolic syndrome is driven by baseline intestinal microbiota composition. Cell Metab. 2017;26:611–619. doi: 10.1016/j.cmet.2017.09.008. - DOI - PubMed
    1. Chassaing B, Raja SM, Lewis JD, Srinivasan S, Gewirtz AT. Colonic Microbiota Encroachment Correlates With Dysglycemia in Humans. Cell. Mol. Gastroenterol. Hepatol. 2017;4:205–221. doi: 10.1016/j.jcmgh.2017.04.001. - DOI - PMC - PubMed