. 2020 Oct 15;10(1):17346.
doi: 10.1038/s41598-020-74269-5.

On the effects of memory and topology on the controllability of complex dynamical networks

Affiliations

On the effects of memory and topology on the controllability of complex dynamical networks

Panagiotis Kyriakis et al. Sci Rep. .

Abstract

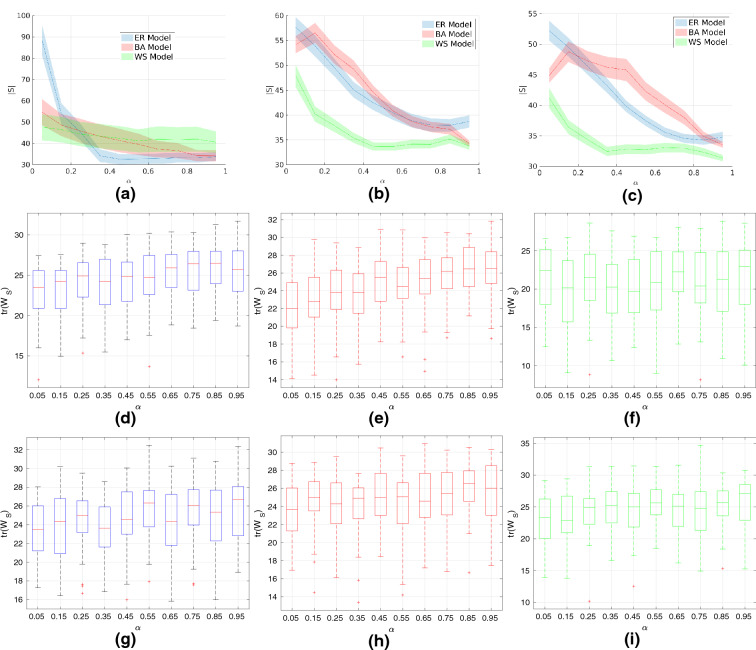
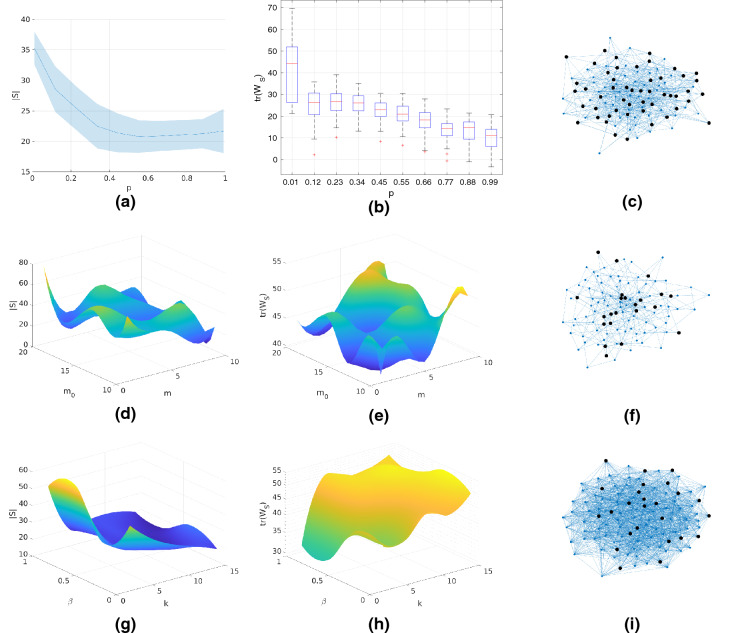
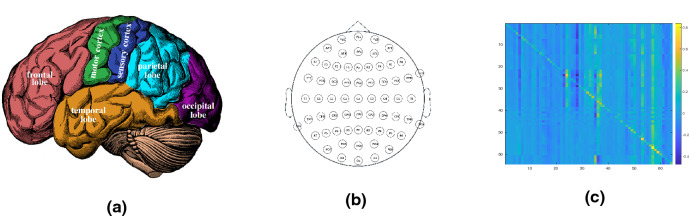
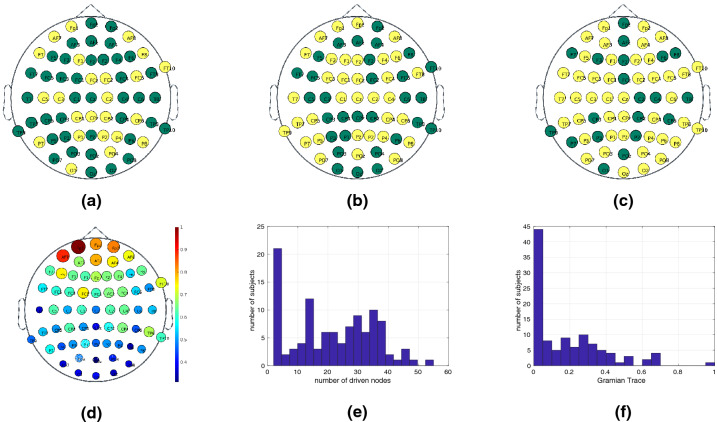
Recent advances in network science, control theory, and fractional calculus provide us with mathematical tools necessary for modeling and controlling complex dynamical networks (CDNs) that exhibit long-term memory. Selecting the minimum number of driven nodes such that the network is steered to a prescribed state is a key problem to guarantee that complex networks have a desirable behavior. Therefore, in this paper, we study the effects of long-term memory and of the topological properties on the minimum number of driven nodes and the required control energy. To this end, we introduce Gramian-based methods for optimal driven node selection for complex dynamical networks with long-term memory and by leveraging the structure of the cost function, we design a greedy algorithm to obtain near-optimal approximations in a computationally efficiently manner. We investigate how the memory and topological properties influence the control effort by considering Erdős-Rényi, Barabási-Albert and Watts-Strogatz networks whose temporal dynamics follow a fractional order state equation. We provide evidence that scale-free and small-world networks are easier to control in terms of both the number of required actuators and the average control energy. Additionally, we show how our method could be applied to control complex networks originating from the human brain and we discover that certain brain cortex regions have a stronger impact on the controllability of network than others.


Conflict of interest statement

The authors declare no competing interests.

Figures

Figure 1
Figure 1
Investigating the effect of network on the number of driven nodes and Gramian trace. We use homogeneous order exponents of α=1 (left column), α=0.5 (middle column) and α=0.3 (right column) and set the model parameters as follows: p=0.5 for the ER model; m=4 and m0=5 for the BA model; k=4 and β=0.8 for the WS model. We run all simulations Nr=50 times and report the first and second order statistics. (ac): Mean and 95% confidence interval under the t-distribution assumption of the minimum number of driven nodes. (df) Quartiles and outliers of the trace of the controllability Gramian for the ER model. (gi) Quartiles and outliers of the trace of the controllability Gramian for the BA model. (jl) Quartiles and outliers of the trace of the controllability Gramian for the WS model.
Figure 2
Figure 2
Effect of long-term memory on the number of driven nodes and Gramian trace. The network size is N=100 and the model parameters as follows: p=0.5 for the ER model; m=4 and m0=5 for the BA model; k=4 and β=0.8 for the WS model. We run all simulations Nr=50 times and report the first and second order statistics. (a): Mean and 95% confidence interval under the t-distribution assumption of the minimum number of driven nodes for heterogeneous fractional order exponents. (b): Mean and 95% confidence interval under the t-distribution assumption of the minimum number of driven nodes for uniformly distributed fractional order exponents. (c) Mean and 95% confidence interval under the t-distribution assumption of the minimum number of driven nodes for normally distributed fractional order coefficients. (df) Quartiles and outliers of the trace of the controllability Gramian for uniformly distributed fractional order exponents. (gi) Quartiles and outliers of the trace of the controllability Gramian for normally distributed fractional order exponents.
Figure 3
Figure 3
Investigating the effects of model parameters on the number of driven nodes and Gramian trace. We use networks of size N=100, Gaussian fractional order exponents, run all simulations Nr=50 times and report the first/second order statistics. (a) Mean and 95% confidence interval under the t-distribution assumption of the number of driven of the ER model. (b) Quartiles and outliers of the trace of the controllability Gramian for the ER model. (c) Sample graph from the ER model (p=0.5). The algorithms selected 50 nodes to be driven (highlighted). (d) Mean of the minimum number of driven nodes for the BA model. (e) Mean of the trace of the controllability Gramian for the BA model. (f) Sample graph from the ER model (m=5,m0=15). The algorithms selected 24 nodes to be driven (highlighted). (g) Mean of the minimum number of driven nodes for the BA model. (h) Mean of the trace of the controllability Gramian for the BA model. (i) Sample graph from the WS model (k=5,β=0.8). The algorithms selected 25 nodes to be driven (highlighted).
Figure 4
Figure 4
(a) Illustration of main anatomical brain regions (figure reproduced from). (b) The position of the 64 EEG sensors used in the experimental study. (c) Resulting adjacency matrix of the extracted complex brain network from a randomly chosen subject.
Figure 5
Figure 5
Brain controllability analysis. Highlighting in yellow the driven nodes required to achieve brain controllability for several individuals, namely individuals with ID 3 (in (a)), 27 (in (b)), and 102 (in (c)), respectively. The color-map representing the relative number of times each electrode acts as a driven node across all 109 subjects is shown in (d). The histogram of the number of driven nodes (e) and the trace of the Gramian (f) show that most of the subjects require few driven nodes (e.g., more than 20% of the subjects require less than 5 driven nodes) and a small fraction of 2 subjects that require more than 50 driven nodes.

References

    1. Watts, D. J. & Strogatz, S. H. Collective dynamics of ‘small-world’ networks. Nature393, 440–442. 10.1038/30918 (1998). - PubMed
    1. Barabasi, A.-L. & Albert, R. Emergence of scaling in random networks. Science286, 509–512, 10.1126/science.286.5439.509 (1999). - PubMed
    1. Erdős, P. & Rényi, A. On the evolution of random graphs. Publications of the Mathematical Institute of the Hungarian Academy of Sciences 17–61, (1960).
    1. Chen, C.-T. Linear System Theory and Design, 2nd edn (Oxford University Press, Inc., New York, 1995).
    1. Liu Y-Y, Slotine J-J, Barabasi A-L. Controllability of complex networks. Nature. 2011;473:167–173. doi: 10.1038/nature10011. - DOI - PubMed

Publication types