. 2020 Oct 15;10(1):17505.
doi: 10.1038/s41598-020-73588-x.

A site-specific map of the human plasma glycome and its age and gender-associated alterations

Affiliations

A site-specific map of the human plasma glycome and its age and gender-associated alterations

Alexander A Merleev et al. Sci Rep. .

Abstract

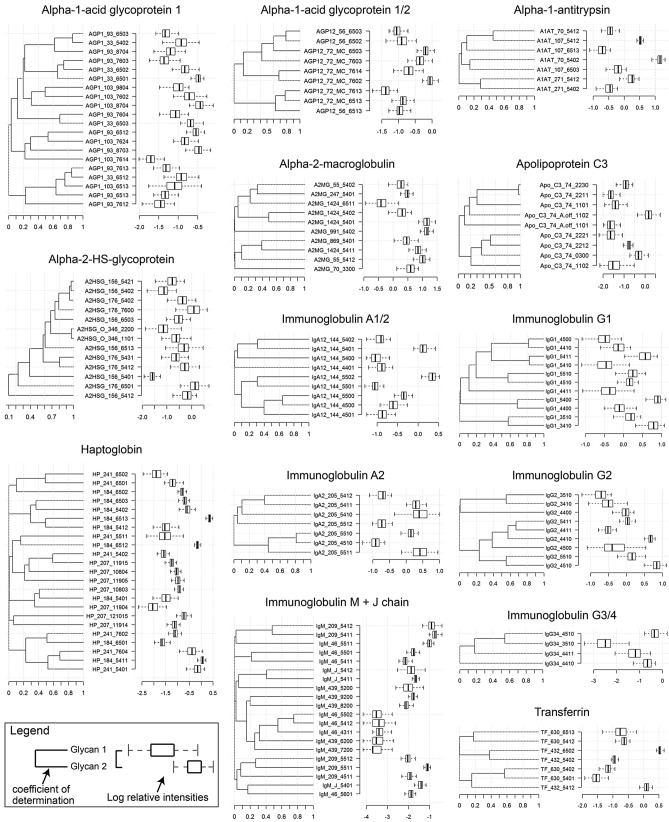
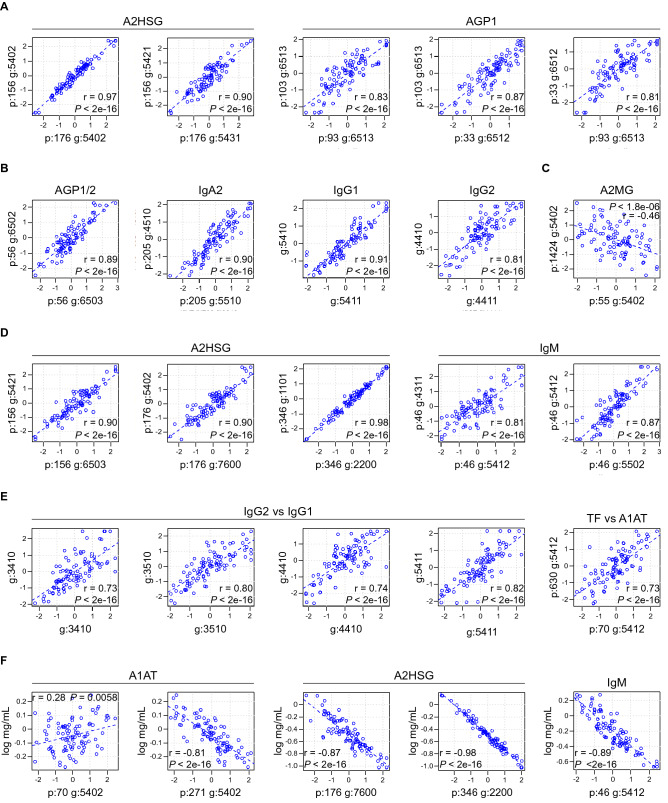
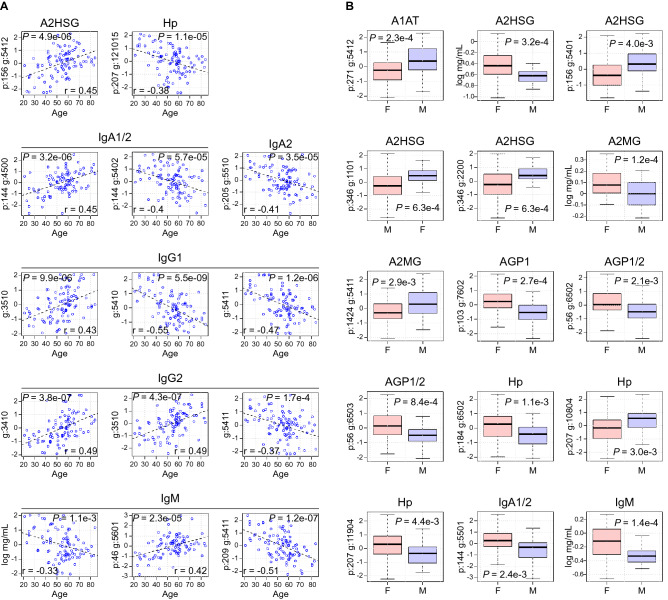
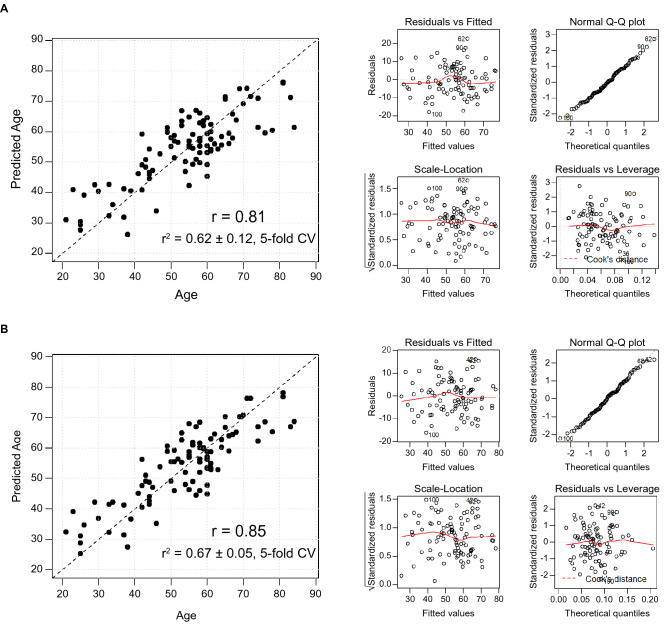
Alterations in the human glycome have been associated with cancer and autoimmunity. Thus, constructing a site-specific map of the human glycome for biomarker research and discovery has been a highly sought-after objective. However, due to analytical barriers, comprehensive site-specific glycoprofiling is difficult to perform. To develop a platform to detect easily quantifiable, site-specific, disease-associated glycan alterations for clinical applications, we have adapted the multiple reaction monitoring mass spectrometry method for use in glycan biomarker research. The adaptations allow for highly precise site-specific glycan monitoring with minimum sample prep. Using this technique, we successfully mapped out the relative abundances of the most common 159 glycopeptides in the plasma of 97 healthy volunteers. This plasma glycome map revealed 796 significant (FDR < 0.05) site-specific inter-protein and intra-protein glycan associations, of which the vast majority were previously unknown. Since age and gender are relevant covariants in biomarker research, these variables were also characterized. 13 glycopeptides were found to be associated with gender and 41 to be associated with age. Using just five age-associated glycopeptides, a highly accurate age prediction model was constructed and validated (r2 = 0.62 ± 0.12). The human plasma site-specific glycan map described herein has utility in applications ranging from glycan biomarker research and discovery to the development of novel glycan-altering interventions.


Conflict of interest statement

The authors declare no competing interests.

Figures

Figure 1
Figure 1
Site-specific map of the human serum glycome. The major glycans occurring at the glycosylations sites of the 17 most common serum glycoproteins are presented. When present, the sites of glycosylation (first of the two numbers) are as indicated in UNIPROT. When there is no position indicated, the glycosylation occurs at the immunoglobulin constant heavy chain domain 2 (CH2)-84.4 glycosylation site (IMGT numbering system). Glycan structures are presented as a four digit code where the first numeral represents the total number of mannose and galactose residues combined, the second represents the total number of N-acetylglucosamine residues, the third numeral corresponds to the number of fucose residues, and the final numeral is the number of sialic acid moieties. On the right side of each diagram is the log of the relative abundances of the glycans presented as box-and-whisker plots. The left and right bars connected to each box indicate the boundaries of the normal distribution and the left and right box edges mark the first and third quartile boundaries within each distribution. The bold line within the box indicates the median value of the distribution. On the left of each diagram are the square of the intra-protein Pearson Product Moment Correlation Coefficients (PPMCCs) for connected glycan pair.
Figure 2
Figure 2
Intra-and inter-protein glycan associations. Log relative abundances for individual glycan pairs were graphed, and correlations were determined using Pearson Product Moment Correlation Coefficients (PPMCCs), which is abbreviated as “r”. (AD) are intra-protein correlations. (E) represents inter-protein glycan correlations. (F) represents protein-glycan correlations. (A comprehensive list of all pairwise correlations between monitored analytes can be found in Data File S1) (n = 97).
Figure 3
Figure 3
Effect of Age and Gender on glycosylation. (A) Log relative glycan abundance versus age. Examples of glycoforms significantly altered by age (a full list can be found in Table S4). Of note, IgG1 and IgG2 share several age-associated glycan modifications. Also, glycan 5411 is negatively correlated with age when present on IgG1, IgG2, and position 209 of IgM. IgM also declines with increasing age (P = 0.0011). (B) Representative site-specific glycosylations and proteins that are differentially expressed with respect to gender (a full list can be found in Table S5). The upper and lower bars connected to each box indicate the boundaries of the normal distribution and the upper and lower box edges mark the first and third quartile boundaries within each distribution. The bold line within the box indicates the median value of the distribution. Y-axis represents log relative abundance or log protein concentration where indicated.
Figure 4
Figure 4
Age Prediction Models. (A) The graph represents the performance of a linear regression model for age prediction. The model was constructed from 5 different glycopeptides (IgG1 g:3510, IgG1 g:5410, IgM p:209 g:5411, IgM J chain g:5412, Hp p:241 g:7602). Diagnostic plots (residuals vs fitted, testing for linearity; normal Q-Q, to assess the distribution of the residuals; scale-location, to assess the homoscedastic of the data; and residuals vs leverage, to check for overly influential cases) for the model are presented to its right. (B) Linear regression model comprised of six glycopeptides (IgG1 g:3510, IgG1 g:5410, IgG2 g:3410, IgM p:209 g:5411, IgM J chain g:5412, Hp p: 241 g:7602) and 1 serum protein, IgG3. Model diagnostics are represented to the right (model performance parameters for age prediction models can be found in Table S7).

References

    1. Apweiler R, Hermjakob H, Sharon N. On the frequency of protein glycosylation, as deduced from analysis of the SWISS-PROT database. Biochim. Biophys. Acta. 1999;1473:4–8. doi: 10.1016/s0304-4165(99)00165-8. - DOI - PubMed
    1. National Research Council (US) Committee on Assessing the Importance and Impact of Glycomics and Glycosciences. Transforming Glycoscience: A Roadmap for the Future (National Academies Press, US, 2012). - PubMed
    1. Cummings RD. The repertoire of glycan determinants in the human glycome. Mol. Biosyst. 2009;5:1087–1104. doi: 10.1039/b907931a. - DOI - PubMed
    1. Parekh RB, et al. Association of rheumatoid arthritis and primary osteoarthritis with changes in the glycosylation pattern of total serum IgG. Nature. 1985;316:452–457. doi: 10.1038/316452a0. - DOI - PubMed
    1. Parekh RB, et al. Galactosylation of IgG associated oligosaccharides: reduction in patients with adult and juvenile onset rheumatoid arthritis and relation to disease activity. Lancet. 1988;1:966–969. doi: 10.1016/S0140-6736(88)91781-3. - DOI - PubMed

Publication types