

Effectiveness of hysteroscopic resection of a uterine caesarean niche can be predicted: a prospective cohort study
- PMID: 33060690
- PMCID: PMC7566491
- DOI: 10.1038/s41598-020-74622-8
Effectiveness of hysteroscopic resection of a uterine caesarean niche can be predicted: a prospective cohort study
Abstract
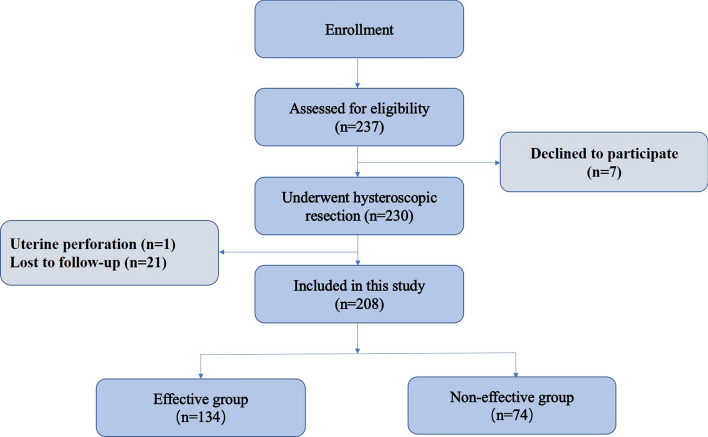
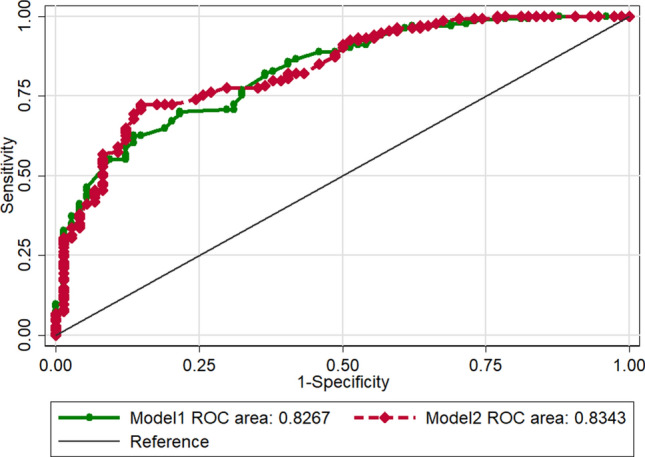
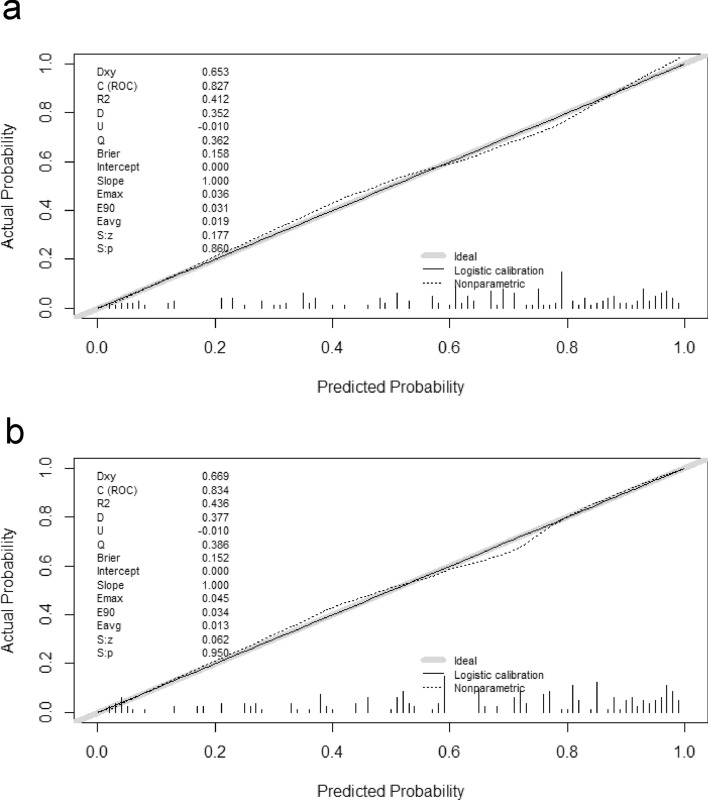
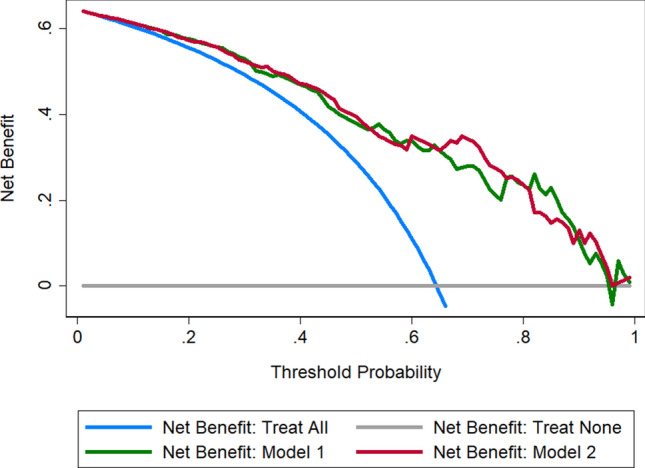
This study aimed to develop and validate a model for the preoperative prediction of the effectiveness of hysteroscopic resection of a uterine cesarean niche in patients with postmenstrual spotting. The predictive model was developed in a primary prospective cohort consisting of 208 patients with niche treated by hysteroscopic resection. Multivariable logistic regression analysis was performed to develop the predictive model, which incorporated preoperative menstrual characteristics and magnetic resonance imaging (MRI) findings. Surgical efficacy was defined as a decrease in postmenstrual spotting duration of at least 3 days at the 3-month follow-up compared with baseline. The predictive model was presented with a nomogram, and the performance was assessed with respect to its calibration, discrimination, and clinical use. Internal validation was performed using tenfold cross-validation. The predictive factors in the final model were as follows: preoperative menstrual duration, thickness of the residual myometrium (TRM), length, TRM/thickness of the adjacent myometrium ratio, angle γ, area, and presence of a lateral branch of the niche. The model showed good performance in predicting the effectiveness of hysteroscopic niche resection. Incorporating the preoperative duration of the menstrual period and MRI findings of the niche into an easy-to-use nomogram facilitates the individualized prediction of the effectiveness of a hysteroscopic niche resection by 26 Fr resectoscope, but multicenter prospective studies are needed to validate it.
Conflict of interest statement
The authors declare no competing interests.
Figures

Similar articles
-
Hysteroscopic resection of a uterine caesarean scar defect (niche) in women with postmenstrual spotting: a randomised controlled trial.BJOG. 2018 Feb;125(3):326-334. doi: 10.1111/1471-0528.14733. Epub 2017 Jul 5. BJOG. 2018. PMID: 28504857 Free PMC article. Clinical Trial.
-
Clinical Success Rate of Extensive Hysteroscopic Cesarean Scar Defect Excision and Correlation to Histologic Findings.J Minim Invasive Gynecol. 2020 Jan;27(1):129-134. doi: 10.1016/j.jmig.2019.03.001. Epub 2019 Mar 8. J Minim Invasive Gynecol. 2020. PMID: 30858053
-
The HysNiche trial: hysteroscopic resection of uterine caesarean scar defect (niche) in patients with abnormal bleeding, a randomised controlled trial.BMC Womens Health. 2015 Nov 12;15:103. doi: 10.1186/s12905-015-0260-8. BMC Womens Health. 2015. PMID: 26563197 Free PMC article. Clinical Trial.
-
Isthmocele: an overview of diagnosis and treatment.Rev Assoc Med Bras (1992). 2019 Jun 3;65(5):714-721. doi: 10.1590/1806-9282.65.5.714. Rev Assoc Med Bras (1992). 2019. PMID: 31166450 Review.
-
Cesarean scar defects: management of an iatrogenic pathology whose prevalence has dramatically increased.Fertil Steril. 2020 Apr;113(4):704-716. doi: 10.1016/j.fertnstert.2020.01.037. Fertil Steril. 2020. PMID: 32228874 Review.
Cited by
-
Laparoscopic Isthmocele Repair: Efficacy and Benefits before and after Subsequent Cesarean Section.J Clin Med. 2021 Dec 10;10(24):5785. doi: 10.3390/jcm10245785. J Clin Med. 2021. PMID: 34945080 Free PMC article.
-
Isthmoceles - Accuracy of imaging diagnosis and clinical correlation with histology: A prospective cohort study.Facts Views Vis Obgyn. 2024 Jun;16(2):173-183. doi: 10.52054/FVVO.16.2.021. Facts Views Vis Obgyn. 2024. PMID: 38950531 Free PMC article.
-
Hysteroscopic niche resection can effectively reduce the niche volume, increase residual myometrial thickness, and improve postmenstrual spotting symptoms.Arch Gynecol Obstet. 2025 Jul;312(1):207-218. doi: 10.1007/s00404-025-07980-1. Epub 2025 Mar 5. Arch Gynecol Obstet. 2025. PMID: 40038130 Free PMC article.
-
Prevalence, definition, and etiology of cesarean scar defect and treatment of cesarean scar disorder: A narrative review.Reprod Med Biol. 2023 Aug 9;22(1):e12532. doi: 10.1002/rmb2.12532. eCollection 2023 Jan-Dec. Reprod Med Biol. 2023. PMID: 37577060 Free PMC article. Review.
-
Fantastic niches and where to find them: the current diagnosis and management of uterine niche.Facts Views Vis Obgyn. 2022 Mar;14(1):37-47. doi: 10.52054/FVVO.14.1.003. Facts Views Vis Obgyn. 2022. PMID: 35373546 Free PMC article.
References
-
- van der Voet LF, Bij de Vaate AM, Veersema S, Brolmann HA, Huirne JA. Long-term complications of caesarean section The niche in the scar: A prospective cohort study on niche prevalence and its relation to abnormal uterine bleeding. BJOG. 2014;121:236–244. doi: 10.1111/1471-0528.12542. - DOI - PubMed
Publication types
MeSH terms
LinkOut - more resources
Full Text Sources
Medical
