Clinical Trial
. 2021 Mar;18(3):604-612.
doi: 10.1038/s41423-020-00557-9. Epub 2020 Oct 15.

Unique immunological profile in patients with COVID-19

Affiliations
Clinical Trial

Unique immunological profile in patients with COVID-19

Stefania Varchetta et al. Cell Mol Immunol. 2021 Mar.

Abstract

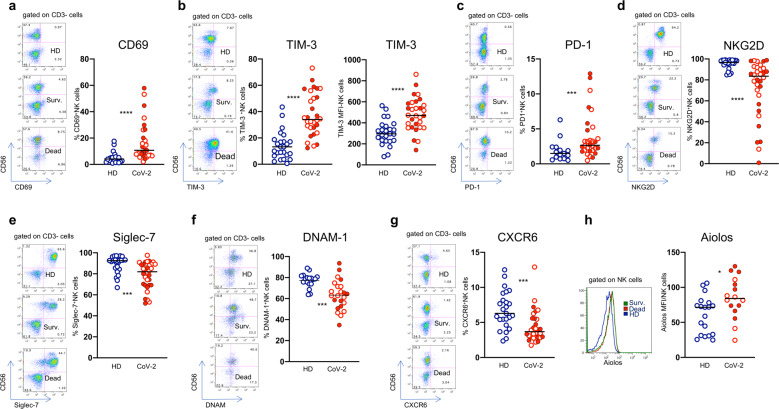
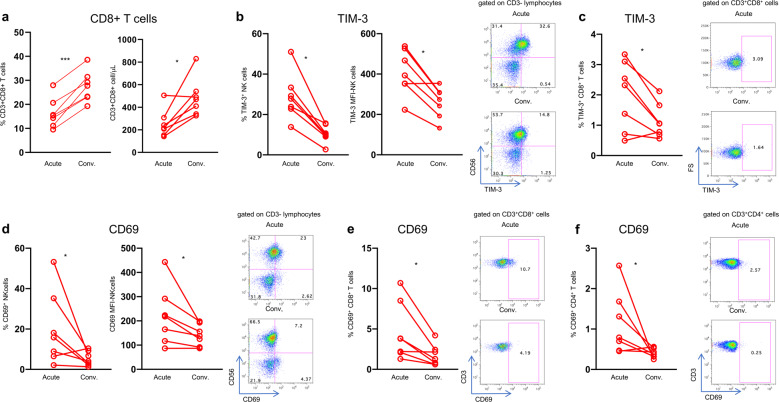
The relationship between severe acute respiratory syndrome coronavirus-2 (SARS-CoV-2) and host immunity is poorly understood. We performed an extensive analysis of immune responses in 32 patients with severe COVID-19, some of whom succumbed. A control population of healthy subjects was included. Patients with COVID-19 had an altered distribution of peripheral blood lymphocytes, with an increased proportion of mature natural killer (NK) cells and low T-cell numbers. NK cells and CD8+ T cells overexpressed T-cell immunoglobulin and mucin domain-3 (TIM-3) and CD69. NK cell exhaustion was attested by increased frequencies of programmed cell death protein 1 (PD-1) positive cells and reduced frequencies of natural killer group 2 member D (NKG2D)-, DNAX accessory molecule-1 (DNAM-1)- and sialic acid-binding Ig-like lectin 7 (Siglec-7)-expressing NK cells, associated with a reduced ability to secrete interferon (IFN)γ. Patients with poor outcome showed a contraction of immature CD56bright and an expansion of mature CD57+ FcεRIγneg adaptive NK cells compared to survivors. Increased serum levels of IL-6 were also more frequently identified in deceased patients compared to survivors. Of note, monocytes secreted abundant quantities of IL-6, IL-8, and IL-1β which persisted at lower levels several weeks after recovery with concomitant normalization of CD69, PD-1 and TIM-3 expression and restoration of CD8+ T cell numbers. A hyperactivated/exhausted immune response dominate in severe SARS-CoV-2 infection, probably driven by an uncontrolled secretion of inflammatory cytokines by monocytes. These findings unveil a unique immunological profile in COVID-19 patients that will help to design effective stage-specific treatments for this potentially deadly disease.

Keywords: COVID-19; IL6; Monocytes; NK cells; TIM-3.


Conflict of interest statement

The authors declare no competing interests.

Figures

Fig. 1
Fig. 1
NK cell characterization in SARS-CoV-2 infection. a Frequency and absolute count of CD3-CD56 + NK cells. b Frequency of CD56bright NK cells, (c) Mature CD57+ NK cells, (d) FcεRIγ negative CD56+/CD57+ NK cells in PBMC from healthy donors and SARS-CoV-2 patients. Representative dot plots are shown on the left of each graph. Full red symbols indicate deceased patients. Middle bars represent medians. The Mann–Whitney U test was used to compare the two groups. *p < 0.05, **p < 0.01, ***p < 0.001, ****p < 0.0001
Fig. 2
Fig. 2
NK cells show an exhausted phenotype in patients with COVID-19. Frequencies of (a) CD69- and (b) TIM-3-expressing NK cells in healthy donors (HD) and patients with COVID-19 (CoV-2) and corresponding representative dot plots. c Levels of expressions of TIM-3 checkpoint molecule on NK cells. Proportion of (d) PD-1-, (e) NKG2D-, (f) Siglec-7-, (g) DNAM-1-, and (h) CXCR6- positive NK cells and corresponding representative dot plots. i Intracellular Aiolos expression in NK cells, expressed as Mean Fluorescence Intensity (MFI). Representative histogram of Aiolos expression on NK cells from a HD (blu line), Survived (green line) and Dead patients (red line). Middle bars represent medians. Full red symbols indicate deceased patients. The Mann–Whitney U test was used to compare the two groups. *p < 0.05, ***p < 0.001, ****p < 0.0001
Fig. 3
Fig. 3
NK cell defective function in patients with COVID-19. a Degranulation and IFNγ production by total NK cell after stimulation with SW480. b, c Degranulation and IFNγ production by total NK cell (CD3-/CD56+) and CD56bright after stimulation with K562 cells. a, b, c Representative IFNγ and CD107a dot plots in COVID-19 patients (CoV-2) and controls (HD) are shown on the left of each panel. Middle bars represent medians. Full red symbols indicate deceased patients. The Mann–Whitney U test was used to compare the two groups. *p < 0.05. d CD107a and IFNγ expression negatively correlate with C-reactive protein (CRP) values. The Pearson test was used to examine correlations
Fig. 4
Fig. 4
T cells show a hyperactivated/exhausted phenotype during COVID-19 infection. Phenotype of circulating CD4+ and CD8+ T cells from healthy donor (HD) and SARS-Cov-2 infected patients (CoV-2). Frequencies and absolute numbers of circulating (a) CD4 and (b) CD8 T cells. c, d Expression of the CD69 activation marker and (e, f) of the TIM-3 checkpoint molecule on CD8+ and CD4+ T cells. g CXCR6-expressing CD8 T cells. e Intracellular Aiolos expression, expressed as Mean Fluorescence Intensity (MFI). Representative histogram of Aiolos expression on CD8 + T cells from a HD (blu line), Survived (green line) and Dead patients (red line). Middle bars represent medians. Full red symbols indicate deceased patients. The Mann–Whitney U test was used to compare the two groups. *p < 0.05, ***p < 0.001, ****p < 0.0001
Fig. 5
Fig. 5
Recovery of CD8 T cells and immune reconstitution in convalescing patients. a Frequency and absolute numbers of peripheral blood circulating CD8 + T cells in COVID-19 patients during the acute and convalescent (Conv.) phases. b Perecentages (left) and levels of expression (MFI, middle) of TIM-3 molecule by NK cells. Representative dot plots are shown (right). c Proportions of TIM-3 positive CD8 + T cells and representative dot plots. d Frequency of CD69-expressing NK cells (left) and MFI of the early activation marker CD69 on NK cells (middle). Representative dot plots are shown (right). e, f Frequency of CD69-expressing CD8 and CD4 T cells and corresponding representative dot plots. Paired data were analyzed by the Wilcoxon signed rank test. *p < 0.05, **p < 0.01, ***p < 0.001
Fig. 6
Fig. 6
Elevated serum inflammatory cytokines normalize after recovery from SARS-CoV-2 infection. ac Left Panel: Serum levels of (a) IL-6, (b) IL-8 and (c) IL-10 in healthy donors (HD) and SARS-CoV-2 patients (CoV-2). Middle bars represent medians. Full red symbols indicate deceased patients. The Mann–Whitney U test was used to compare the two groups. ac Right panel: Serum levels of (a) IL-6, (b) IL-8 and (c) IL-10 in the acute phase and after recovery. Paired data were analyzed by the Wilcoxon signed rank test. *p < 0.05, **p < 0.01, ***p < 0.001, ****p < 0.0001. d, e Correlation of IL-6 with LDH and CRP. f, g Correlation of IL-10 with LDH and PCR. The Pearson test was used to examine correlations
Fig. 7
Fig. 7
Serum inflammatory cytokines are produced by monocytes in COVID-19. Cytokine detection in ex vivo freshly isolated monocytes from healthy donors (HD), patients with COVID-19 (CoV-2) and recovered individuals (Conv.). a IL-6-, (b) IL-8- and (c) IL-1β-producing monocytes. ac Middle bars represent medians. d Representative dot plots illustrate the gating strategy used. The Mann–Whitney U test was used to compare the two groups. *p < 0.05, **p < 0.01, ***p < 0.001, ****p < 0.0001

References

    1. WHO Coronavirus Disease (COVID-19) Dashboard. https://covid19.who.int/.
    1. Huang C, et al. Clinical Features of Patients Infected With 2019 Novel Coronavirus in Wuhan, China. Lancet. 2020;395:497–506. doi: 10.1016/S0140-6736(20)30183-5. - DOI - PMC - PubMed
    1. Hoffmann M, et al. SARS-CoV-2 Cell Entry Depends on ACE2 and TMPRSS2 and is blocked by a clinically proven protease inhibitor. Cell. 2020;181:271–280. doi: 10.1016/j.cell.2020.02.052. - DOI - PMC - PubMed
    1. Ramos Casals M, et al. Adult haemophagocytic syndrome. Lancet. 2014;383:1503–1516. doi: 10.1016/S0140-6736(13)61048-X. - DOI - PubMed
    1. Ruan Q, et al. Clinical Predictors of Mortality Due to COVID-19 Based on an Analysis of Data of 150 Patients From Wuhan, China. Intensive Care Med. 2020;46:846–848. doi: 10.1007/s00134-020-05991-x. - DOI - PMC - PubMed

Publication types