. 2019;50(2):https://doi.org/10.1007/s11661-018-5019-z.

Solidification of Ni-Re Peritectic Alloys

Affiliations

Solidification of Ni-Re Peritectic Alloys

W J Boettinger et al. Metall Mater Trans A Phys Metall Mater Sci. 2019.

Abstract

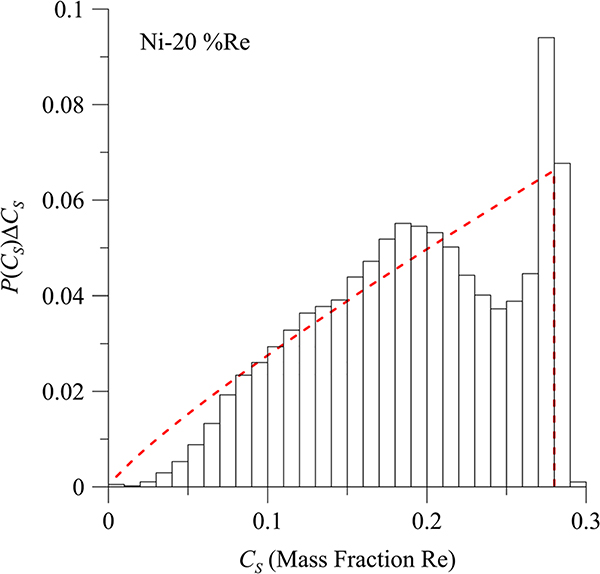
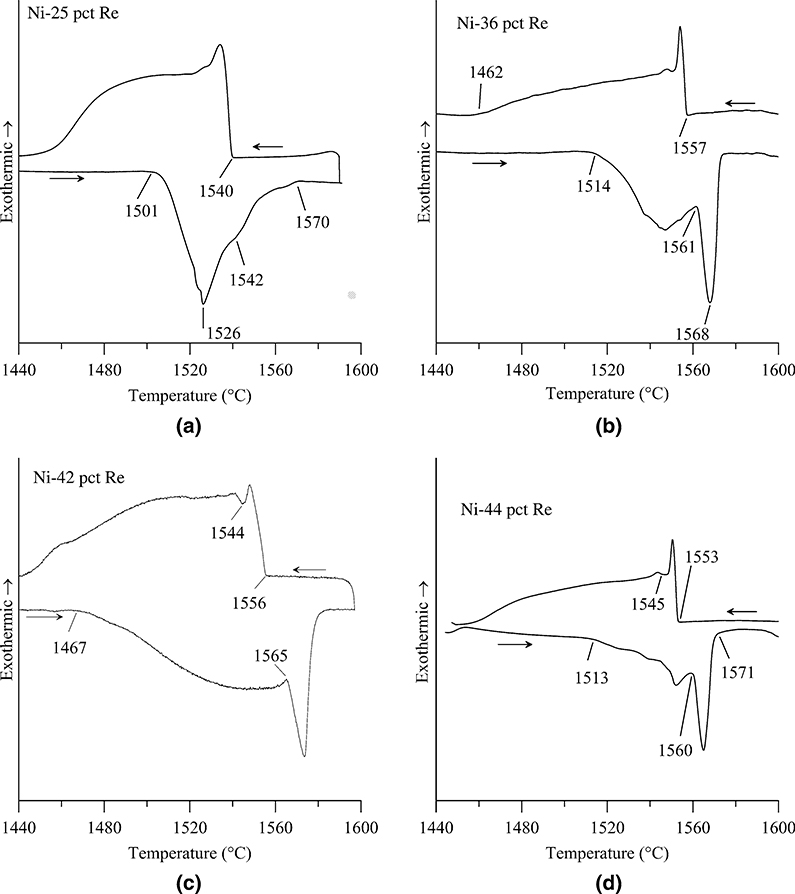
Differential thermal analysis (DTA) and microstructural and microprobe measurements of DTA and as-cast Ni-Re alloys with compositions between 0.20 and 0.44 mass fraction Re provide information to resolve differences in previously published Ni-Re phase diagrams. This investigation determines that the peritectic invariant between liquid, Re-rich hexagonal close packed and Ni-rich face center cubic phases, L + HCP → FCC, occurs at 1561.1 °C ± 3.4 °C (1σ) with compositions of liquid, FCC and HCP phases of 0.283 ± 0.036, 0.436 ± 0.026, and 0.828 ± 0.037 mass fraction Re, respectively. Analysis of the microsegregation in FCC alloys yields a partition coefficient for solidification, k = 1.54 ± 0.09 (mass frac./mass frac.). A small deviation from Scheil behavior due to dendrite tip kinetics is documented in as-cast samples. No evidence of an intermetallic phase is observed.


Figures

Fig. B1—
Fig. B1—
Fraction of pixels P(CSCS measured with composition between CS and CS + ΔCS for the Ni-20 pct Re as-cast alloy (ΔCS = 0.01 mass fraction Re). Dashed red line shows Scheil behavior for k = 1.54.
Fig. C1—
Fig. C1—
Three plots: (a) dendrite tip solid composition vs dendrite tip velocity, (b) fraction solid at the tip vs velocity and (c) the microsegregation profile, solid composition vs fraction solid for the truncated Scheil model for V = 5 × 10⁻⁵ m/s. The arc connects common values of the velocity on the two graphs. Note the flat composition profile in (c) at small values of fraction solid.
Fig. 1—
Fig. 1—
Ni-Re phase diagram calculated by Huang and Chang[14] (dashed lines) and Yaqoob and Joubert[13] (solid lines). The experiment points from the literature are also shown: black = solvus, blue = solidus, green = liquidus and red = peritectic.
Fig. 2—
Fig. 2—
DTA heating and cooling scans of Ni-Re alloys: (a) Ni-25 pct Re, (b) Ni-36 pct Re, (c) Ni-42 pct Re, and (d) Ni-44 pct Re.
Fig. 3—
Fig. 3—
As-cast structures of (a) Ni-25 pct Re, (b) Ni-36 pct Re, and (c) Ni-44 pct Re.
Fig. 4—
Fig. 4—
Views of DTA samples, (a) Ni-25 pct Re, (b) Ni-36 pct Re, and (c) Ni-44 pct Re.
Fig. 5—
Fig. 5—
Microprobe line scans from (a) Ni-36 pct Re DTA sample and (b) Ni-42 pct Re DTA samples.
Fig. 6—
Fig. 6—
As-cast microstructure of single-phase FCC alloys: (a) Ni-20 pct Re, (b) Ni-25 pct Re, and (c): randomized pixel composition measurements on (100 μm × 100 μm) areas shown in (a) and (b) sorted from highest to lowest Re content. Also shown are best fits to the Scheil model using the measured average compositions of 18.2 pct Re and 22.9 pct Re and using partition coefficients of 1.52 and 1.64, red and blue respectively. Also shown are fits for the two alloys using a composition-dependent partition coefficient as described in “Appendix A”.
Fig. 7—
Fig. 7—
EDS and backscatter image gray scale line scans across dendritic structure of the top part of Fig. 6(a).
Fig. 8—
Fig. 8—
—(a) Backscatter image and (b) EBSD colored “all Euler angle” map of Ni-20 pct Re as-cast alloy. Location of grain boundaries are overlaid in the BS image as white lines.
Fig. 9—
Fig. 9—
Microstructure of as-cast Ni-42 pct Re sample with locations used for spot mode microprobe measurements given in Table II.
Fig. 10—
Fig. 10—
As-cast microstructure and EDS line scan: (a) Ni-36 pct Re, (b) Ni 42 pct Re.
Fig. 11—
Fig. 11—
Ni-42 pct Re as cast structure. (a) Backscattered image, (b) EBSD phase map (blue = FCC and yellow = HCP), and (c) Euler angle map showing large FCC grain (dark blue) surrounding HCP dendrite despite light gray dark gray contrast seen in (a).
Fig. 12—
Fig. 12—
(a) HAADF TEM image of as-cast Ni-42 pct Re alloy showing (A) Re-rich HCP dendrite, (B) intermediate Re content mottled region and (C) featureless FCC region. Brightness indicates average atomic number. (b) SADP from mottled region shows single orientation of FCC and multiple orientations of HCP particles in (111)FCC/(0001)HCP orientation relation. (c) SADP from featureless region showing single-phase FCC.
Fig. 13—
Fig. 13—
HAADF STEM image from mottled region in Fig. 12 showing fine rod-like Re-rich particles (light) embedded in a Ni-rich matrix (dark).
Fig. 14—
Fig. 14—
Ni-42 pct Re cast sample that has been annealed in the DTA at 1400 °C for 2 h followed by 1500 °C for 4 h. The variations in contrast in the FCC phase between Re particles have disappeared. Line scan data taken at the position of the dark line are shown.

References

    1. Saunders N and Miodownik AP: CALPHAD (Calculation of Phase Diagrams): A Comprehensive Guide, Pergamon, Oxford, 1998.
    1. Maisel SB, Schindzielorz N, Mottura A, Reed RC, and Müller S: Phys. Rev. B, 2014, vol. 90, p. 094110.
    1. Elliott RP: Constitution of Binary Alloys, First Supplement, McGraw-Hill, New York, 1965, pp. 666–67.
    1. Pogodin SA and Skryabina MA: Izv. Sektora Fiz.-Khim. Analiza, Inst. Obshch. i Neorgan. Khim., Akad. Nauk. SSSR, 1954, vol. 25, pp. 81–88.
    1. Massalski TB: Binary Alloy Phase Diagrams, ASM International, Materials Park, 1990.

LinkOut - more resources