

Anticancer Activity of Modified Tongyou Decoction on Eca109 Esophageal Cancer Cell Invasion and Metastasis through Regulation of the Epithelial-Mesenchymal Transition Mediated by the HIF-1 α-Snail Axis
- PMID: 33062005
- PMCID: PMC7542498
- DOI: 10.1155/2020/3053506
Anticancer Activity of Modified Tongyou Decoction on Eca109 Esophageal Cancer Cell Invasion and Metastasis through Regulation of the Epithelial-Mesenchymal Transition Mediated by the HIF-1 α-Snail Axis
Abstract
Background: To explore the activity of Modified Tongyou Decoction (MTD) against Eca109 esophageal cancer (EC) cell invasion and metastasis and to ascertain the mechanism of its anticancer activity during the epithelial-mesenchymal transition (EMT) as mediated by the HIF-1α-Snail axis.
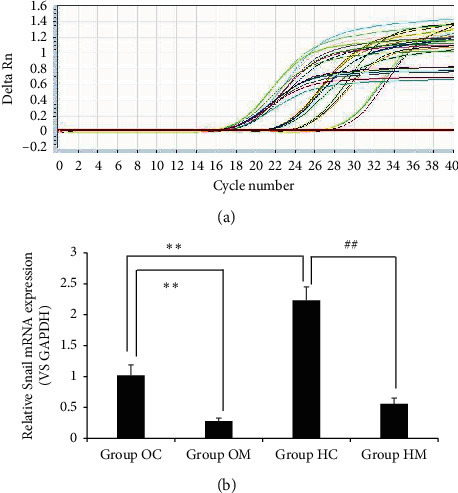
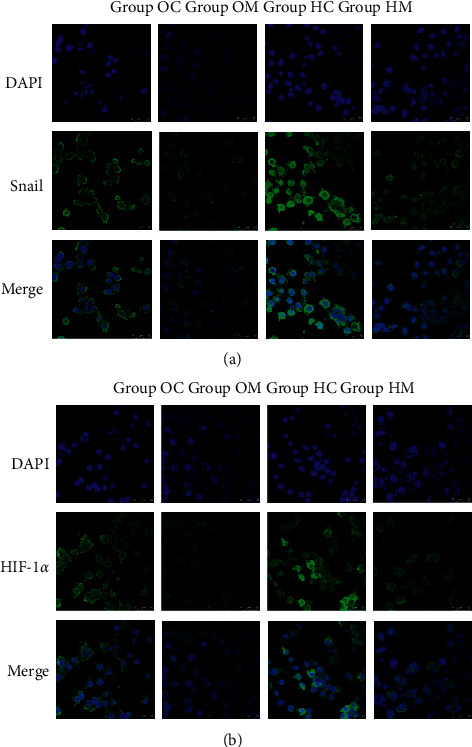
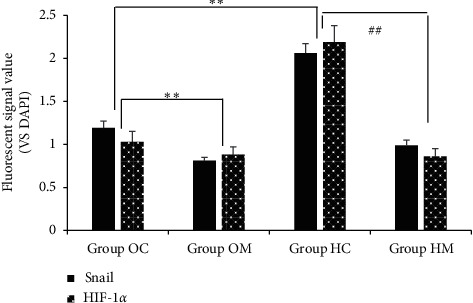
Methods: Herbal compounds were prepared by ethanol extraction, and 6 herbs composing into MTD were dipped in water-free ethanol and filtered. The filtrate was collected and centrifuged. The remains were concentrated into a paste which was adjusted to 5000mg/mL concentration with DMSO. PBS was used to dilute the herbal solution to the half maximal inhibitory concentration. A hypoxic microenvironment was induced with CoCl2 in RPMI 1640 medium, in which Eca109 cells were cultured. The cytotoxicity of MTD was determined with CCK-8 assay. The activity of MTD against cell invasion and metastasis was explored with scratch assay and transwell assay. Western blot analysis was conducted to analyze the anticancer effects of MTD on the expression of HIF-1α-Snail axis- and EMT-related proteins. Quantitative RT-PCR was used to assess the mRNA expression of Snail. Immunofluorescence labeling was performed to examine how MTD affected the coexpression of Snail and HIF-1α.
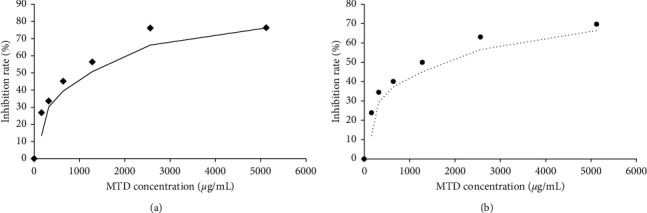
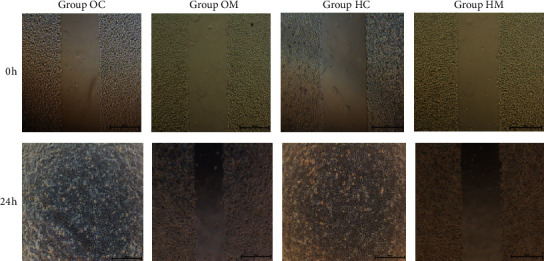
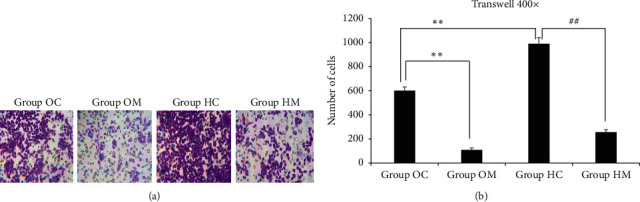
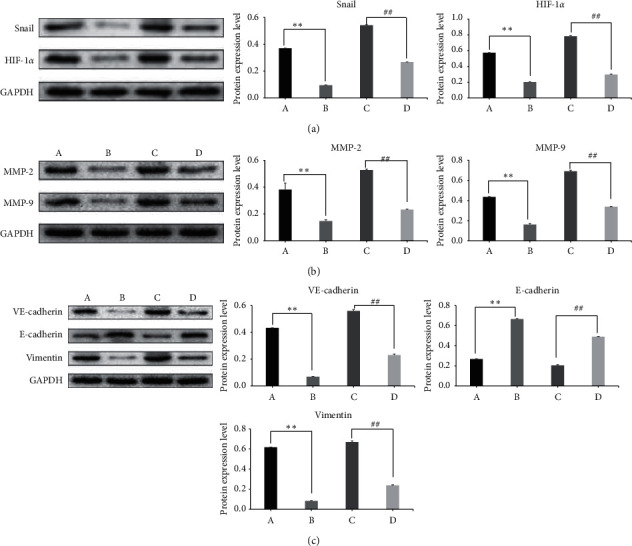
Results: The fifty percent inhibitory dose of MTD was 1410 μg/mL in the normoxic environment and 1823 μg/mL in the hypoxic environment based on the CCK-8 assay. The scratch assay showed that MTD significantly inhibited cell migration in both the normoxic and hypoxic microenvironments compared with the control groups (P < 0.05). The transwell assay showed that MTD significantly inhibited cell invasion in both the normoxic and hypoxic environments compared with the control groups (P < 0.05). Western blot showed that MTD significantly inhibited the expression of the HIF-1α, Snail, Vimentin, MMP-2, MMP-9, and VE-cadherin proteins and significantly induced the expression of E-cadherin in both the normoxic and hypoxic microenvironments compared with the control groups (P < 0.05). qRT-PCR indicated that MTD significantly inhibited Snail mRNA expression compared with that in the control groups (P < 0.05). Immunofluorescence assay showed that MTD significantly inhibited the coexpression of HIF-1α and Snail in both the normoxic and hypoxic microenvironments compared with the control groups (P < 0.05).
Conclusion: MTD downregulated HIF-1α-Snail axis- and EMT-related proteins to inhibit EC cell invasion and metastasis in both the normoxic and hypoxic environments.
Copyright © 2020 Yongsen Jia et al.
Conflict of interest statement
The authors declare that they have no conflicts of interest.
Figures
Similar articles
-
Mechanism of Modified Tongyou Decoction and Its Separated Formulas Inhibiting Vasculogenic Mimicry in Esophageal Cancer TE-1 Cells via NF-κB/HIF-1α Axis.Integr Cancer Ther. 2025 Jan-Dec;24:15347354251332590. doi: 10.1177/15347354251332590. Epub 2025 Apr 21. Integr Cancer Ther. 2025. PMID: 40256926 Free PMC article.
-
Hypoxia facilitates epithelial-mesenchymal transition-mediated rectal cancer progress.Genet Mol Res. 2016 Dec 2;15(4). doi: 10.4238/gmr15048936. Genet Mol Res. 2016. PMID: 27966740
-
[Effect of HIF-1α and its mechanism on invasion and metastasis of esophageal carcinoma Eca109 cells in vitro and in vivo].Xi Bao Yu Fen Zi Mian Yi Xue Za Zhi. 2012 Jan;28(1):67-71. Xi Bao Yu Fen Zi Mian Yi Xue Za Zhi. 2012. PMID: 22230507 Chinese.
-
Coenzyme Q0 defeats NLRP3-mediated inflammation, EMT/metastasis, and Warburg effects by inhibiting HIF-1α expression in human triple-negative breast cancer cells.Arch Toxicol. 2023 Apr;97(4):1047-1068. doi: 10.1007/s00204-023-03456-w. Epub 2023 Feb 27. Arch Toxicol. 2023. PMID: 36847822
-
Prognostic significance of hypoxia-inducible factor-1alpha, TWIST1 and Snail expression in resectable non-small cell lung cancer.Thorax. 2009 Dec;64(12):1082-9. doi: 10.1136/thx.2009.115691. Epub 2009 Sep 23. Thorax. 2009. PMID: 19778933 Review.
Cited by
-
Mechanism of Modified Tongyou Decoction and Its Separated Formulas Inhibiting Vasculogenic Mimicry in Esophageal Cancer TE-1 Cells via NF-κB/HIF-1α Axis.Integr Cancer Ther. 2025 Jan-Dec;24:15347354251332590. doi: 10.1177/15347354251332590. Epub 2025 Apr 21. Integr Cancer Ther. 2025. PMID: 40256926 Free PMC article.
-
Donkey Oil-Based Ketogenic Diet Prevents Tumor Progression by Regulating Intratumor Inflammation, Metastasis and Angiogenesis in CT26 Tumor-Bearing Mice.Genes (Basel). 2023 Apr 30;14(5):1024. doi: 10.3390/genes14051024. Genes (Basel). 2023. PMID: 37239383 Free PMC article.
References
-
- Côme C., Arnoux V., Bibeau F., Savagner P. Roles of the transcription factors snail and slug during mammary morphogenesis and breast carcinoma progression. Journal of Mammary Gland Biology and Neoplasia. 2004;9(2):183–193. doi: 10.1023/b:jomg.0000037161.91969.de. - DOI - PMC - PubMed
LinkOut - more resources
Full Text Sources
Research Materials
Miscellaneous
