Study on the Intervention Effect of Qi Gong Wan Prescription on Patients with Phlegm-Dampness Syndrome of Polycystic Ovary Syndrome Based on Intestinal Flora
- PMID: 33062017
- PMCID: PMC7545460
- DOI: 10.1155/2020/6389034
Study on the Intervention Effect of Qi Gong Wan Prescription on Patients with Phlegm-Dampness Syndrome of Polycystic Ovary Syndrome Based on Intestinal Flora
Abstract
Objective: This was a population-based cohort study, to compare the type and structure of intestinal flora in patients with polycystic ovary syndrome (PCOS) with phlegm-dampness syndrome, nonphlegm-dampness syndrome, and normal population. Besides, changes in the intestinal flora and the clinical curative effects of Jiawei Qi Gong Wan on phlegm-dampness syndrome in patients with polycystic ovary syndrome (PCOS) were evaluated. Patients and Methods. A total of 22 patients with PCOS with phlegm-dampness syndrome, 21 PCOS patients with nonphlegm-dampness syndrome, and 20 control volunteers were selected for this study. The general index, sex hormone index, fasting blood glucose (FPG), and serum fasting insulin (FINS) were determined in each of the groups. The intestinal flora of each group was determined by the 16s rDNA high-throughput sequencing technique. Besides, the PCOS with phlegm-dampness syndrome group was treated with Jiawei Qi Gong Wan, and the changes in TCM syndrome, sex hormone index, BMI, WHR, FPG, FINS, HOMA-IR, and intestinal flora were determined before and after treatment.
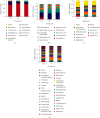
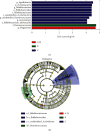
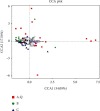
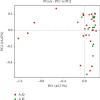
Results: PCOS patients with phlegm-dampness syndrome showed characteristics of obesity and insulin resistance. There were several differences in both structure and function of the intestinal flora between PCOS patients with phlegm-dampness syndrome, PCOS patients with nonphlegm-dampness syndrome, and the control group. An imbalance in the intestinal flora may be a key factor in the pathogenesis of PCOS with phlegm-dampness syndrome and also has a specific influence on glucose and lipid metabolism, obesity, and the menstrual cycle in PCOS patients with phlegm-dampness syndrome. Besides, the imbalance is associated with a decrease in the number of butyrate-producing bacteria, an increase in the number of lipopolysaccharide-producing bacteria, and an increase in proinflammatory bacteria. The intestinal flora in PCOS patients with phlegm-dampness syndrome was found to be linked to obesity, impaired glucose tolerance, and hyperandrogenemia. Treatment with Jiawei Qi Gong Wan was found to increase the diversity of intestinal flora, increase the number of intestinal probiotics, and improve the structure and functional genes of intestinal flora which improved the state of insulin resistance, regulated endocrine metabolism, and improved the overall symptoms.
Conclusions: Intestinal flora imbalance is a key factor in the pathogenesis of PCOS with phlegm-dampness syndrome. Besides, Jiawei Qi Gong Wan improves insulin resistance which is linked to the status of the intestinal flora in PCOS patients with phlegm-dampness syndrome.
Copyright © 2020 Ning Zhang et al.
Conflict of interest statement
The authors declare that there are no conflicts of interest in this study.
Figures







Similar articles
-
[Distribution Laws of PCOS Syndrome Types and Features of Sex Hormone Levels and Glucose Metabolism].Zhongguo Zhong Xi Yi Jie He Za Zhi. 2016 Jul;36(7):801-805. Zhongguo Zhong Xi Yi Jie He Za Zhi. 2016. PMID: 30634205 Chinese.
-
Efficacy of Bushen Huatan Decoction combined with Baduanjin in the treatment of polycystic ovary syndrome with insulin resistance (IR-PCOS), kidney deficiency and phlegm dampness: study protocol for a randomized controlled trial.Trials. 2021 Nov 7;22(1):781. doi: 10.1186/s13063-021-05770-z. Trials. 2021. PMID: 34743745 Free PMC article.
-
Effect of Electro-acupuncture on Expression of IRS-1/PI3K/GLUT4 Pathway in Ovarian Granulosa Cells of Infertile Patients with Polycystic Ovary Syndrome-Insulin Resistance of Phlegm-Dampness Syndrome.Chin J Integr Med. 2021 May;27(5):330-335. doi: 10.1007/s11655-020-3219-z. Epub 2020 Jun 22. Chin J Integr Med. 2021. PMID: 32572779 Clinical Trial.
-
Effects of intestinal flora on polycystic ovary syndrome.Front Endocrinol (Lausanne). 2023 Mar 9;14:1151723. doi: 10.3389/fendo.2023.1151723. eCollection 2023. Front Endocrinol (Lausanne). 2023. PMID: 36967808 Free PMC article. Review.
-
AMERICAN ASSOCIATION OF CLINICAL ENDOCRINOLOGISTS, AMERICAN COLLEGE OF ENDOCRINOLOGY, AND ANDROGEN EXCESS AND PCOS SOCIETY DISEASE STATE CLINICAL REVIEW: GUIDE TO THE BEST PRACTICES IN THE EVALUATION AND TREATMENT OF POLYCYSTIC OVARY SYNDROME - PART 2.Endocr Pract. 2015 Dec;21(12):1415-26. doi: 10.4158/EP15748.DSCPT2. Endocr Pract. 2015. PMID: 26642102 Review.
Cited by
-
Gut Microbiome Composition in Polycystic Ovary Syndrome Adult Women: A Systematic Review and Meta-analysis of Observational Studies.Reprod Sci. 2024 Jul;31(7):1800-1818. doi: 10.1007/s43032-023-01440-4. Epub 2024 Jan 11. Reprod Sci. 2024. PMID: 38212581
-
Serum Levels of PDGF, EGF, and sFlt-1 in Patients with Polycystic Ovary Syndrome and Their Predictive Effects on Pregnancy Outcomes.Evid Based Complement Alternat Med. 2021 Oct 29;2021:7118464. doi: 10.1155/2021/7118464. eCollection 2021. Evid Based Complement Alternat Med. 2021. Retraction in: Evid Based Complement Alternat Med. 2023 Jun 21;2023:9839171. doi: 10.1155/2023/9839171. PMID: 34745297 Free PMC article. Retracted.
-
Observation on the Efficacy of Shouhui Tongbian Capsule in the Treatment of Functional Constipation and Study on Its Regulatory Effect on Intestinal Flora.J Healthc Eng. 2021 Nov 1;2021:9024919. doi: 10.1155/2021/9024919. eCollection 2021. J Healthc Eng. 2021. Retraction in: J Healthc Eng. 2023 Nov 1;2023:9815747. doi: 10.1155/2023/9815747. PMID: 34760145 Free PMC article. Retracted.
-
Effects of TCM on polycystic ovary syndrome and its cellular endocrine mechanism.Front Endocrinol (Lausanne). 2023 May 16;14:956772. doi: 10.3389/fendo.2023.956772. eCollection 2023. Front Endocrinol (Lausanne). 2023. PMID: 37260441 Free PMC article. Review.
-
Cangfu Daotan Wan alleviates polycystic ovary syndrome with phlegm-dampness syndrome via disruption of the PKP3/ERCC1/MAPK axis.J Ovarian Res. 2023 Jul 7;16(1):134. doi: 10.1186/s13048-023-01200-7. J Ovarian Res. 2023. PMID: 37420272 Free PMC article.
References
-
- Fangnan L. Diagnosis and Treatment of TCM Syndromes. Beijing, China: People’s Military Medical Publishing House; 2011.
-
- Martin M. Cutadapt removes adapter sequences from high-throughput sequencing reads. Embnet Journal. 2011;17(1):10–12. doi: 10.14806/ej.17.1.200. - DOI
LinkOut - more resources
Full Text Sources

