

A predictive model for healthcare coverage in Yemen
- PMID: 33062048
- PMCID: PMC7550854
- DOI: 10.1186/s13031-020-00300-1
A predictive model for healthcare coverage in Yemen
Abstract
Introduction: The ongoing war in Yemen continues to pose challenges for healthcare coverage in the country especially with regards to critical gaps in information systems needed for planning and delivering health services. Restricted access to social services including safe drinking water and sanitation systems have likely led to an increase in the spread of diarrheal diseases which remains one of greatest sources of mortality in children under 5 years old. To overcome morbidity and mortality from diarrheal diseases among children in the context of severe information shortages, a predictive model is needed to determine the burden of diarrheal disease on Yemeni children and their ability to reach curative health services through an estimate of healthcare coverage. This will allow for national and local health authorities and humanitarian partners to make better informed decisions for planning and providing health care services.
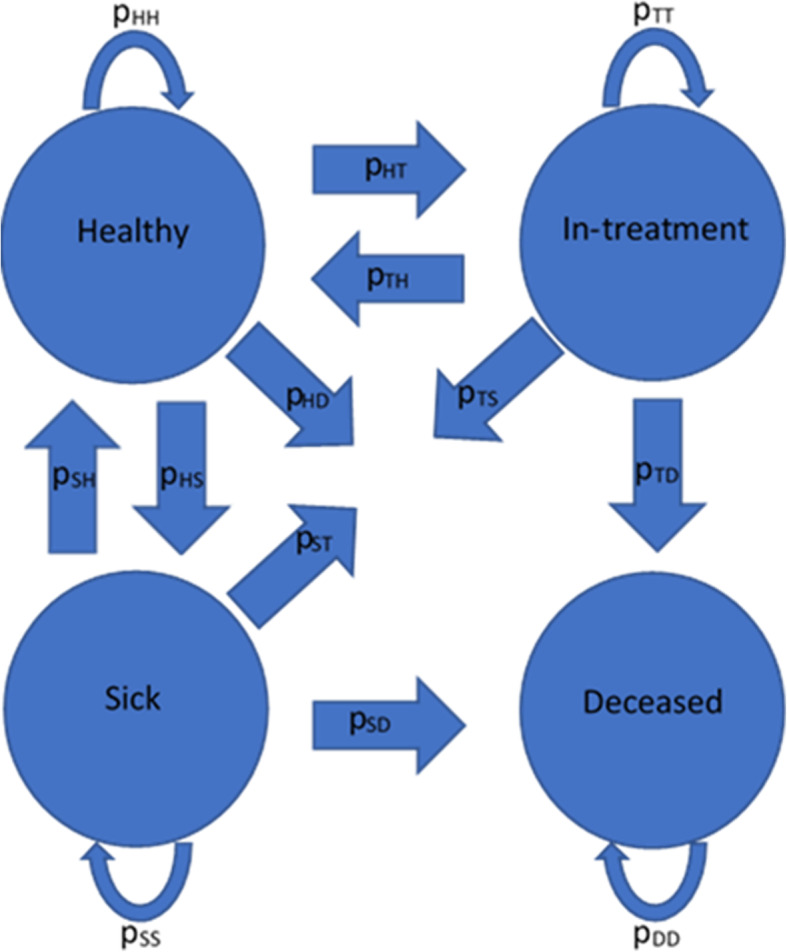
Methods: A probabilistic Markov model was developed based on an analysis of Yemen's health facilities' clinical register data provided by UNICEF. The model combines this health system data with environmental and conflict-related factors such as the destruction of infrastructure (roads and health facilities) to fill in gaps in population-level data on the burden of diarrheal diseases on children under five, and the coverage rate of the under-five sick population with treatment services at primary care facilities. The model also provides estimates of the incidence rate, and treatment outcomes including treatment efficacy and mortality rate.
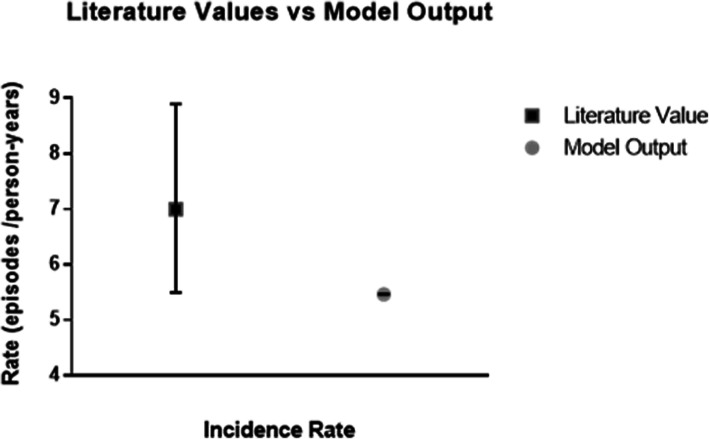
Results: By using alternatives to traditional healthcare data, the model was able to recreate the observed trends in treatment with no significant difference compared to provided validation data. Once validated, the model was used to predict the percent of sick children with diarrhea who were able to reach, and thus receive, treatment services (coverage rate) for 2019 which ranged between an average weekly minimum of 1.73% around the 28th week of the year to a weekly maximum coverage of just over 5% around the new year. These predictions can be translated into policy decisions such as when increased efforts are needed to reach children and what type of service delivery modalities may be the most effective.
Conclusion: The model developed and presented in this manuscript shows a seasonal trend in the spread of diarrheal disease in children under five living in Yemen through a novel incorporation of weather, infrastructure and conflict parameters in the model. Our model also provides new information on the number of children seeking treatment and how this is influenced by the ongoing conflict. Despite the work of the national and local health authorities with the support of aid organizations, during the mid-year rains up to 98% of children with diarrhea are unable to receive treatment services. Thus, it is recommended that community outreach or other delivery modalities through which services are delivered in closer proximity to those in need should be scaled up prior to and during these periods. This would serve to increase number of children able to receive treatment by lessening the prohibitive travel burden, or access constraint, on families during these times.
Keywords: Childhood illnesses; Computational modeling; Diarrheal disease; Healthcare coverage; Markov model; Yemen.
© The Author(s) 2020.
Conflict of interest statement
Competing interestsThe authors state that the institutions of Boston University (BU) and the United Nations International Children’s Fund (UNICEF) have entered into a financial partnership during the course of this publication.
Figures


References
-
- Health system in Yemen close to collapse. 2015. Retrieved from https://www.who.int/bulletin/volumes/93/10/15-021015.pdf. - PMC - PubMed
-
- World Health Organization . Health systems in Yemen. 2016.
LinkOut - more resources
Full Text Sources
