Review
. 2020 Oct 2;4(4):041501.
doi: 10.1063/5.0018504. eCollection 2020 Dec.

Quantification and classification of potassium and calcium disorders with the electrocardiogram: What do clinical studies, modeling, and reconstruction tell us?

Affiliations
Review

Quantification and classification of potassium and calcium disorders with the electrocardiogram: What do clinical studies, modeling, and reconstruction tell us?

N Pilia et al. APL Bioeng. .

Abstract

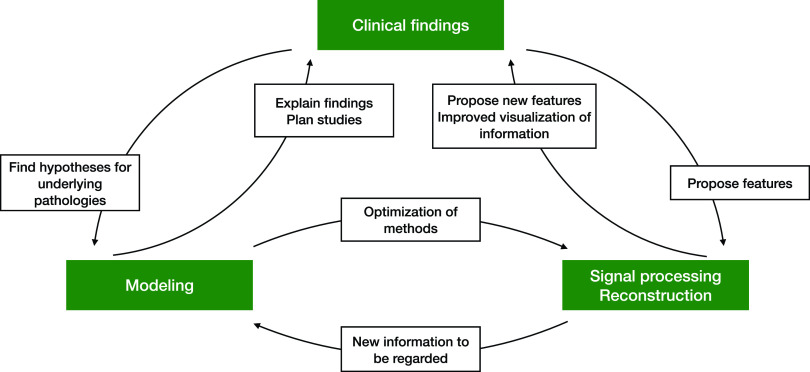
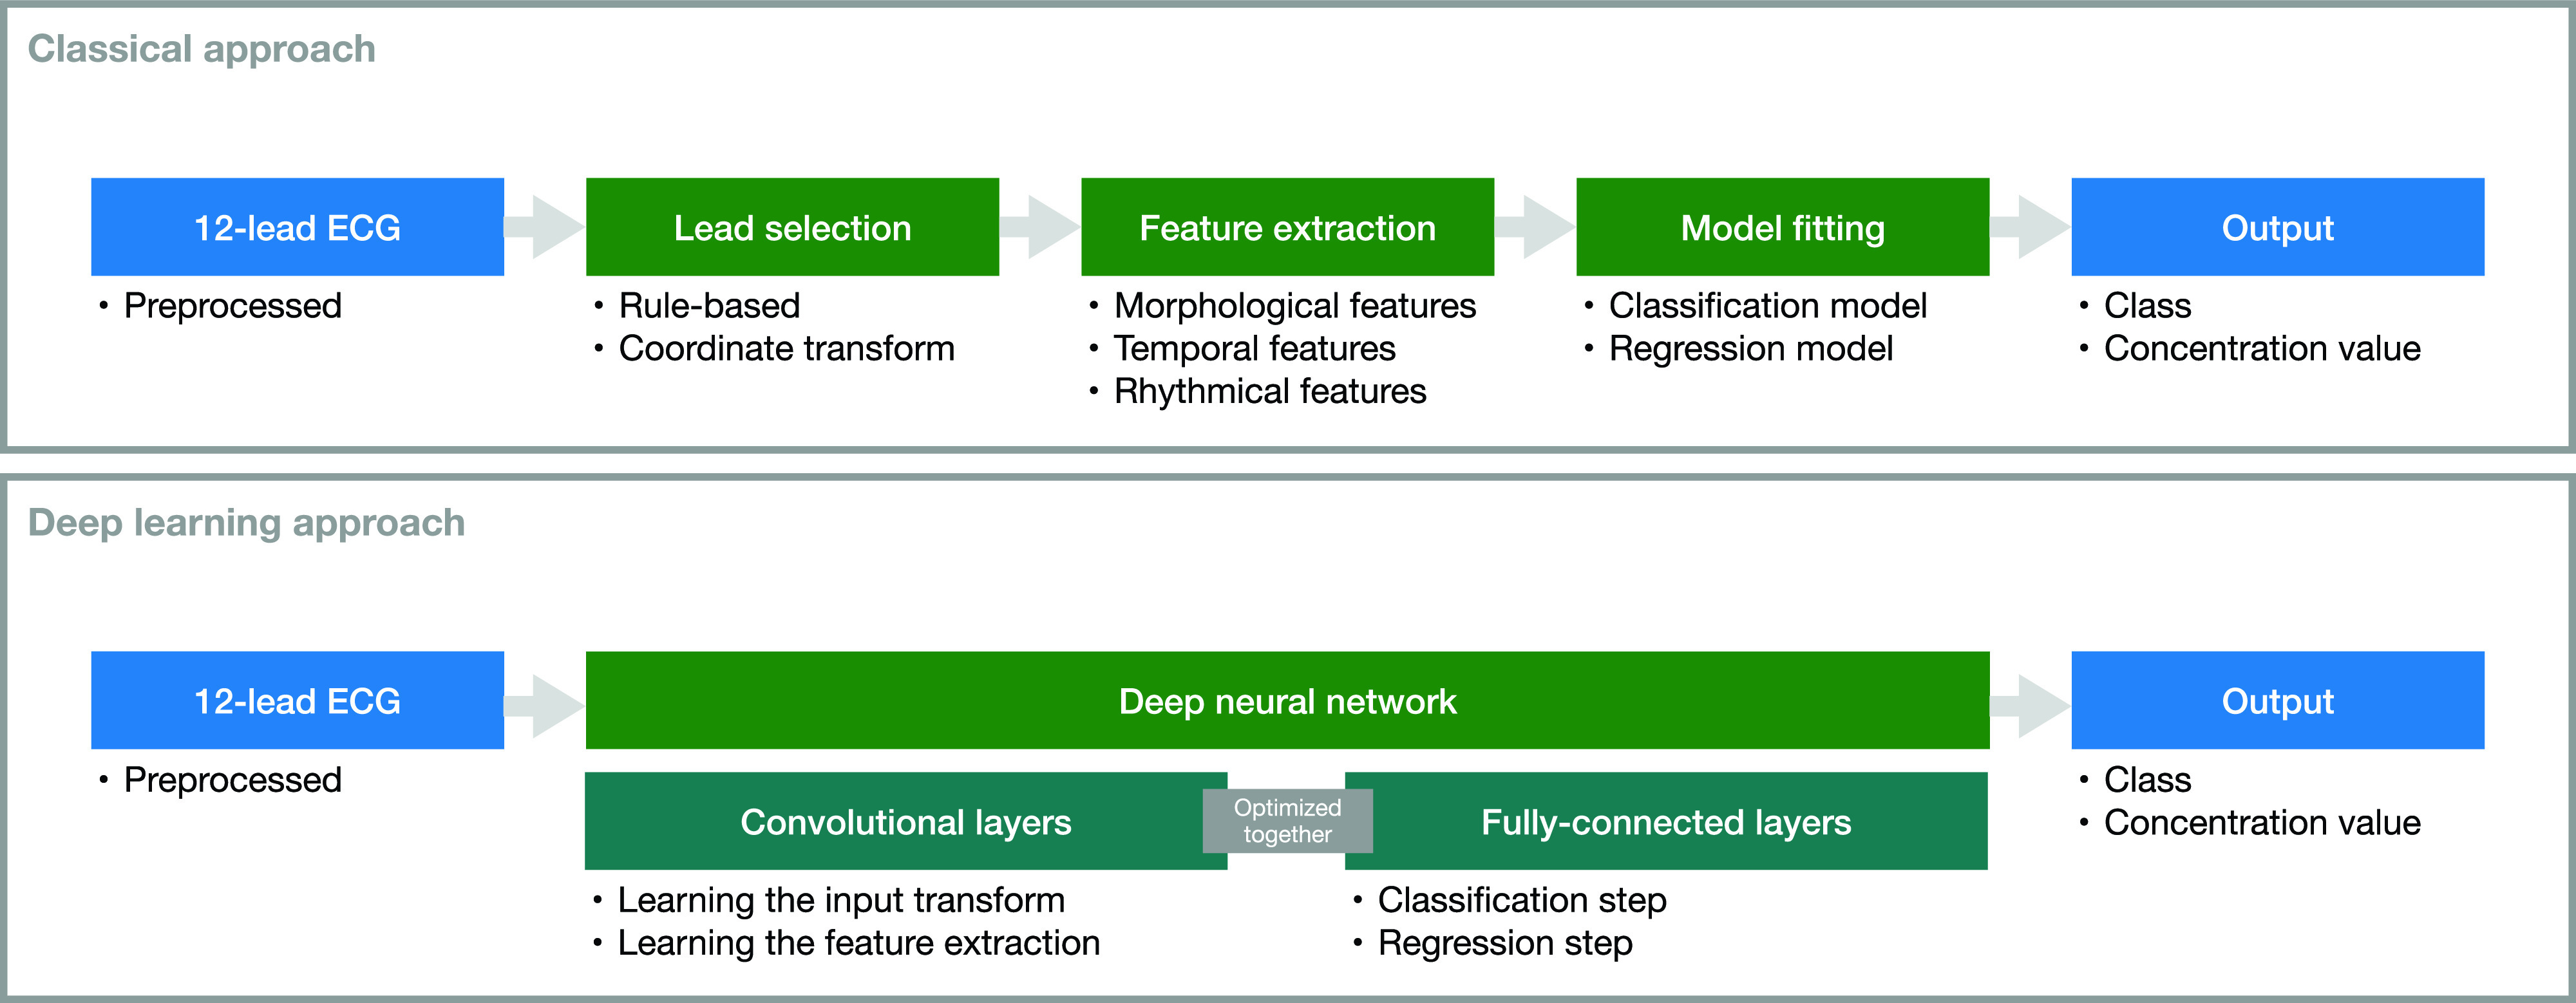
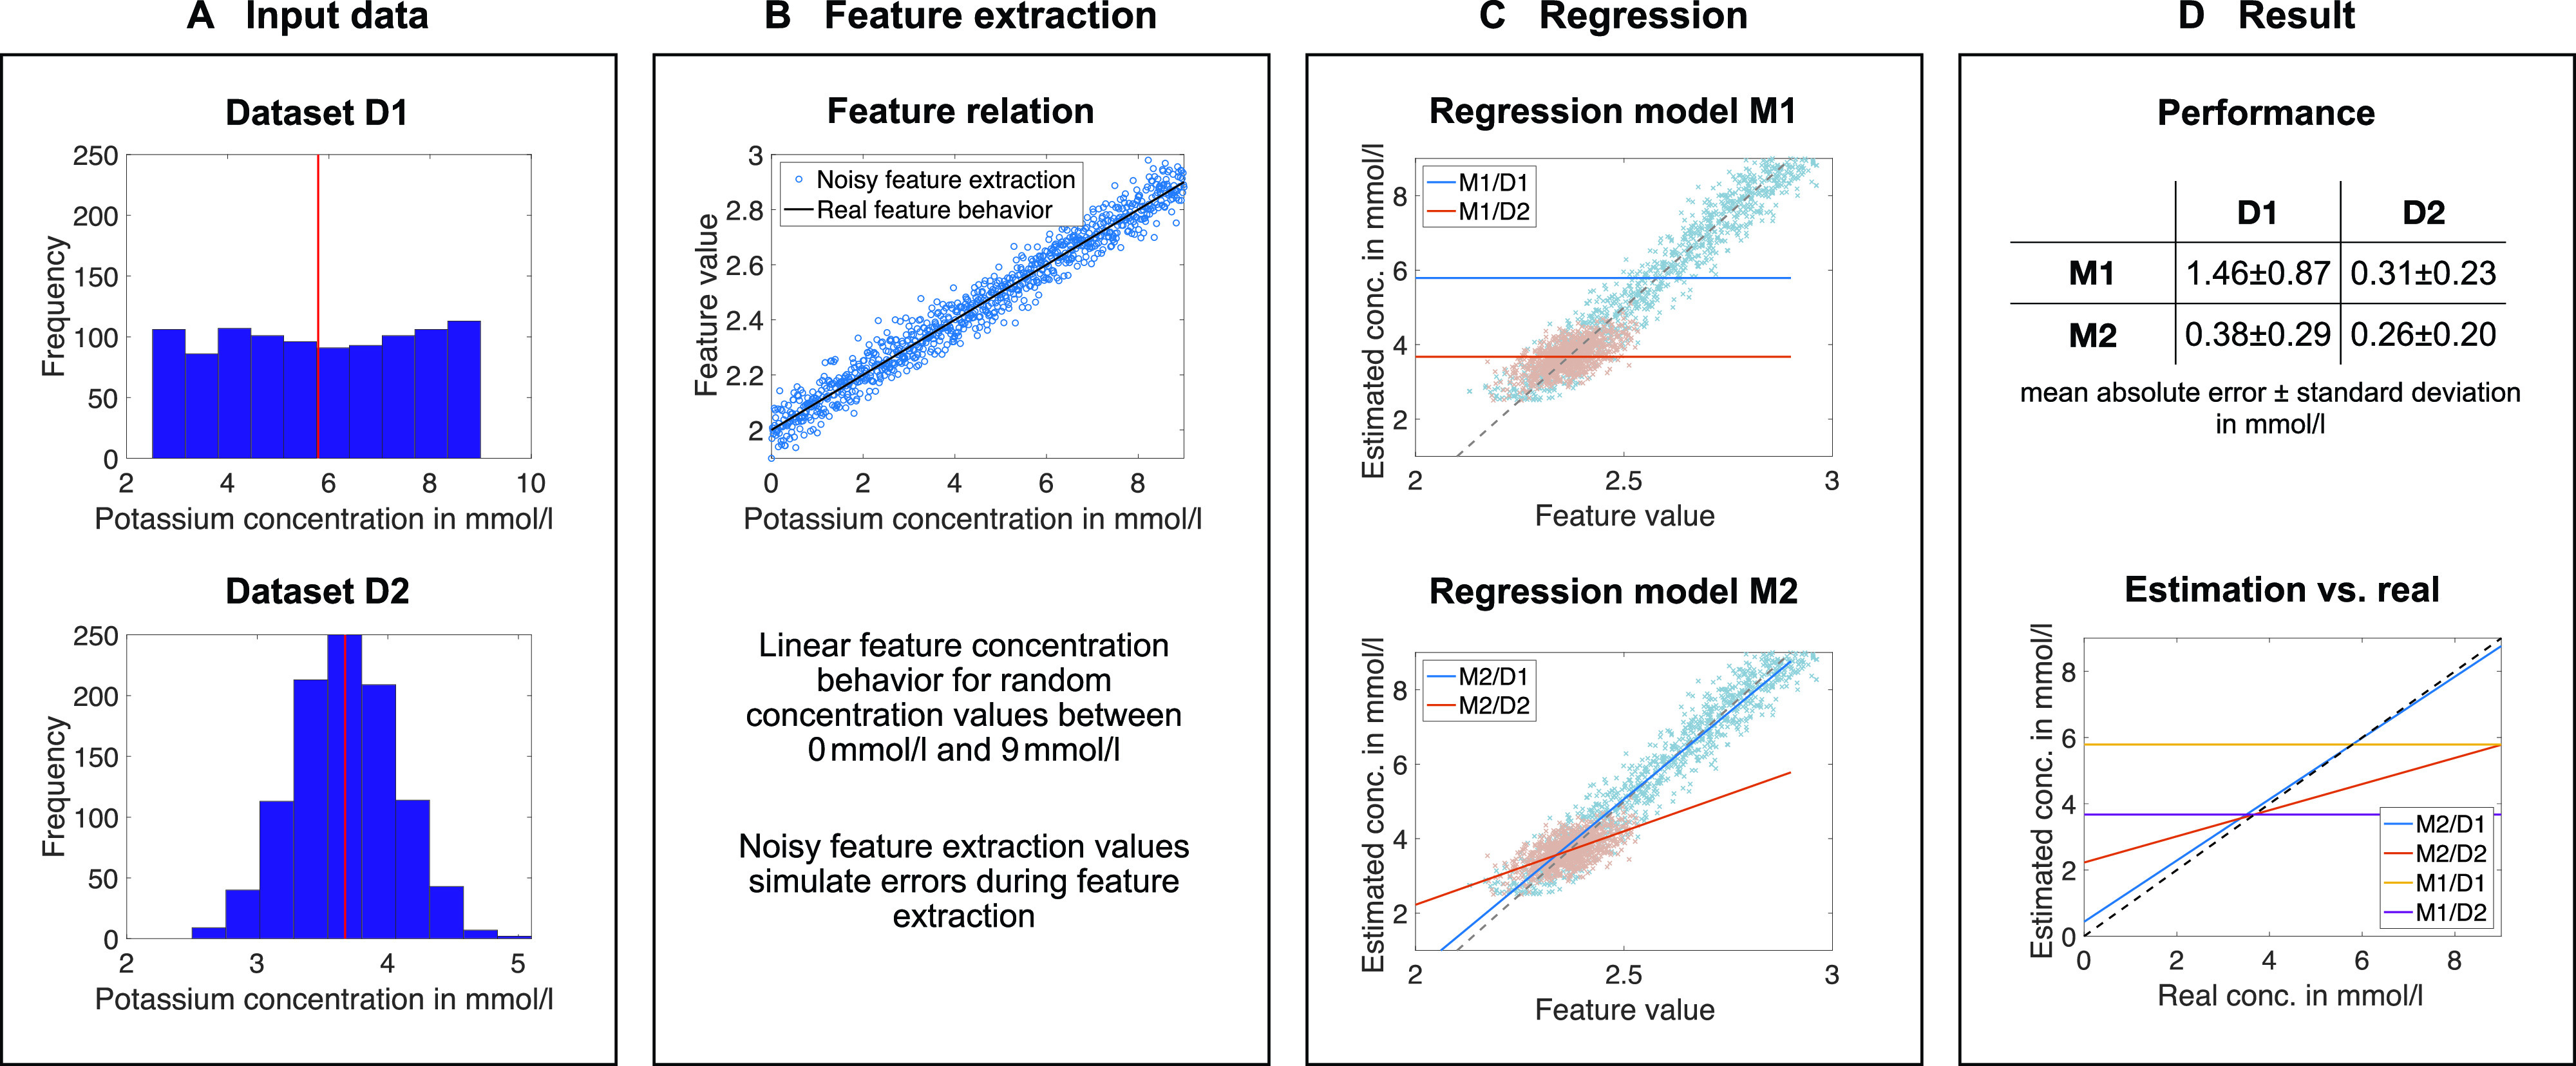
Diseases caused by alterations of ionic concentrations are frequently observed challenges and play an important role in clinical practice. The clinically established method for the diagnosis of electrolyte concentration imbalance is blood tests. A rapid and non-invasive point-of-care method is yet needed. The electrocardiogram (ECG) could meet this need and becomes an established diagnostic tool allowing home monitoring of the electrolyte concentration also by wearable devices. In this review, we present the current state of potassium and calcium concentration monitoring using the ECG and summarize results from previous work. Selected clinical studies are presented, supporting or questioning the use of the ECG for the monitoring of electrolyte concentration imbalances. Differences in the findings from automatic monitoring studies are discussed, and current studies utilizing machine learning are presented demonstrating the potential of the deep learning approach. Furthermore, we demonstrate the potential of computational modeling approaches to gain insight into the mechanisms of relevant clinical findings and as a tool to obtain synthetic data for methodical improvements in monitoring approaches.


Figures

FIG. 1.
FIG. 1.
Each section of this work can be attributed to at least one of the topics in the green boxes. Although they are separated in this diagram, they are closely connected and depend on each other. That is why collaboration between the fields is of paramount importance.
FIG. 2.
FIG. 2.
Typical ECG features evaluated to determine concentration changes. The figure visualizes only a subset of 33 features that were analyzed in this work. Reprinted with permission from Dillon et al., J. Electrocardiol. 48(1), 12–18 (2015). Copyright 2015, Elsevier.
FIG. 3.
FIG. 3.
Overview of the two approaches for automatic concentration estimation found in the literature. In contrast to the classical approach where lead selection, feature selection, and model fitting are separated, in the deep learning approach, they are inherently integrated.
FIG. 4.
FIG. 4.
Explainability approach by visualization of parts of the input ECG being relevant for the classification and quantification of the potassium disorder. Important/unimportant parts of the ECG traces are visualized with bright and dark red bars under the traces. The rhythm classification is shown with black/greed/yellow backgrounds. Reproduced with permission from Lin et al., JMIR Med. Inf. 8(3), e15931 (2020). Copyright 2020, Authors licensed under a Creative Commons Attribution (CC BY) license.
FIG. 5.
FIG. 5.
An example to illustrate the problem of using mean and standard deviation as sole performance parameters. (a) Two exemplary datasets D1 and D2 with a uniform and normal distribution, respectively. (b) An exemplary linear feature concentration dependence. For the subsequent fitting, feature values were randomly distorted by up to 5.5%. (c) The result of two regression methods. Method M1 is a fit with a constant minimizing the error, and model M2 is a linear fit in the least squares sense. The light red (dataset D2) and light blue (dataset D1) point clouds visualize the noisy feature inputs for the fitting yielding the models in red and blue, respectively. The dashed line is the real noise-free relation. (d) Results of both methods on both datasets. Although the combination of M2/D1 reconstructs the underlying dependency over the whole interval best, it is outperformed by the combination M2/D2 and M1/D2 when considering the mean absolute error. Within a dataset, the linear model (M2) always outperforms the constant (M1) as expected.
FIG. 6.
FIG. 6.
Potassium concentration estimation results by Corsi et al. Left: relation of the selected feature T wave downslope divided by T amplitude and the potassium blood measurement including a patient specific bias. Right: Bland–Altman plot of the estimation error. It is apparent that the method does not perform well for higher concentrations. Reproduced with permission from Corsi et al., Sci. Rep. 7, 42492 (2017). Copyright 2017, Authors licensed under a Creative Commons Attribution (CC BY) license.

Similar articles

Cited by

References

    1. Nilsson E., Gasparini A., Ärnlöv J., Xu H., Henriksson K. M., Coresh J., Grams M. E., and Carrero J. J., “ Incidence and determinants of hyperkalemia and hypokalemia in a large healthcare system,” Int. J. Cardiol. 245, 277–284 (2017).10.1016/j.ijcard.2017.07.035 - DOI - PubMed
    1. Ong H.-Y., “ Competency-based critical care,” in Renal Failure and Replacement Therapies, edited by Blakeley S. ( Springer, London, 2008).
    1. Di Lullo L., Rivera R., Barbera V., Bellasi A., Cozzolino M., Russo D., De Pascalis A., Banerjee D., Floccari F., and Ronco C., “ Sudden cardiac death and chronic kidney disease: From pathophysiology to treatment strategies,” Int. J. Cardiol. 217, 16–27 (2016).10.1016/j.ijcard.2016.04.170 - DOI - PubMed
    1. Genovesi S., Valsecchi M. G., Rossi E., Pogliani D., Acquistapace I., De Cristofaro V., Stella A., and Vincenti A., “ Sudden death and associated factors in a historical cohort of chronic haemodialysis patients,” Nephrol., Dial., Transplant. 24, 2529–2536 (2009).10.1093/ndt/gfp104 - DOI - PubMed
    1. Joki N., Tokumoto M., Takahashi N., and Nishimura M., “ Current perspectives on sudden cardiac death in hemodialysis patients,” Contrib. Nephrol. 196, 5–12 (2018).10.1159/issn.0302-5144 - DOI - PubMed