. 2020 Sep 23;2(10):e0191.
doi: 10.1097/CCE.0000000000000191. eCollection 2020 Oct.

Pathophysiologic Signatures of Bloodstream Infection in Critically Ill Adults

Affiliations

Pathophysiologic Signatures of Bloodstream Infection in Critically Ill Adults

Alex N Zimmet et al. Crit Care Explor. .

Abstract

Objectives: Bloodstream infection is associated with high mortality rates in critically ill patients but is difficult to identify clinically. This results in frequent blood culture testing, exposing patients to additional costs as well as the potential harms of unnecessary antibiotics. The purpose of this study was to assess whether the analysis of bedside physiologic monitoring data could accurately describe a pathophysiologic signature of bloodstream infection in patients admitted to the ICU.

Design: Development of a statistical model using physiologic data from a retrospective observational cohort.

Setting: University of Virginia Medical Center (Charlottesville, VA), a tertiary-care academic medical center.

Patients: Critically ill patients consecutively admitted to either the medical or surgical/trauma ICUs with available physiologic monitoring data between February 2011 and June 2015.

Interventions: None.

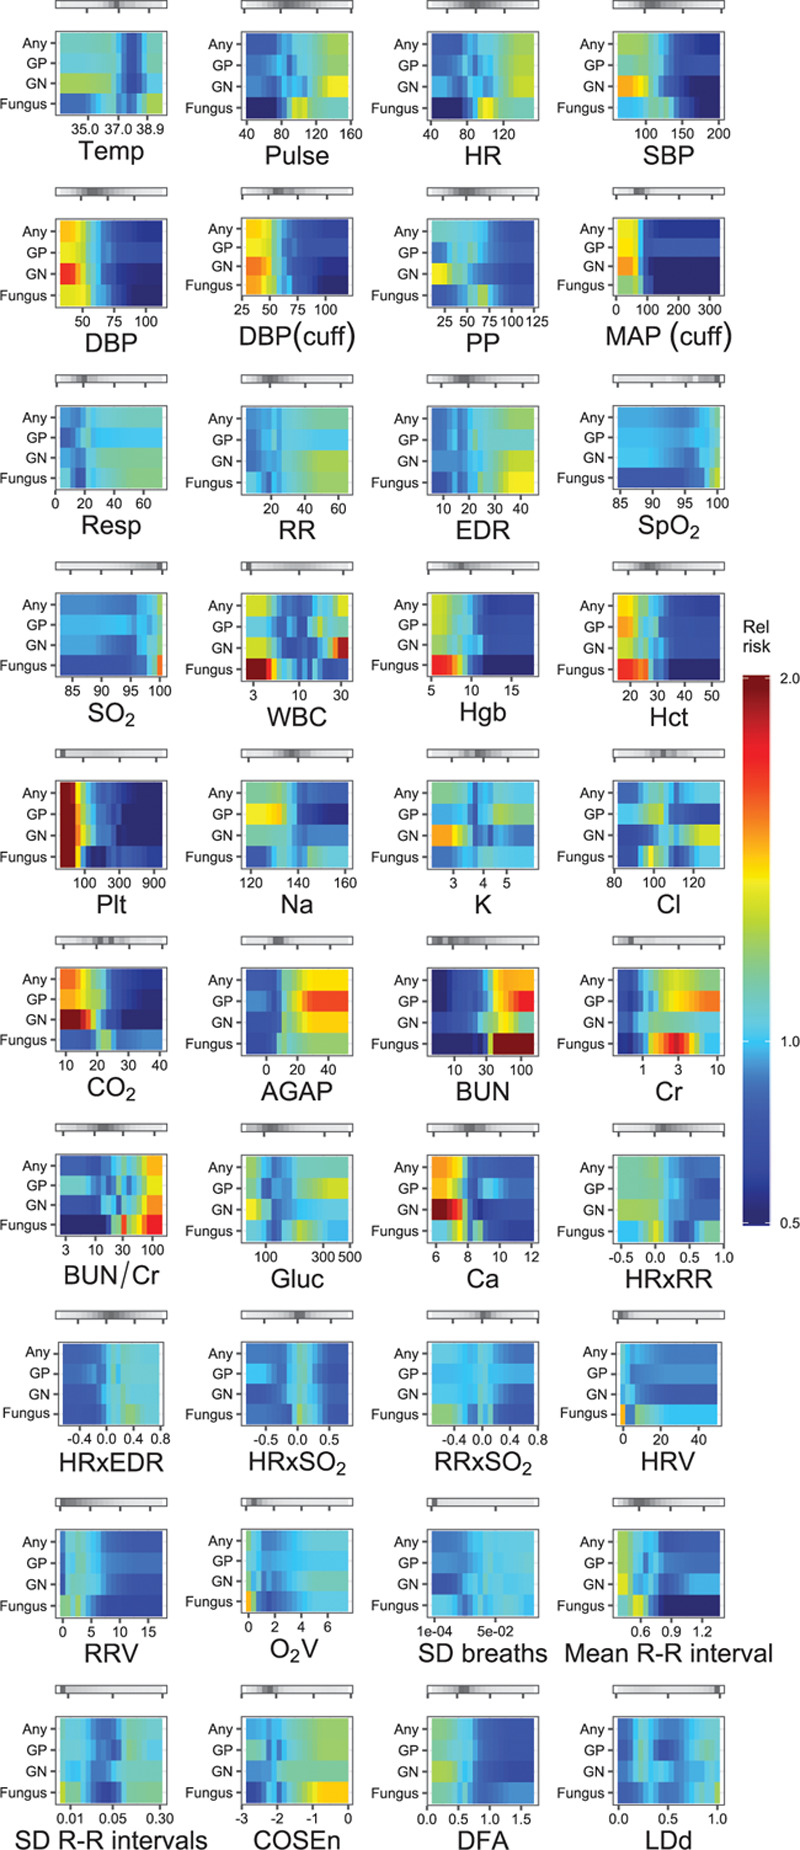
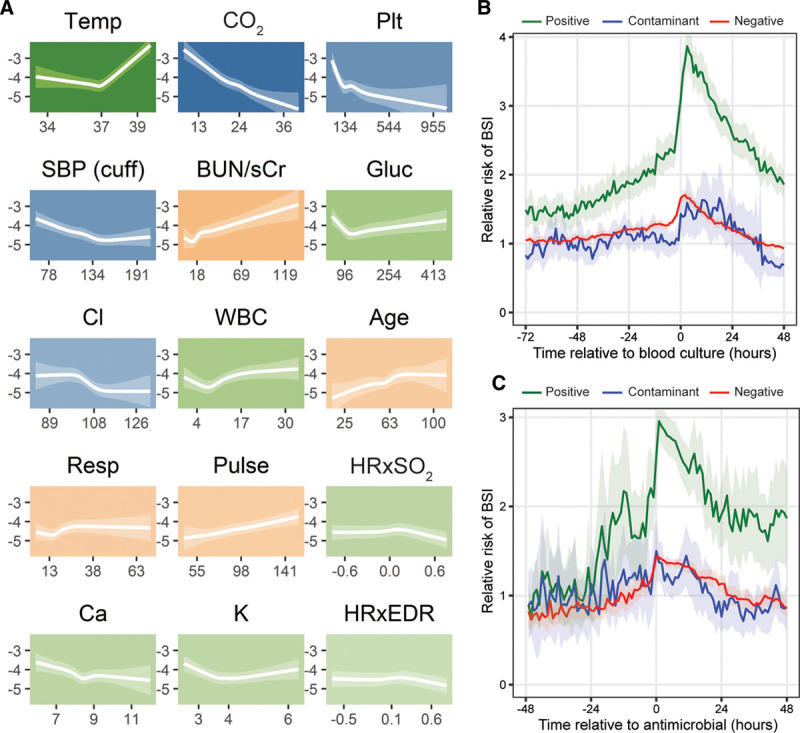
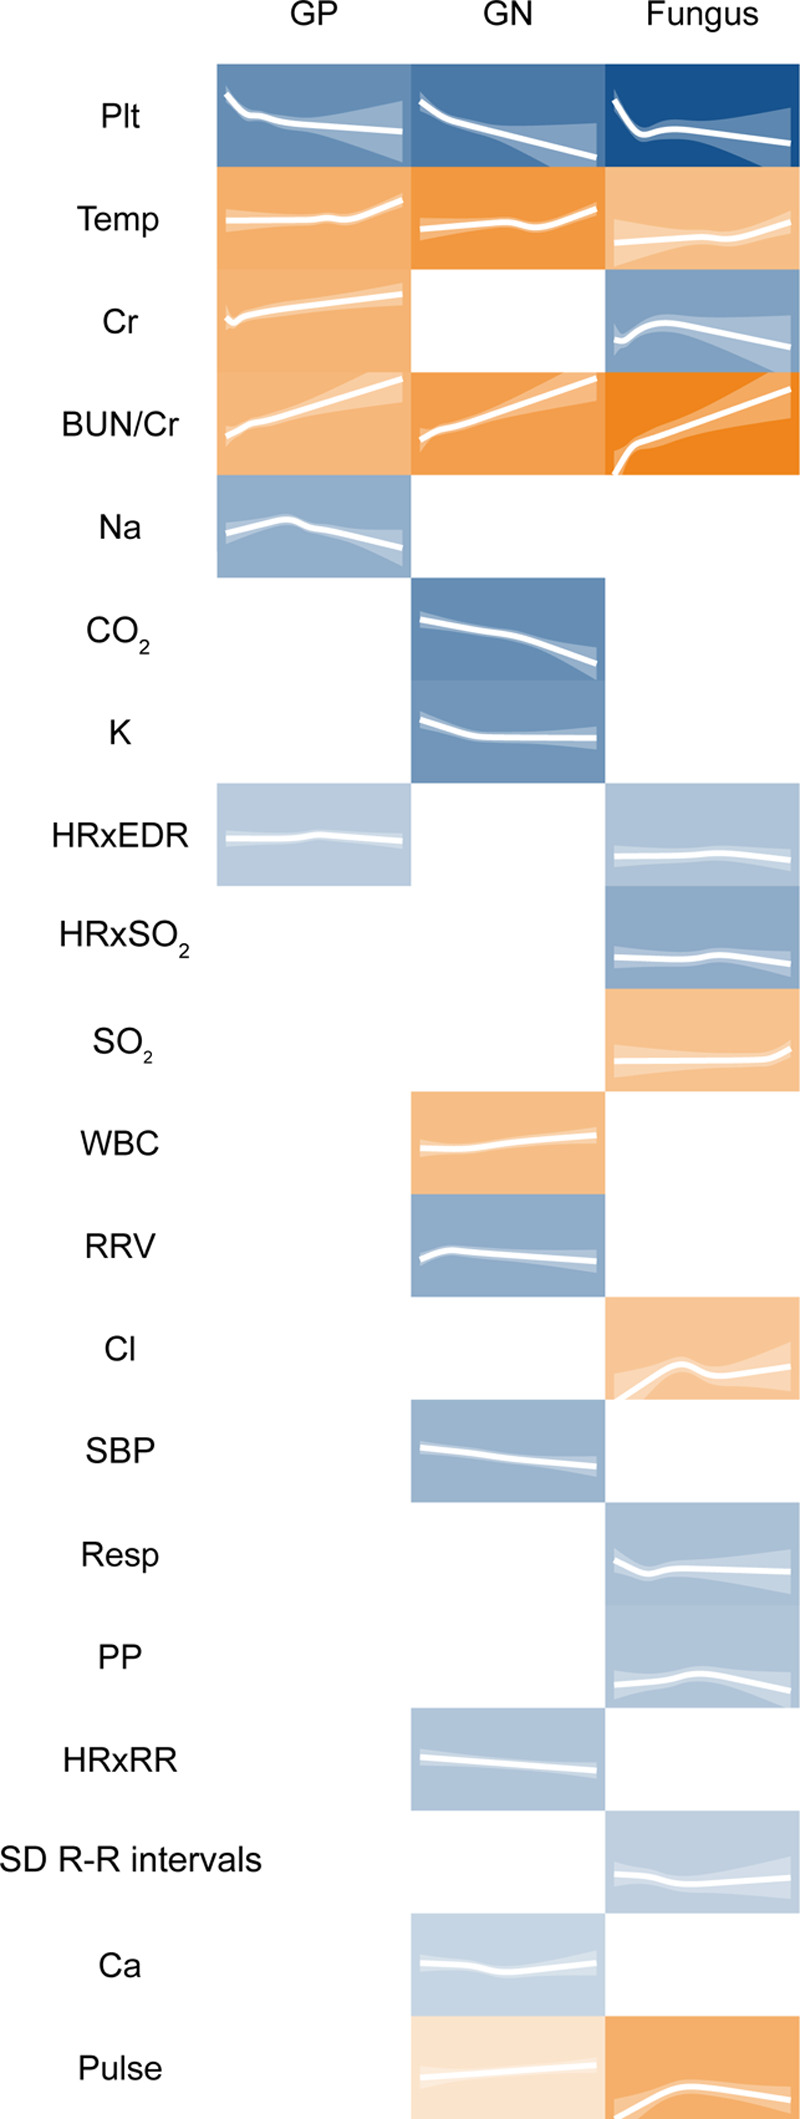
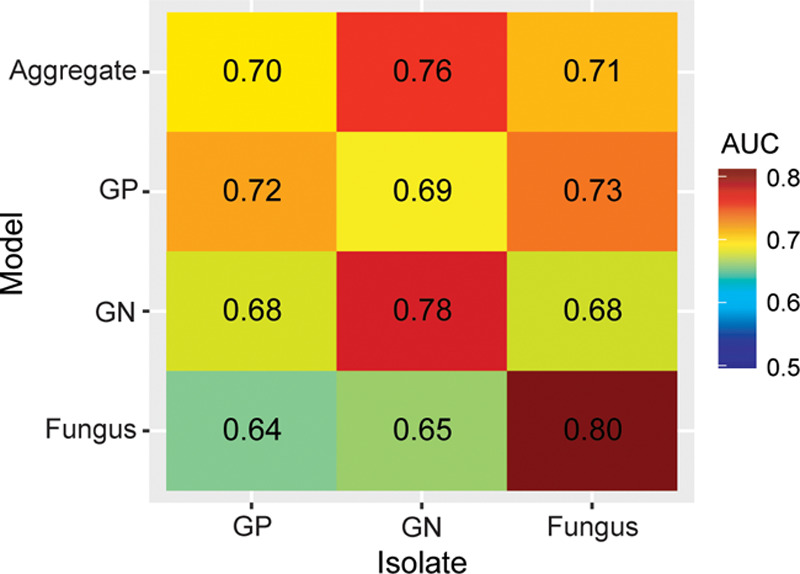
Measurements and main results: We analyzed 9,954 ICU admissions with 144 patient-years of vital sign and electrocardiography waveform data, totaling 1.3 million hourly measurements. There were 15,577 blood culture instances, with 1,184 instances of bloodstream infection (8%). The multivariate pathophysiologic signature of bloodstream infection was characterized by abnormalities in 15 different physiologic features. The cross-validated area under the receiver operating characteristic curve was 0.78 (95% CI, 0.69-0.85). We also identified distinct signatures of Gram-negative and fungal bloodstream infections, but not Gram-positive bloodstream infection.

Conclusions: Signatures of bloodstream infection can be identified in the routine physiologic monitoring data of critically ill adults. This may assist in identifying infected patients, maximizing diagnostic stewardship, and measuring the effect of new therapeutic modalities for sepsis.

Keywords: bacteremia; critical care; fungemia; physiologic monitoring; sepsis; statistical models.


Conflict of interest statement

Dr. Clark is employed by and holds equity in Advanced Medical Predictive Devices, Diagnostics, and Displays (AMP3D), Charlottesville, VA, which has licensed technologies from the University of Virginia Licensing and Ventures Group. Dr. Moorman is the chief medical officer of and holds equity in AMP3D. The remaining authors have disclosed that they do not have any potential conflicts of interest.

Figures

Figure 1.
Figure 1.
Heat map depiction of the univariate risk of different classes of bloodstream infection (BSI) as a function of 40 measured physiologic variables in 9,954 critically ill patients, 2011–2015. Each tile plots the value of the variable on the x-axis against the relative risk of BSI isolate class per ventile of the variable on the y-axis. A red color saturation indicates higher relative risk of the isolate class for that ventile of the variable; a blue saturation indicates a lower relative risk. The gray bars above each tile indicate the distribution of measurements for each variable—darker gray indicates more measurements present in that range of the variable. AGAP = anion gap (mEq/L), BUN = blood urea nitrogen (mg/dL), BUN/Cr = blood-urea-nitrogen-to-serum-creatinine ratio, Ca = serum calcium concentration (mg/dL), Cl = serum chloride concentration (mmol/L), CO2 = serum bicarbonate (mmol/L), COSEn = coefficient of sample entropy of R-R interval, Cr = serum creatinine (mg/dL), DBP (cuff) = cuff-measured diastolic blood pressure (mm Hg), DBP = invasive diastolic blood pressure (mm Hg), DFA = detrended fluctuation analysis applied to R-R intervals, EDR = electrocardiogram-derived respiratory rate (breaths/min), Gluc = blood glucose (mg/dL), GN = Gram negative, GP = Gram positive, Hct = hematocrit (%), HR = heart rate measured by cardiac telemetry (beats/min), HRV = sd of heart rate by cardiac telemetry (beats/min), HRxEDR = cross-correlation coefficient of heart rate and electrocardiogram-derived respiratory rate, HRxRR = cross-correlation coefficient of heart rate measured by cardiac telemetry and respiratory rate measured by chest impedance, HRxSO2 = cross-correlation coefficient of heart rate measured by cardiac telemetry and oxygen saturation measured by continuous pulse oximetry, K = serum potassium concentration (mmol/L), LDd = local dynamics density of heart rate, MAP (cuff) = cuff-measured mean arterial pressure (mm Hg), Mean R-R interval = mean R-R interval by cardiac telemetry (s), Na = serum sodium concentration (mEq/L), O2V = sd of oxygen saturation by pulse oximetry (%), Plt = platelet concentration (k/uL), PP = pulse pressure (mm Hg), Pulse = heart rate measured by pulse oximetry (beats/min), Resp = clinician-documented respiratory rate (breaths/min), RR = respiratory rate measured by chest impedance (breaths/min), RRV = sd of respiratory rate by chest impedance (breaths/min), RRxSO2 = cross-correlation coefficient of respiratory rate measured by chest impedance and oxygen saturation measured by pulse oximetry, SBP = invasive systolic blood pressure (mm Hg), sd breaths = sd of electrocardiogram-derived respiratory rate (breaths/min), sd R-R intervals = sd of the R-R interval by cardiac telemetry (s), SO2 = oxygen saturation measured by continuous pulse oximetry (%), Hgb = hemoglobin (g/dL), SpO2 = clinician-documented oxygen saturation (%), Temp = temperature (°C).
Figure 2.
Figure 2.
Pathophysiologic model of bloodstream infection (BSI) in critically ill adults. A, Fifteen pathophysiological features comprising a signature of BSI in 9,954 critically ill patients, 2011–2015. Each tile plots the value of the feature on the x-axis against the log-odds of BSI on the y-axis. The translucent ribbon represents the 95% CI. Background hue represents the direction of association with BSI—orange indicates positive association, blue indicates negative association, and green indicates nonlinear or biphasic association. Background color saturation indicates the strength of the association with BSI. B, Predicted risk of BSI according to a multivariate logistic regression model as a function of time relative to blood culture. The translucent ribbon represents the 95% CI. C, Predicted risk of BSI according to a multivariate logistic regression model as a function of time relative to antimicrobial administration. The translucent ribbon represents the 95% CI. Patient data were grouped as positive, negative, or contaminant based on the ultimate result of the culture instance at time 0. BUN/sCr = blood-urea-nitrogen-to-serum-creatinine ratio, Ca = serum calcium concentration (mg/dL), Cl = serum chloride concentration (mmol/L), CO2 = serum bicarbonate (mmol/L), Gluc = blood glucose (mg/dL), HRxEDR = cross-correlation coefficient of heart rate and electrocardiogram-derived respiratory rate, HRxSO2 = cross-correlation coefficient of heart rate and oxygen saturation by continuous pulse oximetry, K = serum potassium concentration (mmol/L), Plt = platelet concentration (k/uL), Pulse = heart rate measured by pulse oximetry (beats/min), Resp = clinician-documented respiratory rate (breaths/min), SBP (cuff) = cuff-measured systolic blood pressure (mm Hg), Temp = temperature (degrees Celsius).
Figure 3.
Figure 3.
Individual pathophysiological signatures of Gram-positive (GP), gram-negative (GN), and fungal bloodstream infections (BSIs) identified from 9,954 critically ill patients, 2011–2015. Each tile plots the value of the feature against the log-odds of BSI. The translucent ribbon represents the 95% CI. Background hue represents the direction of association with BSI—orange indicates positive association and blue indicates negative association. Background color saturation indicates the strength of the association with BSI. BUN/sCr = blood-urea-nitrogen-to-serum-creatinine ratio, Ca = serum calcium concentration (mg/dL), Cl = serum chloride concentration (mmol/L), CO2 = serum bicarbonate (mmol/L), Cr = serum creatinine (mg/dL), HRxEDR = cross-correlation coefficient of heart rate and electrocardiogram-derived respiratory rate, HRxRR = cross-correlation coefficient of heart rate measured by cardiac telemetry and respiratory rate measured by chest impedance, HRxSO2 = cross-correlation coefficient of heart rate and oxygen saturation by continuous pulse oximetry, K = serum potassium concentration (mmol/L), Na = serum sodium concentration (mEq/L), Plt = platelet concentration (k/uL), PP = pulse pressure (mm Hg), Pulse = heart rate measured by pulse oximetry (beats/min), Resp = clinician-documented respiratory rate (breaths/min), SBP = invasive systolic blood pressure (mm Hg), sd R-R intervals = sd of the R-R interval by cardiac telemetry (s), SO2 = oxygen saturation measured by continuous pulse oximetry (%), Temp = temperature (°C), RRV = sd of respiratory rate by chest impedance (breaths/min).
Figure 4.
Figure 4.
Area under the receiver operating characteristic curve (AUC) for models of aggregate, Gram-positive (GP), Gram-negative (GN), and fungal bloodstream infections (BSI), evaluated on all isolate classes against negative blood cultures among 1,184 instances of BSI in critically ill patients, 2011–2015. GN and fungal BSIs are well predicted by their own models, whereas fungal BSI is also reasonably well predicted by the GP model. GP BSI is not well predicted by any model.

References

    1. Weinstein MP, Murphy JR, Reller LB, et al. The clinical significance of positive blood cultures: A comprehensive analysis of 500 episodes of bacteremia and fungemia in adults. II. Clinical observations, with special reference to factors influencing prognosis. Rev Infect Dis. 1983; 5:54–70 - PubMed
    1. Weinstein MP, Towns ML, Quartey SM, et al. The clinical significance of positive blood cultures in the 1990s: A prospective comprehensive evaluation of the microbiology, epidemiology, and outcome of bacteremia and fungemia in adults. Clin Infect Dis. 1997; 24:584–602 - PubMed
    1. Laupland KB, Church DL. Population-based epidemiology and microbiology of community-onset bloodstream infections. Clin Microbiol Rev. 2014; 27:647–664 - PMC - PubMed
    1. Edgeworth JD, Treacher DF, Eykyn SJ. A 25-year study of nosocomial bacteremia in an adult intensive care unit. Crit Care Med. 1999; 27:1421–1428 - PubMed
    1. Pittet D, Tarara D, Wenzel RP. Nosocomial bloodstream infection in critically ill patients. Excess length of stay, extra costs, and attributable mortality. JAMA. 1994; 271:1598–1601 - PubMed