. 2020 Dec;61(12):2811-2824.
doi: 10.1111/epi.16715. Epub 2020 Oct 16.

Neocortical injury-induced status epilepticus

Affiliations

Neocortical injury-induced status epilepticus

Tanveer Singh et al. Epilepsia. 2020 Dec.

Abstract

Objective: To characterize neocortical onset status epilepticus (SE) in the C57BL/6J mouse.

Methods: We induced SE by administering homocysteine 16-18 hours after cobalt (Co) implantation. SE was monitored by video and electroencephalography (EEG). We evaluated brain structure with magnetic resonance imaging (MRI). Neurodegeneration was evaluated 72 hours after SE using Fluoro-Jade C staining.

Results: Cobalt triggered seizures in a dose-dependent manner (median effective dose, ED50 = 0.78 mg) and the latency to peak seizure frequency shortened with increased dose. Animals developed SE after homocysteine administration. SE began with early intermittent focal seizures, consisting of frontal onset rhythmic spike-wave discharges manifested as focal dystonia with clonus. These focal seizures then evolved into generalized continuous convulsive activity. Behavioral manifestations of SE included tonic stiffening, bilateral limb clonus, and bilateral tonic-clonic movements, which were accompanied by generalized rhythmic spike-wave discharges on EEG. After prolonged seizures, animals became comatose with intermittent bilateral myoclonic seizures or jerks. During this period, EEG showed seizures interspersed with generalized periodic discharges on a suppressed background. MRI obtained when animals were in a coma revealed edema, midline shift in frontal lobe around the Co implantation site, and ventricular effacement. Fluoro-Jade C staining revealed neurodegeneration in the cortex, amygdala, and thalamus.

Significance: We have developed a mouse model of severe, refractory cortical-onset SE, consisting of convulsions merging into a coma, EEG patterns of cortical seizures, and injury, with evidence of widespread neocortical edema and damage. This model replicates many features of acute seizures and SE resulting from traumatic brain injury, subarachnoid, and lobar hemorrhage.

Keywords: Fluoro-Jade C; burst suppression; cobalt; edema; seizure.


Conflict of interest statement

CONFLICT OF INTEREST

None of the authors has any conflict of interest to disclose.

Figures
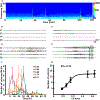
FIGURE 1
FIGURE 1
Electroencephalography (EEG) and seizure semiology observed after cobalt (Co) implantation. A, The total power of EEG recorded from the ipsilateral frontal (Fi) electrode during peak seizure frequency was plotted against time. The power is in the range of 0–40 Hz. The scale bar represents power in μV2. B and C, EEG traces recorded from four cortical electrodes: ipsilateral frontal (Fi), contralateral frontal (Fc), ipsilateral parietal (Pi), and contralateral parietal (Pc). Traces illustrate that electrographic activity associated with focal motor seizures was manifest as focal dystonia with clonus. Electrographic seizure activity was recorded from frontal electrodes only. D and E, Electrographic seizure activity during seizures that were manifested as focal dystonia with clonus with secondary generalization. F, The number of seizures recorded during 4-hour bins for each of the Co doses. The doses of Co used were 0.44 (n = 8), 0.66 (n = 13), 0.88 (n = 8), 1.76 (n = 12), and 2.11(n = 7) mg. Values are expressed as a mean ± standard error of the mean (SEM). G, The dose-response curve of Co dose and number of seizures. The line represents nonlinear four parametric fits of the data and represents median effective dose (ED50). All data in this figure are from cohort 1
FIGURE 2
FIGURE 2
Histological effect of cobalt (Co) implantation. A, Serial coronal sections are illustrating Co lesion from anterior to posterior 24 h post-Co (2.1 mg) implantation (arranged from left to right). Images are taken at 2× magnification and scale bar = 300μm. B, Fluoro-Jade C (FJC) staining in the ipsilateral frontal cortex corresponding to the lesion, 24 h after the Co implantation. Please note extensive FJC-positive cells in the sections encompassing the lesion and sparse labeling posterior to the lesion (arranged from left to right) (n = 5). Image magnification was 20× and Scale bar = 300 μm. C and D, The number of FJC-positive cells was counted in representative microscopic fields (20× magnification) in different regions of the coronal brain section encompassing lesion by an (C) unblinded and (D) blinded observer (n = 5). All data in this figure are from cohort 2
FIGURE 3
FIGURE 3
Electroencephalography (EEG) patterns marking early focal intermittent seizures, continuous generalized convulsive seizures, and coma phase during status epilepticus (SE). EEG and associated behavior patterns during cobalt (Co)-homocysteine-induced SE. A, The total power of EEG recorded from the ipsilateral frontal (Fi) electrode was plotted against time. The power is in the range of 0–40 Hz. The scale bar represents power in μV2. Time 0 corresponds homocysteine injection. B-E, EEG traces recorded from four cortical electrodes—ipsilateral frontal (Fi), contralateral frontal (Fc), ipsilateral parietal (Pi), and contralateral parietal (Pc)—illustrating activity associated with behaviors corresponding to the early focal intermittent seizure phase. (B) Unilateral forepaw clonus (stage1) and (C) focal dystonia with clonus (stage 2), continuous generalized convulsive seizure phase, that is, (D) tonic stiffening (stage 3) and bilateral clonus (stage 4), and (E) generalized tonic-clonic seizure with loss of posture (stage 5). Please note the changes in EEG recorded from frontal electrode (F-I) EEG patterns observed during the coma and burst suppression phase. F, periodic epileptiform discharges, G, periodic epileptiform discharges with burst patterns (H) burst suppression patterns, and (I) complete suppression of electrographic activity, which marked the end of SE (n = 7). J, Kaplan-Meier curve illustrating the duration of SE. Percentage of animals in SE and 95% confidence intervals plotted against time (n = 7). The total duration of the SE was divided into 10-min slots. The event (end of SE) was plotted slot-wise in a Kaplan-Meier curve. K, The pie chart shows the percentage of time spent by the animals in each stage of behavior observed during SE. The numbers in the wedges represent the average percentage of time spent in the respective phase (n = 5). L, Kaplan-Meier curve illustrating the survival of animals after SE. Percentage of animals survived and 95% confidence intervals were plotted against time (n = 7). The total duration after SE was divided into a 1 h slot. The event (death of the animal) was plotted slot-wise in the Kaplan-Meier curve. All data in this figure are from cohort 4
FIGURE 4
FIGURE 4
Electroencephalography (EEG) power during cobalt (Co)-homocysteine-induced status epilepticus (SE). A plot of EEG power in each of the (A) delta, (B) theta, (C) alpha, (D) beta, and (E) gamma frequencies for 1-min intervals from the injection of homocysteine to the end of SE in animals. All data in this figure are from cohort 4. The power in each frequency range was normalized to its baseline frequency (n = 5). Time 0 represents injection of homocysteine
FIGURE 5
FIGURE 5
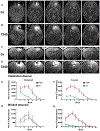
Spatial distribution of cerebral edema in animals with cobalt (Co) and Co-homocysteine-induced status epilepticus (SE). The spatial distribution of cerebral edema in Co animals (Co) and Co-homocysteine animals developing SE (240 min following homocysteine administration during coma phase) (T240) as assessed in vivo by a 7.0 T magnetic resonance (MR) system. A and B, T2-weighted horizontal brain images displaying region-dependent severity of cerebral edema in animals implanted with (A) Co and (B) Co-homocysteine animals developing SE. C and D, T2-weighted coronal brain images showing region-dependent severity of cerebral edema in animals embedded with (C) Co and (D) Co-homocysteine animals developing SE (n = 5 for each Co and Co-homocysteine SE). E and F, The increased T2 signal measured by an unblinded observer in each slice for both coronal and horizontal orientations. G and H, The increased T2 signal measured by a blinded observer in each slice for both coronal and horizontal directions. Co and T240 animals are shown as a blue and magenta line graph, respectively. All data in this figure represent cohort 5
FIGURE 6
FIGURE 6
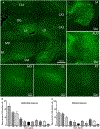
Fluoro-Jade C (FJC)–positive neurons in several brain regions at 72 h after status epilepticus (SE). A, Widespread neurodegeneration was observed in various parts of the cortex, thalamus, and amygdala 72 h following SE. B and C, The number of FJC-positive cells was counted in representative microscopic fields (10× magnification) in different regions of the coronal brain section by a (B) unblinded (TS), and (C) blinded observer (SJ) (n = 5). All data in this figure represent cohort 6. AUD, auditory cortex; CA1, cornu ammonis 1; CA2, cornu ammonis 2; CA3, cornu ammonis 3 regions of the hippocampus; DG, dentate gyrus; IMD, intermediodorsal nucleus of the thalamus; LA, lateral amygdala; LD, lateral dorsal nucleus of thalamus; LP, lateral posterior nucleus of the thalamus; MD, mediodorsal nucleus of thalamus; MOs, motor area cortex; RE, nucleus of reuniens; RT, reticular nucleus of thalamus; SS, somatosensory cortex; VM, ventral medial nucleus of the thalamus.

References

    1. Trinka E, Cock H, Hesdorffer D, Rossetti AO, Scheffer IE, Shinnar S, et al. A definition and classification of status epilepticus – report of the ILAE task force on classification of status epilepticus. Epilepsia. 2015;56:1515–23. - PubMed
    1. DeLorenzo RJ, Hauser WA, Towne AR, Boggs JG, Pellock JM, Penberthy L, et al. A prospective, population-based epidemiologic study of status epilepticus in Richmond, Virginia. Neurology. 1996;46:1029–35. - PubMed
    1. Towne AR, Pellock JM, Ko D, DeLorenzo RJ. Determinants of mortality in status epilepticus. Epilepsia. 1994;35:27–34. - PubMed
    1. Neligan A, Shorvon SD. Frequency and prognosis of convulsive status epilepticus of different causes: a systematic review. Arch Neurol. 2010;67:931–40. - PubMed
    1. Herman ST, Abend NS, Bleck TP, Chapman KE, Drislane FW, Emerson RG, et al. Consensus statement on continuous EEG in critically ill adults and children, part I: Indications. J Clin Neurophysiol. 2015;32:87–95. - PMC - PubMed

Publication types