

Weekly dengue forecasts in Iquitos, Peru; San Juan, Puerto Rico; and Singapore
- PMID: 33064770
- PMCID: PMC7567393
- DOI: 10.1371/journal.pntd.0008710
Weekly dengue forecasts in Iquitos, Peru; San Juan, Puerto Rico; and Singapore
Abstract
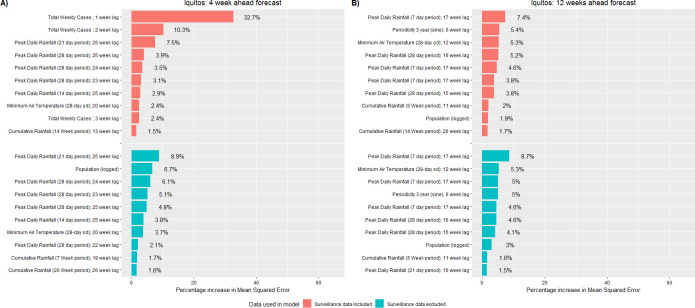
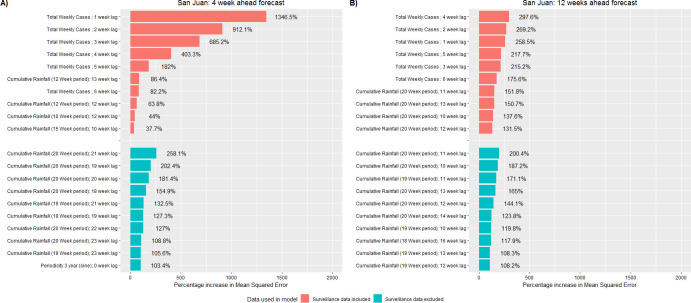
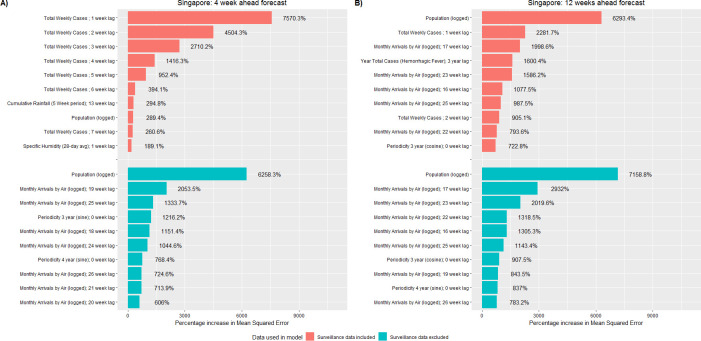
Background: Predictive models can serve as early warning systems and can be used to forecast future risk of various infectious diseases. Conventionally, regression and time series models are used to forecast dengue incidence, using dengue surveillance (e.g., case counts) and weather data. However, these models may be limited in terms of model assumptions and the number of predictors that can be included. Machine learning (ML) methods are designed to work with a large number of predictors and thus offer an appealing alternative. Here, we compared the performance of ML algorithms with that of regression models in predicting dengue cases and outbreaks from 4 to up to 12 weeks in advance. Many countries lack sufficient health surveillance infrastructure, as such we evaluated the contribution of dengue surveillance and weather data on the predictive power of these models.
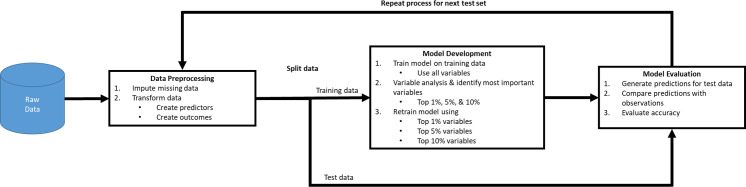
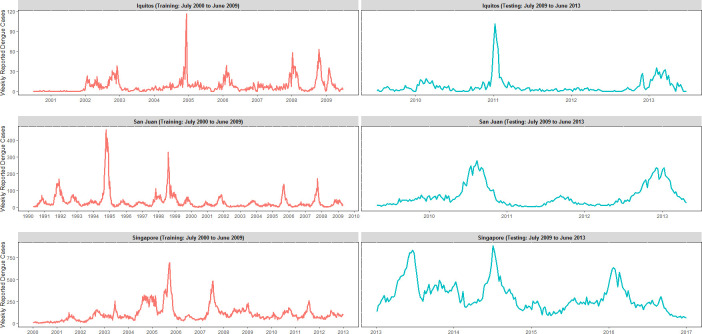
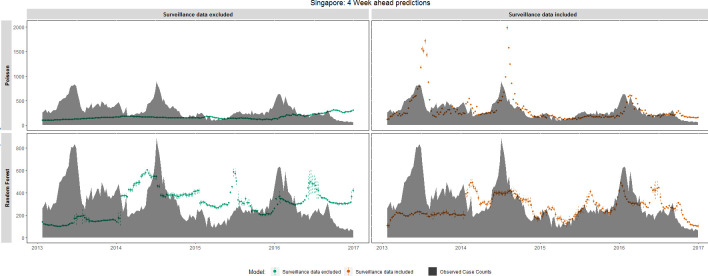
Methods: We developed ML, regression, and time series models to forecast weekly dengue case counts and outbreaks in Iquitos, Peru; San Juan, Puerto Rico; and Singapore from 1990-2016. Forecasts were generated using available weekly dengue surveillance, and weather data. We evaluated the agreement between model forecasts and actual dengue observations using Mean Absolute Error and Matthew's Correlation Coefficient (MCC).
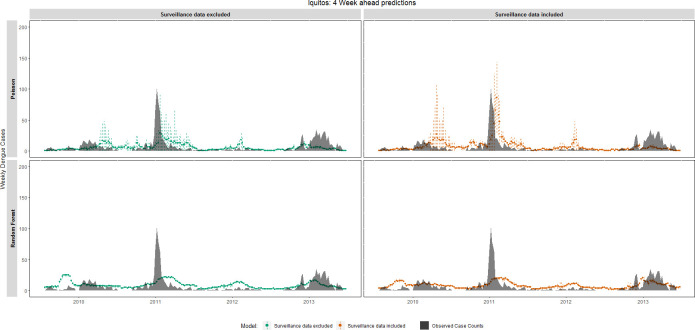
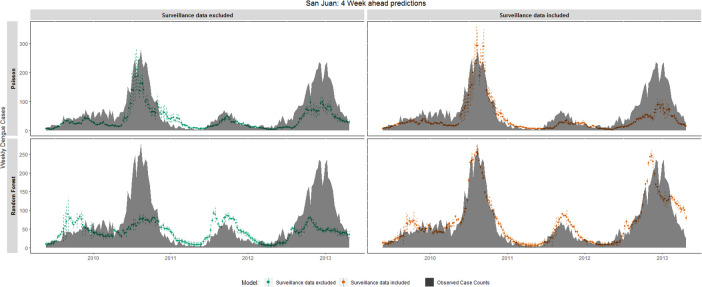
Results: For near term predictions of weekly case counts and when using surveillance data, ML models had 21% and 33% less error than regression and time series models respectively. However, using weather data only, ML models did not demonstrate a practical advantage. When forecasting weekly dengue outbreaks 12 weeks in advance, ML models achieved a maximum MCC of 0.61.
Conclusions: Our results identified 2 scenarios when ML models are advantageous over regression model: 1) predicting dengue weekly case counts 4 weeks ahead when dengue surveillance data are available and 2) predicting weekly dengue outbreaks 12 weeks ahead when dengue surveillance data are unavailable. Given the advantages of ML models, dengue early warning systems may be improved by the inclusion of these models.
Conflict of interest statement
The authors have declared that no competing interests exist.
Figures
Similar articles
-
An open challenge to advance probabilistic forecasting for dengue epidemics.Proc Natl Acad Sci U S A. 2019 Nov 26;116(48):24268-24274. doi: 10.1073/pnas.1909865116. Epub 2019 Nov 11. Proc Natl Acad Sci U S A. 2019. PMID: 31712420 Free PMC article.
-
Superensemble forecasts of dengue outbreaks.J R Soc Interface. 2016 Oct;13(123):20160410. doi: 10.1098/rsif.2016.0410. J R Soc Interface. 2016. PMID: 27733698 Free PMC article.
-
Three-Month Real-Time Dengue Forecast Models: An Early Warning System for Outbreak Alerts and Policy Decision Support in Singapore.Environ Health Perspect. 2016 Sep;124(9):1369-75. doi: 10.1289/ehp.1509981. Epub 2015 Dec 11. Environ Health Perspect. 2016. PMID: 26662617 Free PMC article.
-
Dengue epidemiology in selected endemic countries: factors influencing expansion factors as estimates of underreporting.Trop Med Int Health. 2015 Jul;20(7):840-63. doi: 10.1111/tmi.12498. Epub 2015 Mar 31. Trop Med Int Health. 2015. PMID: 25753454 Review.
-
Clinical manifestations of dengue hemorrhagic fever in Puerto Rico, 1990-1991. Puerto Rico Association of Epidemiologists.Rev Panam Salud Publica. 1997 May;1(5):381-8. doi: 10.1590/s1020-49891997000500007. Rev Panam Salud Publica. 1997. PMID: 9180059 Review.
Cited by
-
Forecasting Weekly Dengue Cases by Integrating Google Earth Engine-Based Risk Predictor Generation and Google Colab-Based Deep Learning Modeling in Fortaleza and the Federal District, Brazil.Int J Environ Res Public Health. 2022 Oct 19;19(20):13555. doi: 10.3390/ijerph192013555. Int J Environ Res Public Health. 2022. PMID: 36294134 Free PMC article.
-
Meteorological factors cannot be ignored in machine learning-based methods for predicting dengue, a systematic review.Int J Biometeorol. 2024 Mar;68(3):401-410. doi: 10.1007/s00484-023-02605-1. Epub 2023 Dec 27. Int J Biometeorol. 2024. PMID: 38150020
-
Weekly Forecasting of Yellow Fever Occurrence and Incidence via Eco-Meteorological Dynamics.Geohealth. 2023 Oct 25;7(10):e2023GH000870. doi: 10.1029/2023GH000870. eCollection 2023 Oct. Geohealth. 2023. PMID: 37885914 Free PMC article.
-
Temporal and Spatiotemporal Arboviruses Forecasting by Machine Learning: A Systematic Review.Front Public Health. 2022 Jun 3;10:900077. doi: 10.3389/fpubh.2022.900077. eCollection 2022. Front Public Health. 2022. PMID: 35719644 Free PMC article.
-
Dengue vaccine acceptability before and after the availability of COVID-19 vaccines in Puerto Rico.Vaccine. 2023 Jun 1;41(24):3627-3635. doi: 10.1016/j.vaccine.2023.04.081. Epub 2023 May 5. Vaccine. 2023. PMID: 37173267 Free PMC article.
References
-
- Beatty ME, Letson W, Edgil DM, Margolis HS. Estimating the total world population at risk for locally acquired dengue infection. American Journal of Tropical Medicine and Hygiene. 2007. pp. 221–221. - PubMed
-
- Hales S, De Wet N, Maindonald J, Woodward A. Potential effect of population and climate changes on global distribution of dengue fever: an empirical model. The Lancet. 2002;360: 830–834. - PubMed
Publication types
MeSH terms
LinkOut - more resources
Full Text Sources
Medical
